0708
MRI-perfusion derived Fractional Tumor Burden (FTB) stratifies survival in recurrent glioblastoma following treatment with bevacizumab1Radiology, Medical College of Wisconsin, Milwaukee, WI, United States, 2Neurology, Medical College of Wisconsin, Milwaukee, WI, United States, 3Biophysics, Medical College of Wisconsin, Milwaukee, WI, United States
Synopsis
Imaging response, in patients with recurrent glioblastoma (rGBM) who are treated with bevacizumab (which decreases vascular permeability), is often difficult to assess since decreased contrast agent uptake might falsely underestimate lesion size or biologic activity. Alternatively, relative cerebral blood volume (rCBV) has shown promise to identify true responders. Fractional tumor burden (FTB) maps, which are derived from rCBV, allow spatially quantifiable characterization of rGBM within lesion enhancement, and therefore may provide additional value to post-treatment response-assessment. This work demonstrates that patients with less than 75% FTB following treatment with bevacizumab have a clear progression-free and overall survival benefit.
Purpose
Bevacizumab (BEV), an FDA-approved treatment for recurrent glioblastoma (rGBM), is an anti-angiogenic agent that targets tumor blood vessels. With BEV treatment vascular permeability decreases, which can also result in decreased contrast agent uptake. This can give the potentially false impression that lesion size or biologic activity have been reduced.1 This pseudo-response phenomenon confounds the assessment of true treatment response.1 The search for an imaging biomarker to accurately predict response to BEV has included the assessment of lesion volume (LV) and relative cerebral blood volume (rCBV). An improved overall survival (OS) and progression-free survival (PFS), at 6 months post-BEV, was reported for lesion volume (LV) < 7.5cc.2 Relative cerebral blood volume (rCBV) has also shown promise for predicting response to BEV.3,4 We extend and compare this promise to the creation of fractional tumor burden (FTB) maps, which provide a measure of the percent of enhancing LV that is tumor. FTB is determined by applying a previously-identified rCBV threshold to distinguish tumor from treatment effect.5,6 The potential of FTB to predict post-BEV response, based on OS and PFS of patients with rGBM, is examined and compared to previously determined LV levels.Methods
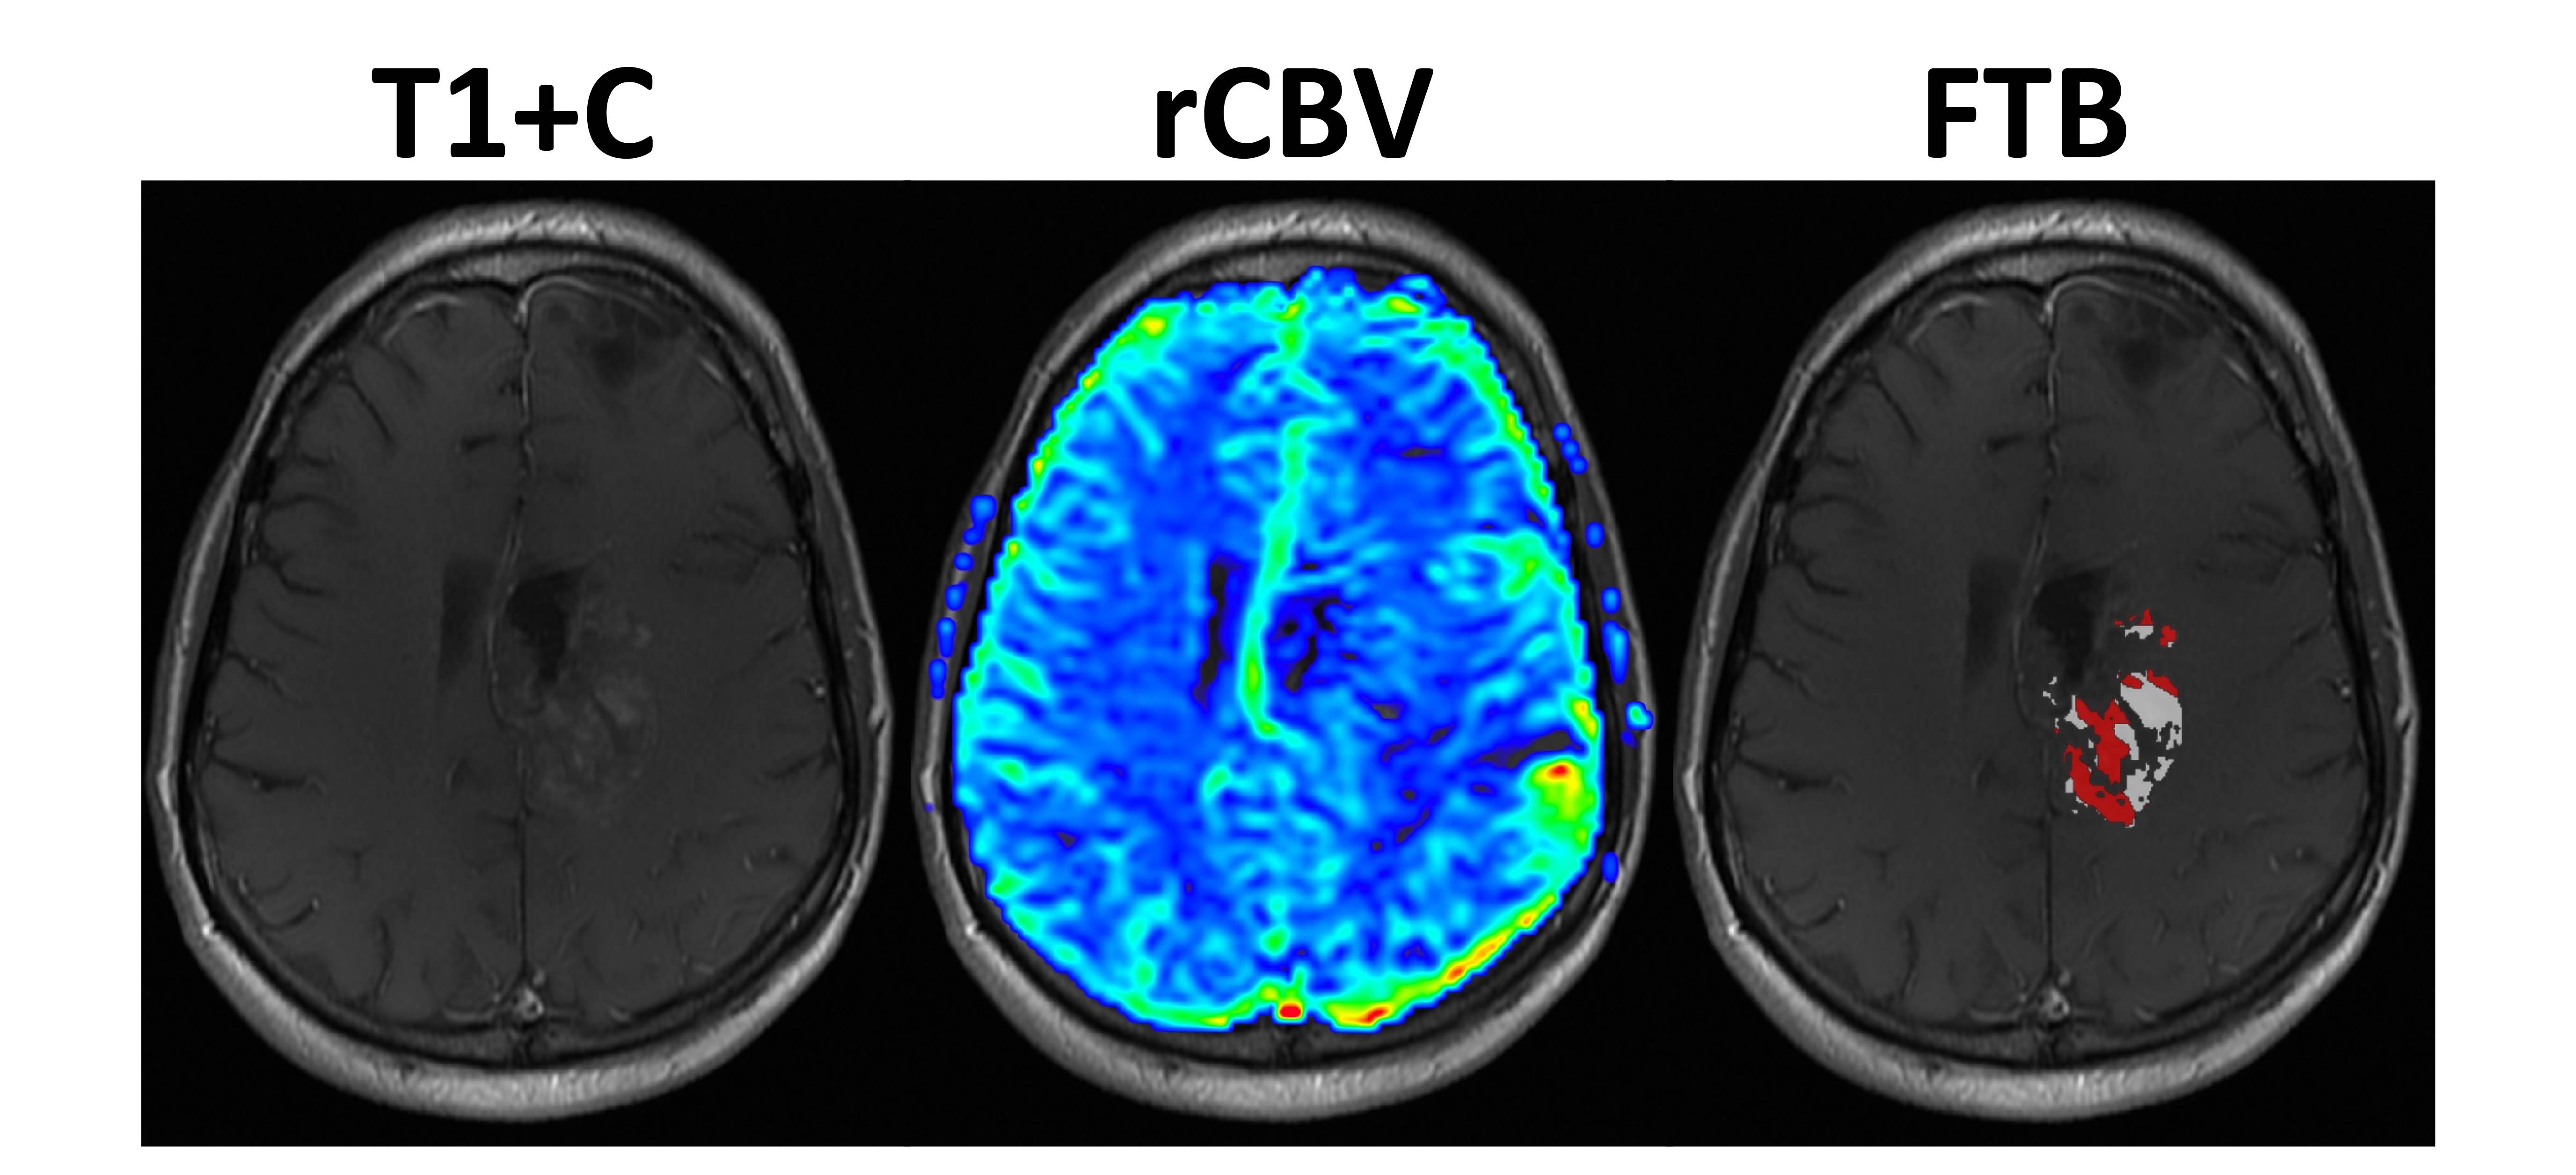
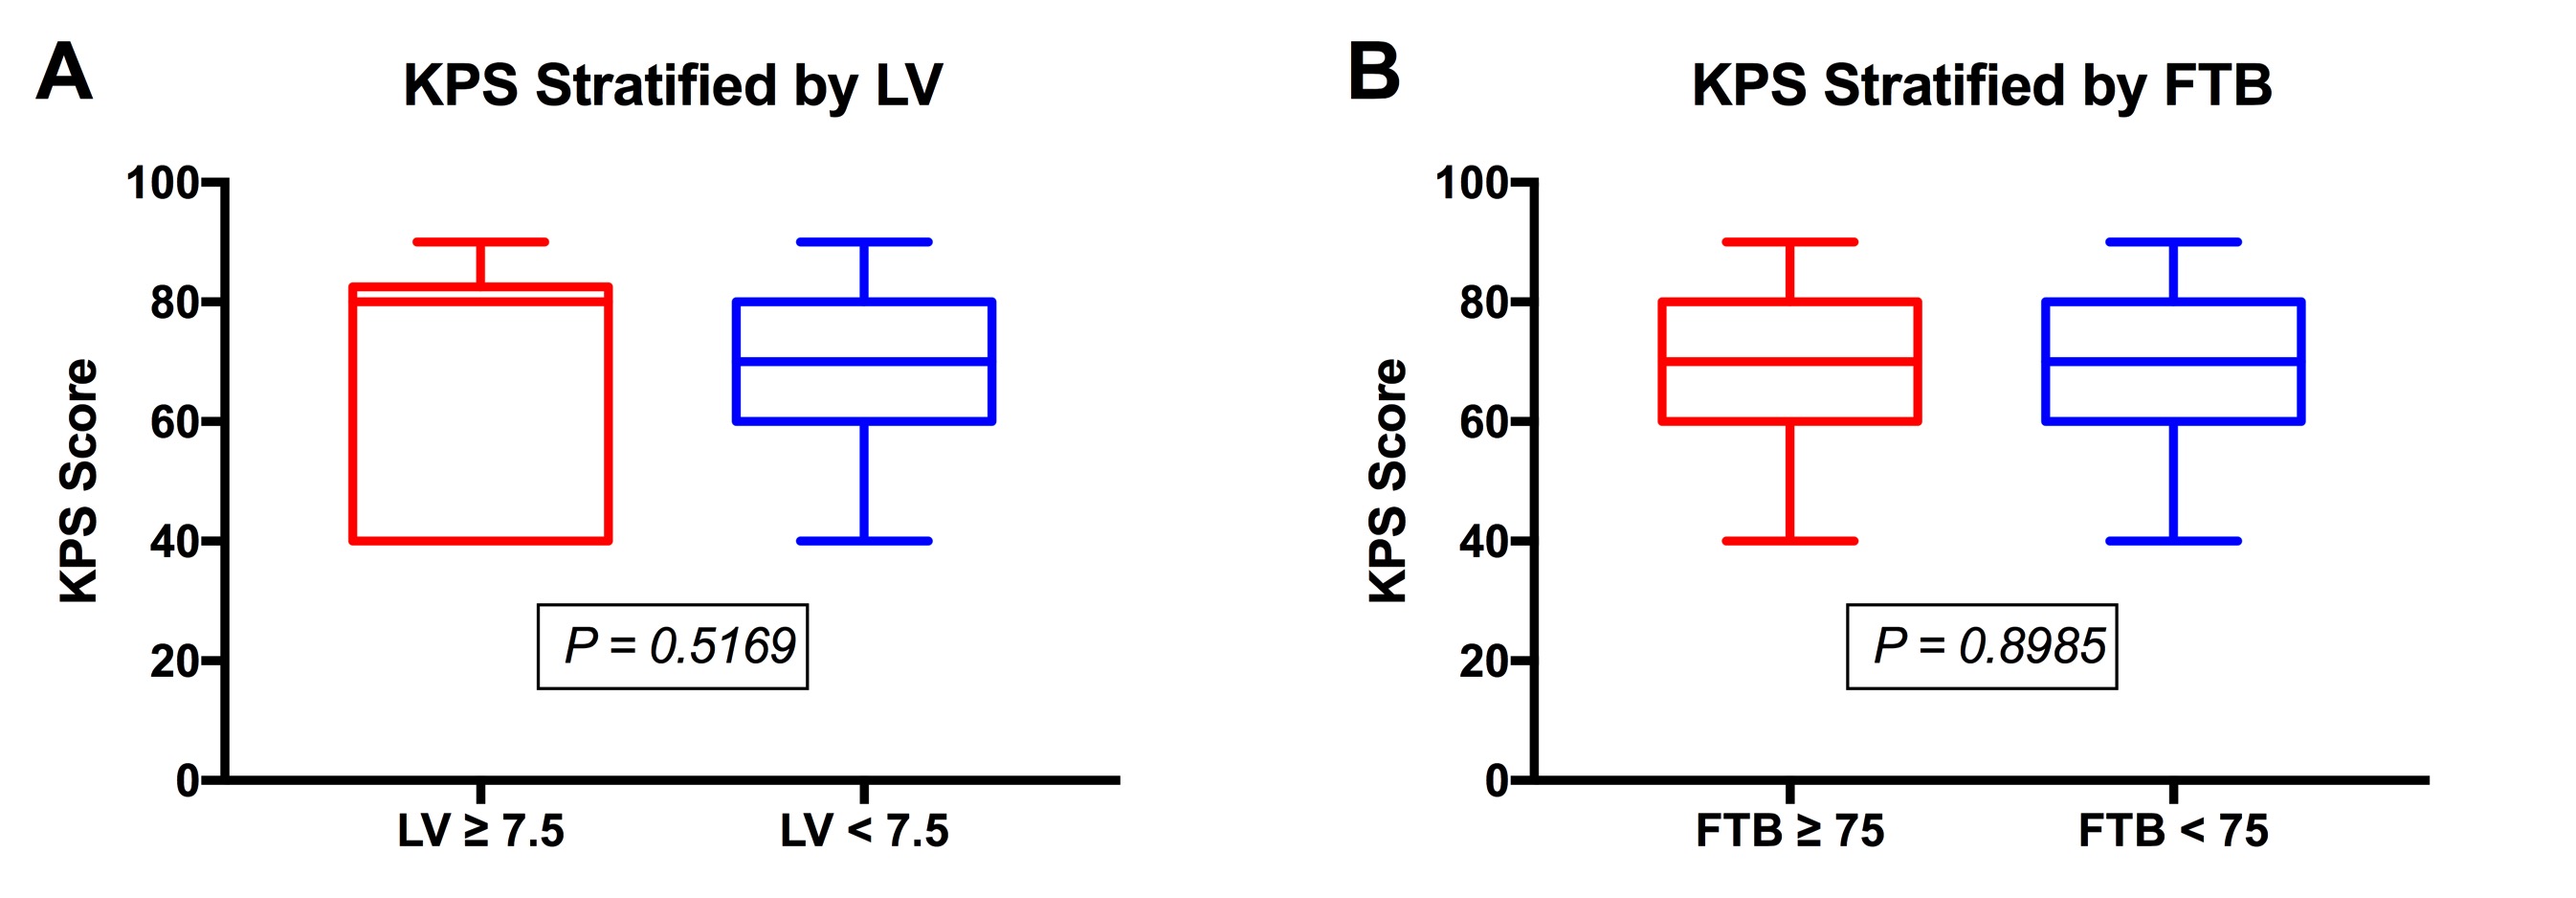
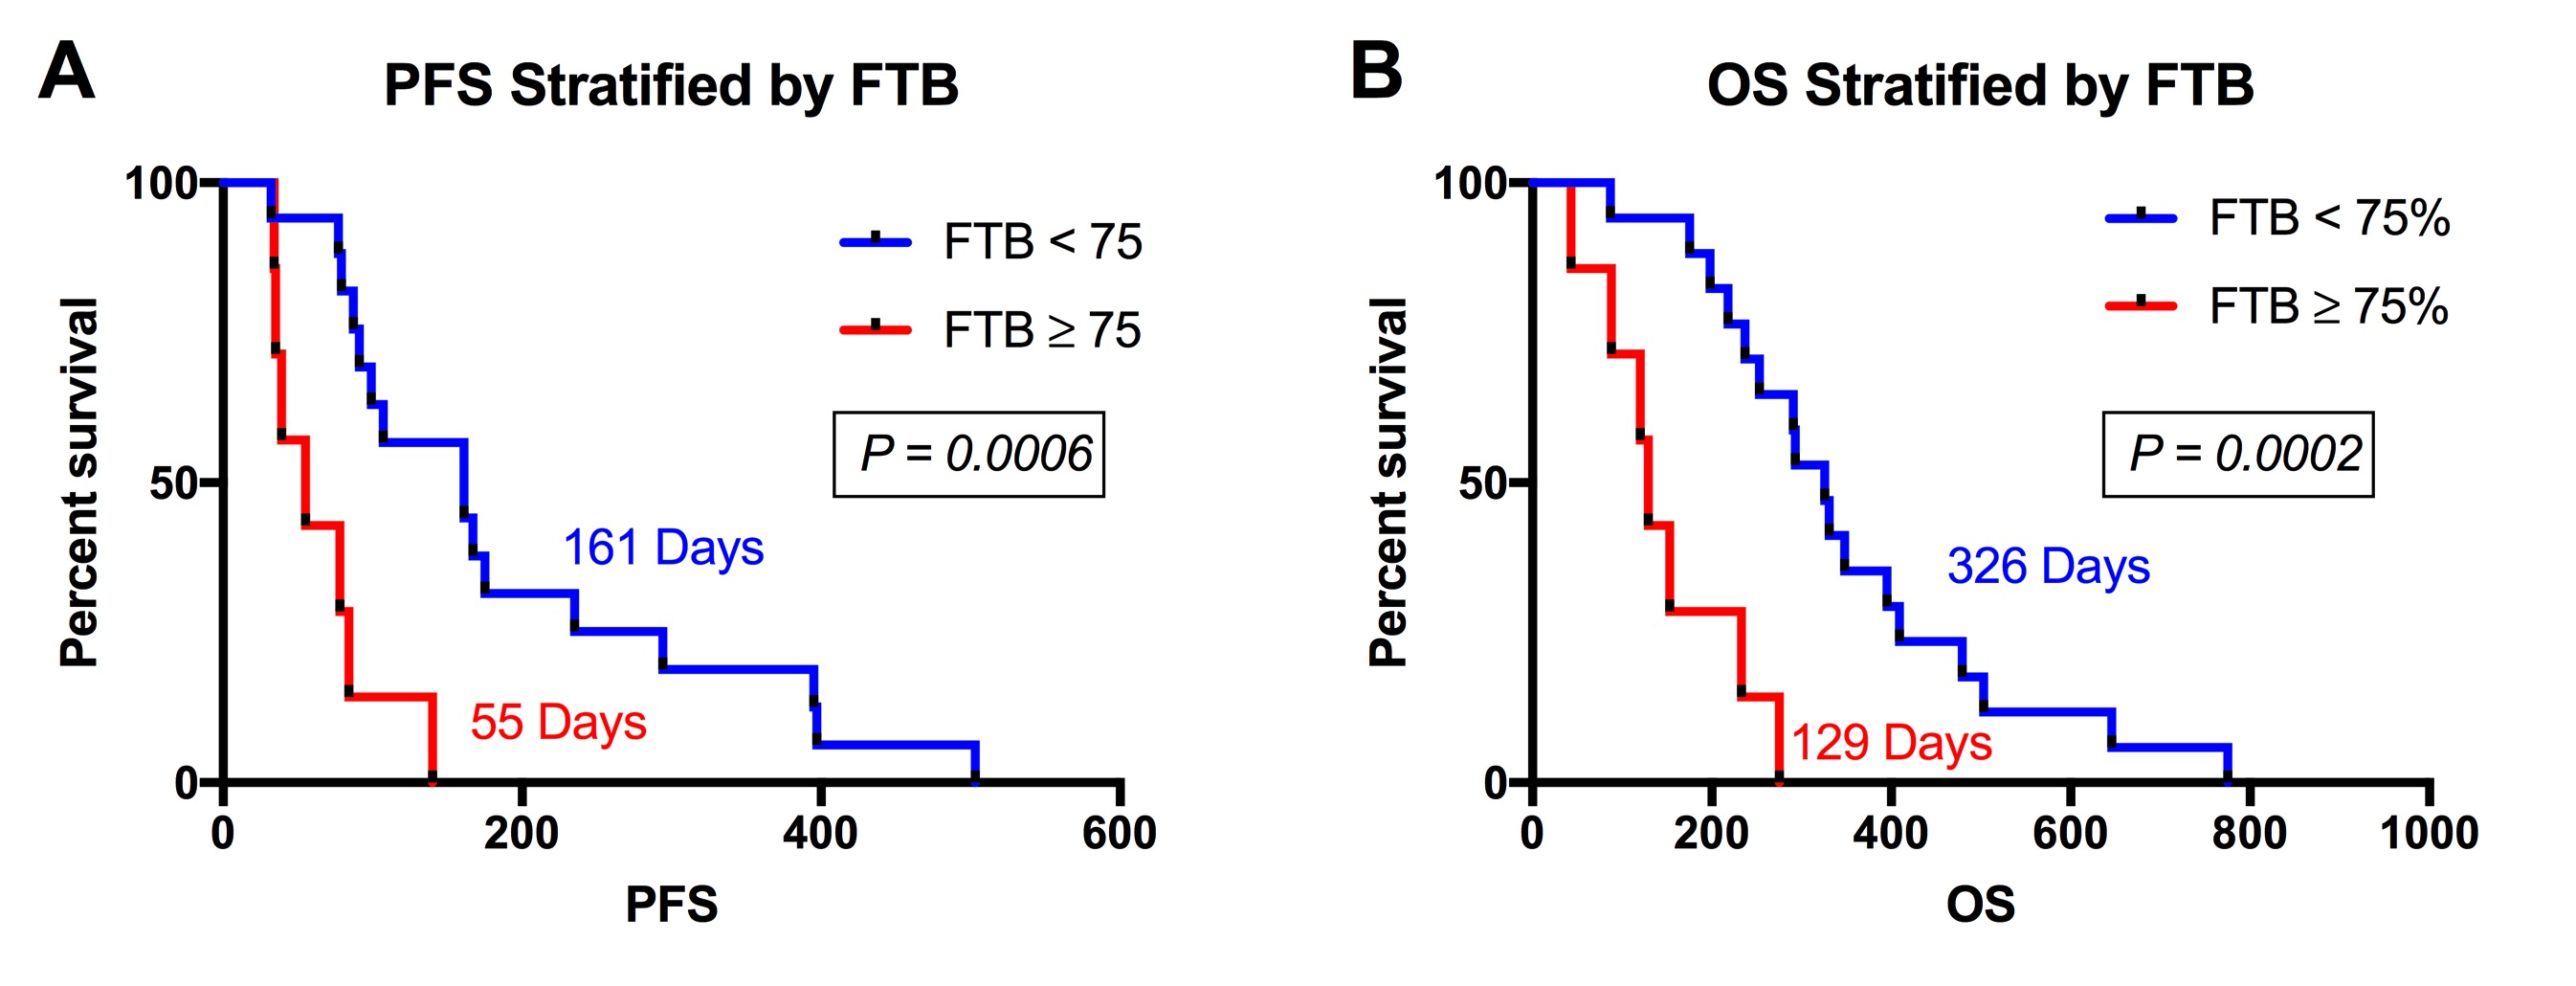
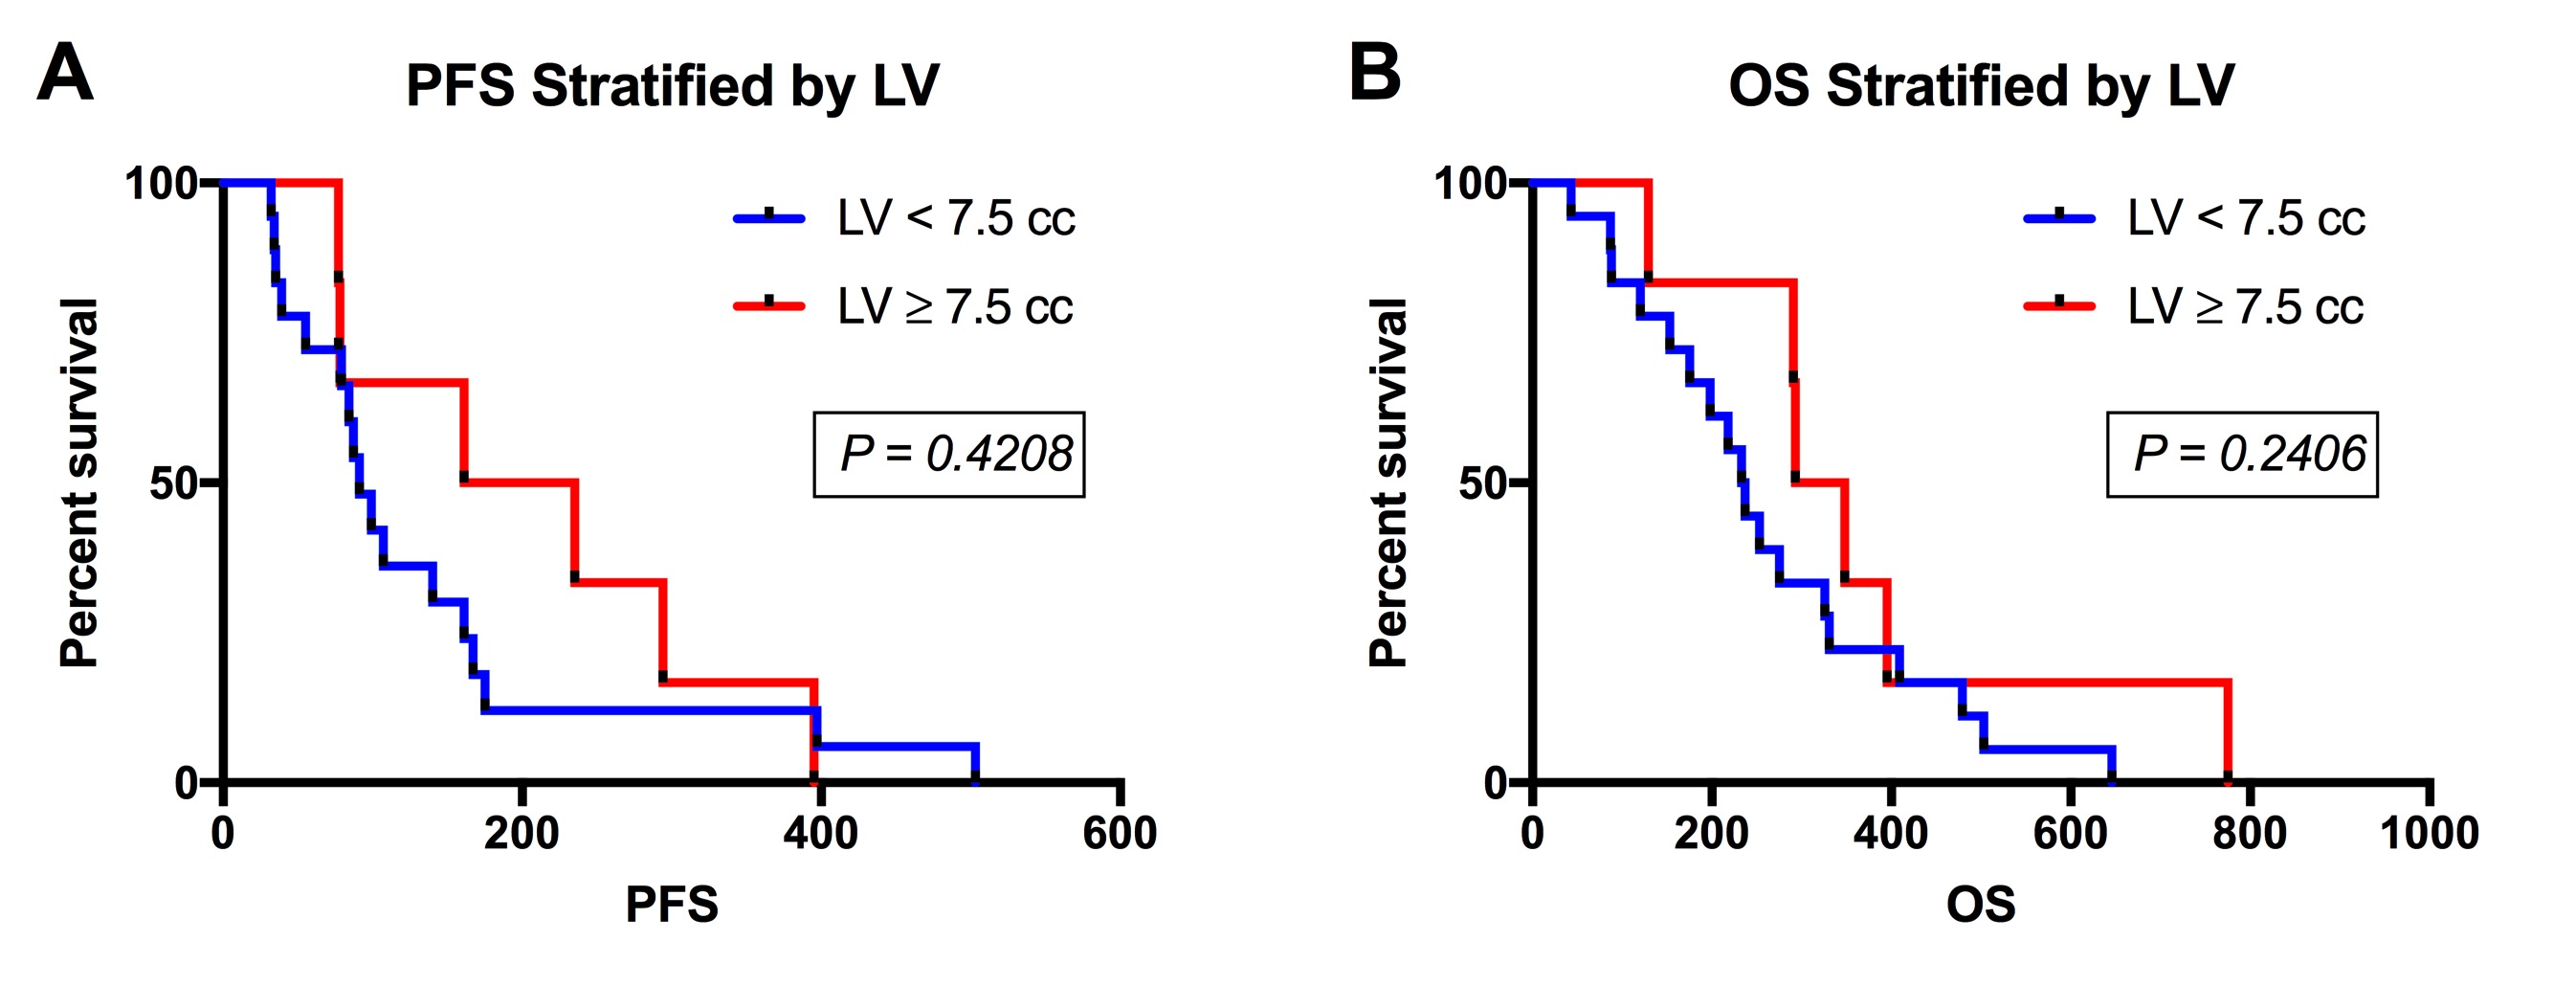
Written, informed consent was obtained from all participants for this HIPAA-compliant, IRB-approved study. Participants were retrospectively identified (from 2007-2011) and included those that received BEV for their rGBM, underwent dynamic susceptibility contrast GRE-EPI (DSC: TE/TR=30ms/1.1sec, 0.05-0.1mmol/kg preload, 0.05-0.1mmol/kg dose during data collection) in addition to FLAIR (TE/TR=151ms/10sec), and pre- and post-contrast T1w imaging (T1/T1+C; TE/TR=20ms/450ms). All imaging was performed 20-60 days following BEV initiation. Imaging data was excluded if the enhancing lesion was <1cc. Standardized7 and leakage-corrected8 rCBV maps (sRCBV) were created from DSC using IB Neuro™ (Imaging Biometrics, Elm Grove, WI). T1, T1+C, and sRCBV were rigidly co-registered with FLAIR.9 LV was determined using the delta T1 method where, after standardization, T1 images are subtracted from T1+C images.10 Within the enhancing LV, FTB maps were created using the previously-identified sRCBV threshold of 3575.6 OS and PFS survival were calculated from the date of BEV initiation. PFS was determined based on progression of FLAIR and T1+C as determined by an experienced neuroradiologist using all available follow-up exams. If no progression was observed, date of death was used if death occurred within 2 months of last non-progressive MRI. PFS and OS were compared using the Kaplan-Meier method and stratified for FTB by an empirically chosen threshold of 75% and for LV using the published threshold of 7.5cc.2 Clinically documented Karnofsky Performance Status (KPS) scores at the time of BEV initiation were compared for both FTB and LV stratification using Mann-Whitney t-test. Significance was set at P<0.05 and statistical analyses were performed using Prism (GraphPad Software, La Jolla, CA).Results
A total of 24 participants met the inclusion criteria. Previous treatment included biopsy or resection, followed by irradiation with or without chemotherapy. Average age of the 13 male and 11 female participants was 51 (range=30-68) years. MRI was acquired an average of 36 (range=20-56) days following BEV initiation. Example parameter maps are displayed in Figure 1. All participants had expired at the time of analysis and all but 1, who was lost to follow-up and therefore censored, had a progressive event. Average KPS was 68 (range=40-90) at the time BEV was initiated. In Figure 2, KPS was not significantly different between the low and high LV (P=0.5169) or FTB (P=0.8985) groups. Survival results are shown in Figures 3 and 4. FTB less than 75% could statistically distinguish long from short survivors for both PFS (161 vs. 55 days; P=0.0006) and OS (326 vs. 129 days; P=0.0002). LV less than 7.5cc was not predictive of either PFS (P=0.2813) or OS (P=0.4159). Unexpectedly, although not significant, those with higher LV tended to have longer survival. This may suggest that those with smaller LV were more prone to pseudo-response in this study, providing further evidence for the potential value of FTB.Discussion and Conclusion
These results demonstrate that there is a potential role for FTB to characterize response to BEV in patients with rGBM. Patients with an FTB of less than 75% survived longer and progressed later, whereas a LV less than 7.5cc did not indicate any survival benefit. Interestingly, the two patients with the longest PFS (553 days) and OS (775 days) were among those with the lowest FTB at 29% and 22%, respectively. FTB may provide clinicians a spatially quantifiable means to more timely and accurate assessment of BEV response.Acknowledgements
NIH/NCI R01 CA082500, NIH/NCI U01 176110, Advancing a Healthier WisconsinReferences
1. Hygino da Cruz LC, Jr., Rodriguez I, Domingues RC, Gasparetto EL, Sorensen AG. Pseudoprogression and pseudoresponse: imaging challenges in the assessment of posttreatment glioma. AJNR Am J Neuroradiol 2011;32(11):1978-1985.
2. Ellingson BM, Kim HJ, Woodworth DC, Pope WB, Cloughesy JN, Harris RJ, Lai A, Nghiemphu PL, Cloughesy TF. Recurrent glioblastoma treated with bevacizumab: contrast-enhanced T1-weighted subtraction maps improve tumor delineation and aid prediction of survival in a multicenter clinical trial. Radiology 2014;271(1):200-210.
3. Schmainda KM, Zhang Z, Prah M, Snyder BS, Gilbert MR, Sorensen AG, Barboriak DP, Boxerman JL. Dynamic susceptibility contrast MRI measures of relative cerebral blood volume as a prognostic marker for overall survival in recurrent glioblastoma: results from the ACRIN 6677/RTOG 0625 multicenter trial. Neuro Oncol 2015;17(8):1148-1156.
4. Schmainda KM, Prah M, Connelly J, Rand SD, Hoffman RG, Mueller W, Malkin MG. Dynamic-susceptibility contrast agent MRI measures of relative cerebral blood volume predict response to bevacizumab in recurrent high-grade glioma. Neuro Oncol 2014;16(6):880-888.
5. Hu LS, Eschbacher JM, Heiserman JE, Dueck AC, Shapiro WR, Liu S, Karis JP, Smith KA, Coons SW, Nakaji P, Spetzler RF, Feuerstein BG, Debbins J, Baxter LC. Reevaluating the imaging definition of tumor progression: perfusion MRI quantifies recurrent glioblastoma tumor fraction, pseudoprogression, and radiation necrosis to predict survival. Neuro Oncol 2012;14(7):919-930.
6. Prah MA, Al-Gizawiy MM, Mueller WM, Hoffmann RG, Dasgupta M, K.M. S. Comparison of diffusion and perfusion parameters in distinguishing radiation effect and necrosis from GBM. 2015; Toronto, Ontario, Canada. Mira Smart Conferencing.
7. Bedekar D, Jensen T, Schmainda KM. Standardization of relative cerebral blood volume (rCBV) image maps for ease of both inter- and intrapatient comparisons. Magn Reson Med 2010;64(3):907-913.
8. Boxerman JL, Prah DE, Paulson ES, Machan JT, Bedekar D, Schmainda KM. The Role of preload and leakage correction in gadolinium-based cerebral blood volume estimation determined by comparison with MION as a criterion standard. AJNR Am J Neuroradiol 2012;33(6):1081-1087.
9. Jenkinson M, Beckmann CF, Behrens TE, Woolrich MW, Smith SM. Fsl. Neuroimage 2012;62(2):782-790.
10. Bedekar D, Jensen T, Rand SD, Malkin MG, Connelly J, Schmainda KM. Delta T1 Method: An Automatic Post-Contrast ROI Selection Technique for Brain Tumors. 2010 May 1 - 7; Stockholm, Sweden. Curran Associates, Inc. p 2844.
Figures