0707
MRI-perfusion derived fractional tumor burden (FTB) is predictive of overall and progression free survival in newly diagnosed glioblastoma following concomitant chemoradiotherapy1Radiology, Medical College of Wisconsin, Milwaukee, WI, United States, 2Neurology, Medical College of Wisconsin, Milwaukee, WI, United States, 3Biophysics, Medical College of Wisconsin, Milwaukee, WI, United States
Synopsis
The phenomenon of pseudoprogression (PsP) on standard imaging can make response assessment difficult in patients with glioblastoma who have undergone standard chemoradiation treatment (CRT). PsP mimics tumor progression on standard imaging, yet is thought to represent a positive biological response to treatment. Recent efforts to define rCBV thresholds to distinguish tumor from treatment effect has enabled the creation of fractional tumor burden (FTB) maps. FTB maps quantify the percent of tumor within an enhancing lesion. This study shows that, within 4-months post-CRT, FTB is a better indicator of PFS and OS than median rCBV or methylation status alone.
Purpose
The standard of care for the treatment of newly diagnosed glioblastoma (GBM) includes resection followed by irradiation with concomitant (CRT) and adjuvant chemotherapy. In the first few months following CRT, upwards of 20% of patients will show increasing enhancement on T1+C images that will later subside.1,2 This imaging finding, termed pseudoprogression (PsP), is thought to indicate a positive biological response to therapy, yet is difficult to distinguish from tumor progression. Interpretation is further challenged, as clinical symptoms are often similar.1 It has been increasingly accepted that perfusion parameters such as relative cerebral blood volume (rCBV) are more accurate predictors of response in the approximate 4-month time frame typical for PsP, than standard imaging alone.2 Recently, utilizing spatially correlated tissue samples of proven histology, a rCBV threshold was determined to distinguish treatment effects (TE) from GBM.3 Application of this threshold allows for the creation of fractional tumor burden (FTB) maps, enabling spatial and quantifiable (percent of lesion that is GBM) assessment of GBM response.3,4 Therefore, the aim of this analysis was to determine if FTB might prove useful as a surrogate biomarker of overall (OS) and progression-free (PFS) survival following CRT treatment in patients with newly diagnosed and primary GBM.Methods
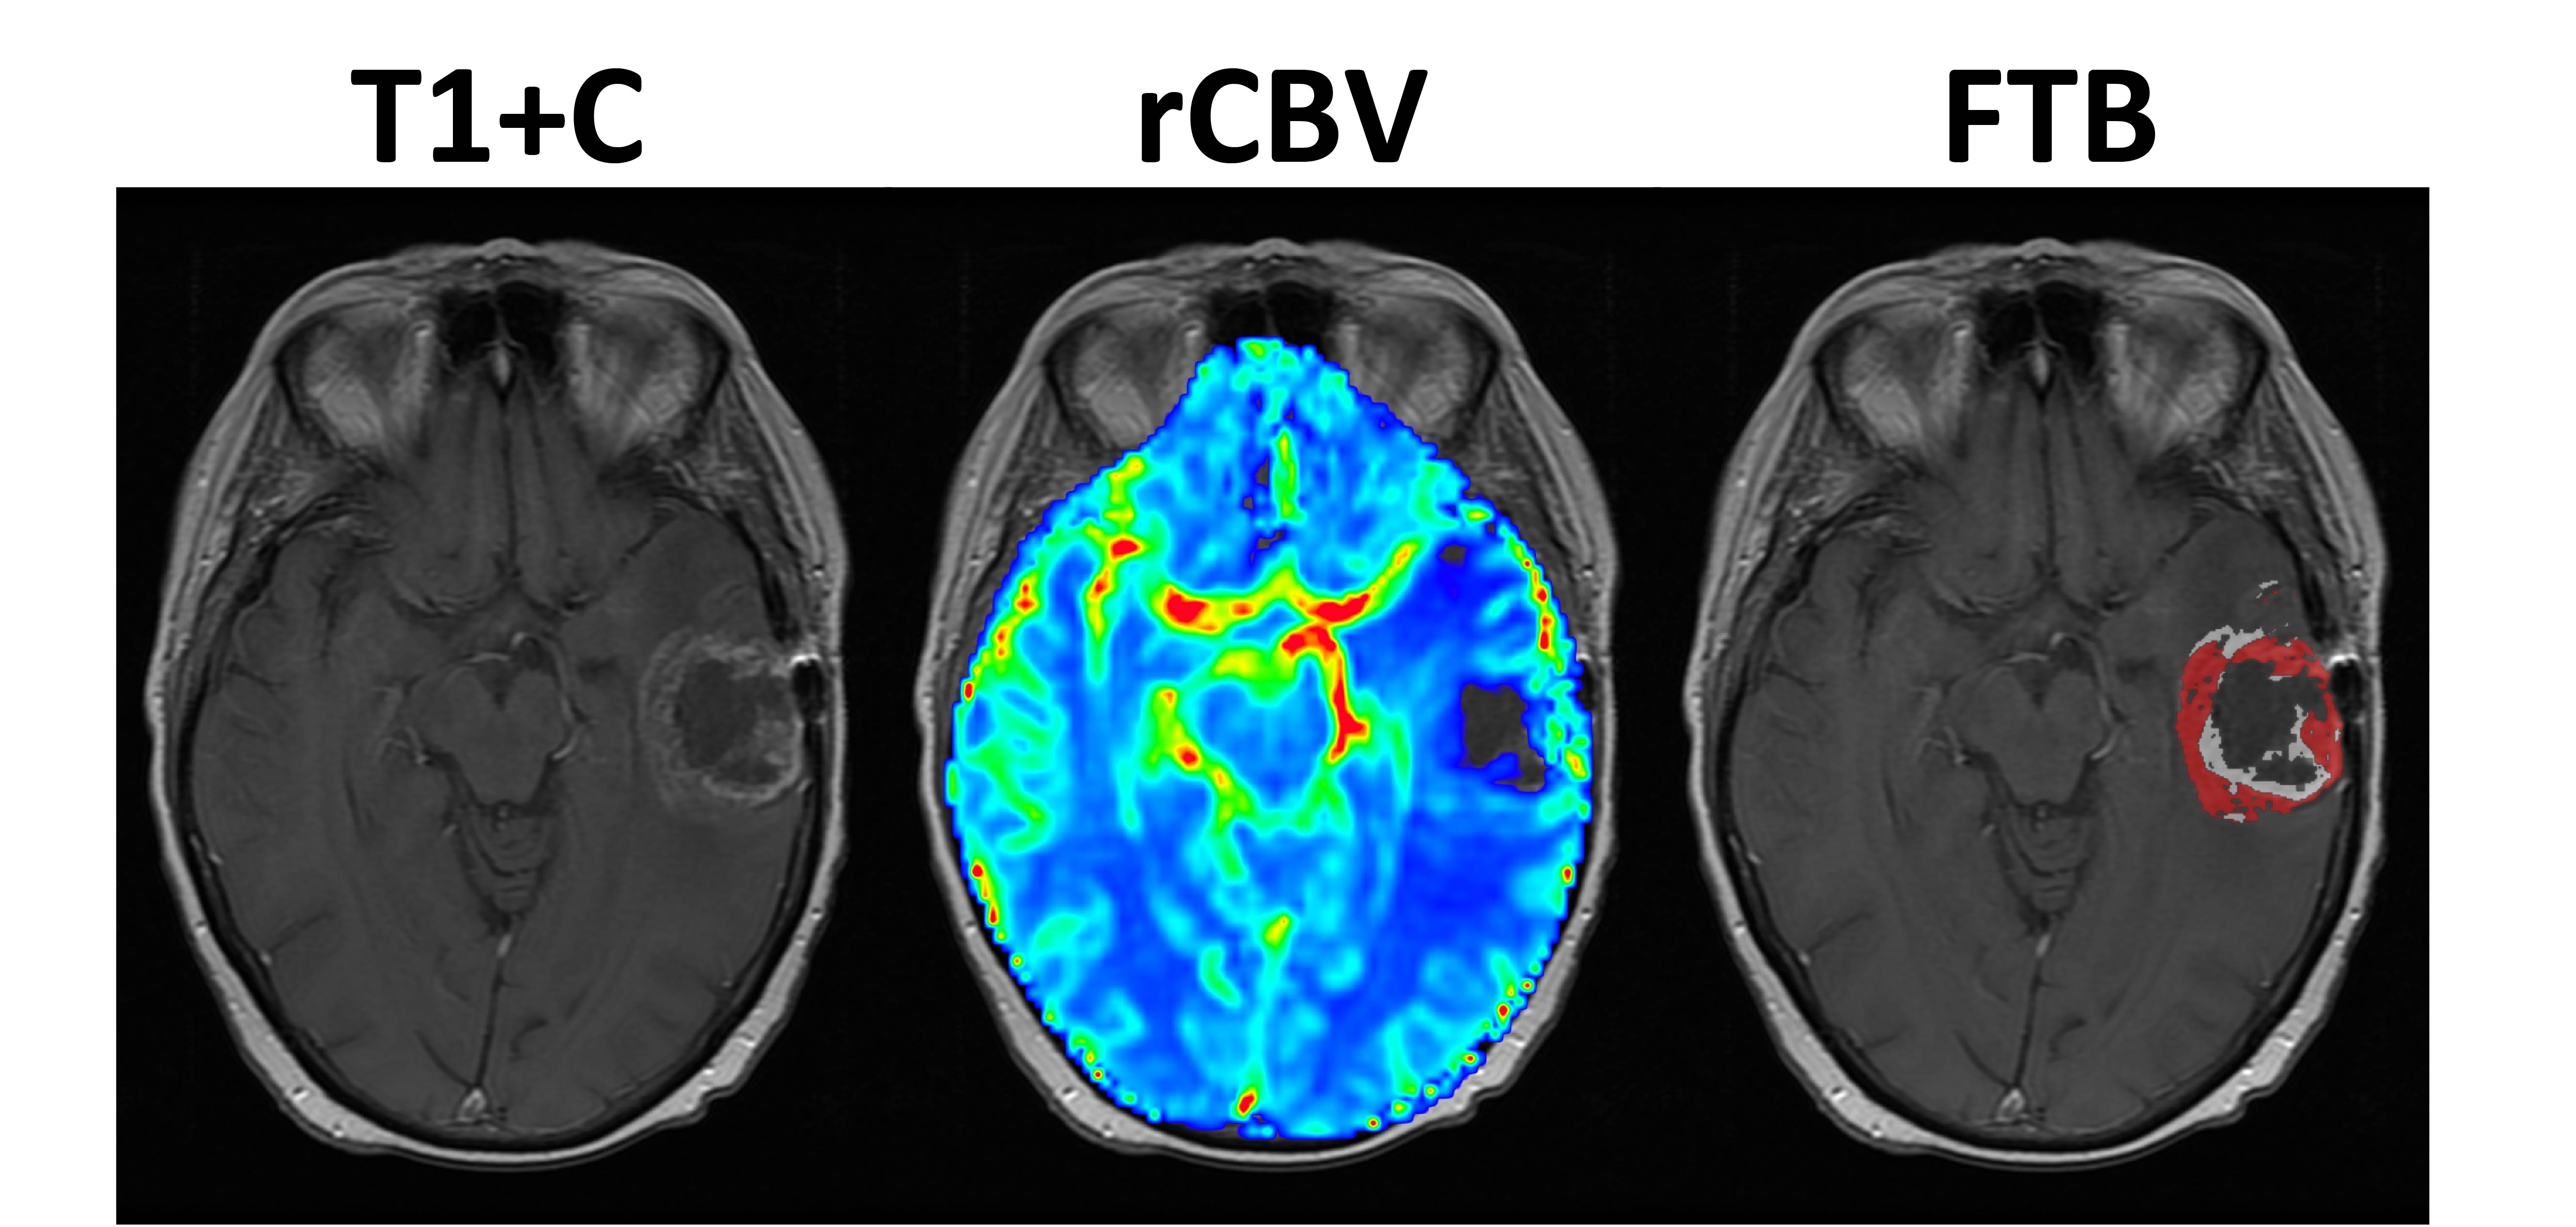
All participants provided written, informed consent according to IRB policy in this HIPAA-compliant study. Participants with a resected primary newly-diagnosed GBM that received CRT followed by adjuvant temozolomide were retrospectively identified between 2007-2014 and considered for inclusion if a DSC-MRI study was performed using GRE-EPI (TE=31ms, TR=1.48sec, 0.05-0.1 mmol/kg preload, 0.05-0.1mmol/kg dose during data collection) and the acquisition was within 4 months of CRT completion. Subjects were excluded from analysis if their enhancing lesion was <1cc or if image quality was poor. Leakage-corrected and normalized (to normal-appearing white matter) rCBV maps were created and subsequently registered to T1+C.5 All post-processing was performed using FDA-cleared software (Imaging Biometrics, Elm Grove, WI). FTB and mean rCBV were then calculated within the enhancing lesion volume using AFNI.6 FTB maps were generated using the previously determined nRCBV threshold of 1.13, which spatially differentiates TE from GBM.3 PFS and OS were calculated using the Kaplan-Meier method and stratified separately by FTB, mean rCBV, and when available, GBM methylation status.7 For rCBV, curves were compared in groups separated by the median, and for FTB comparisons were made with an empirically chosen threshold of 75%. PFS and OS were calculated from date of surgical diagnosis. All statistical analyses were performed using Prism 7 (GraphPad Software, La Jolla, CA).Results
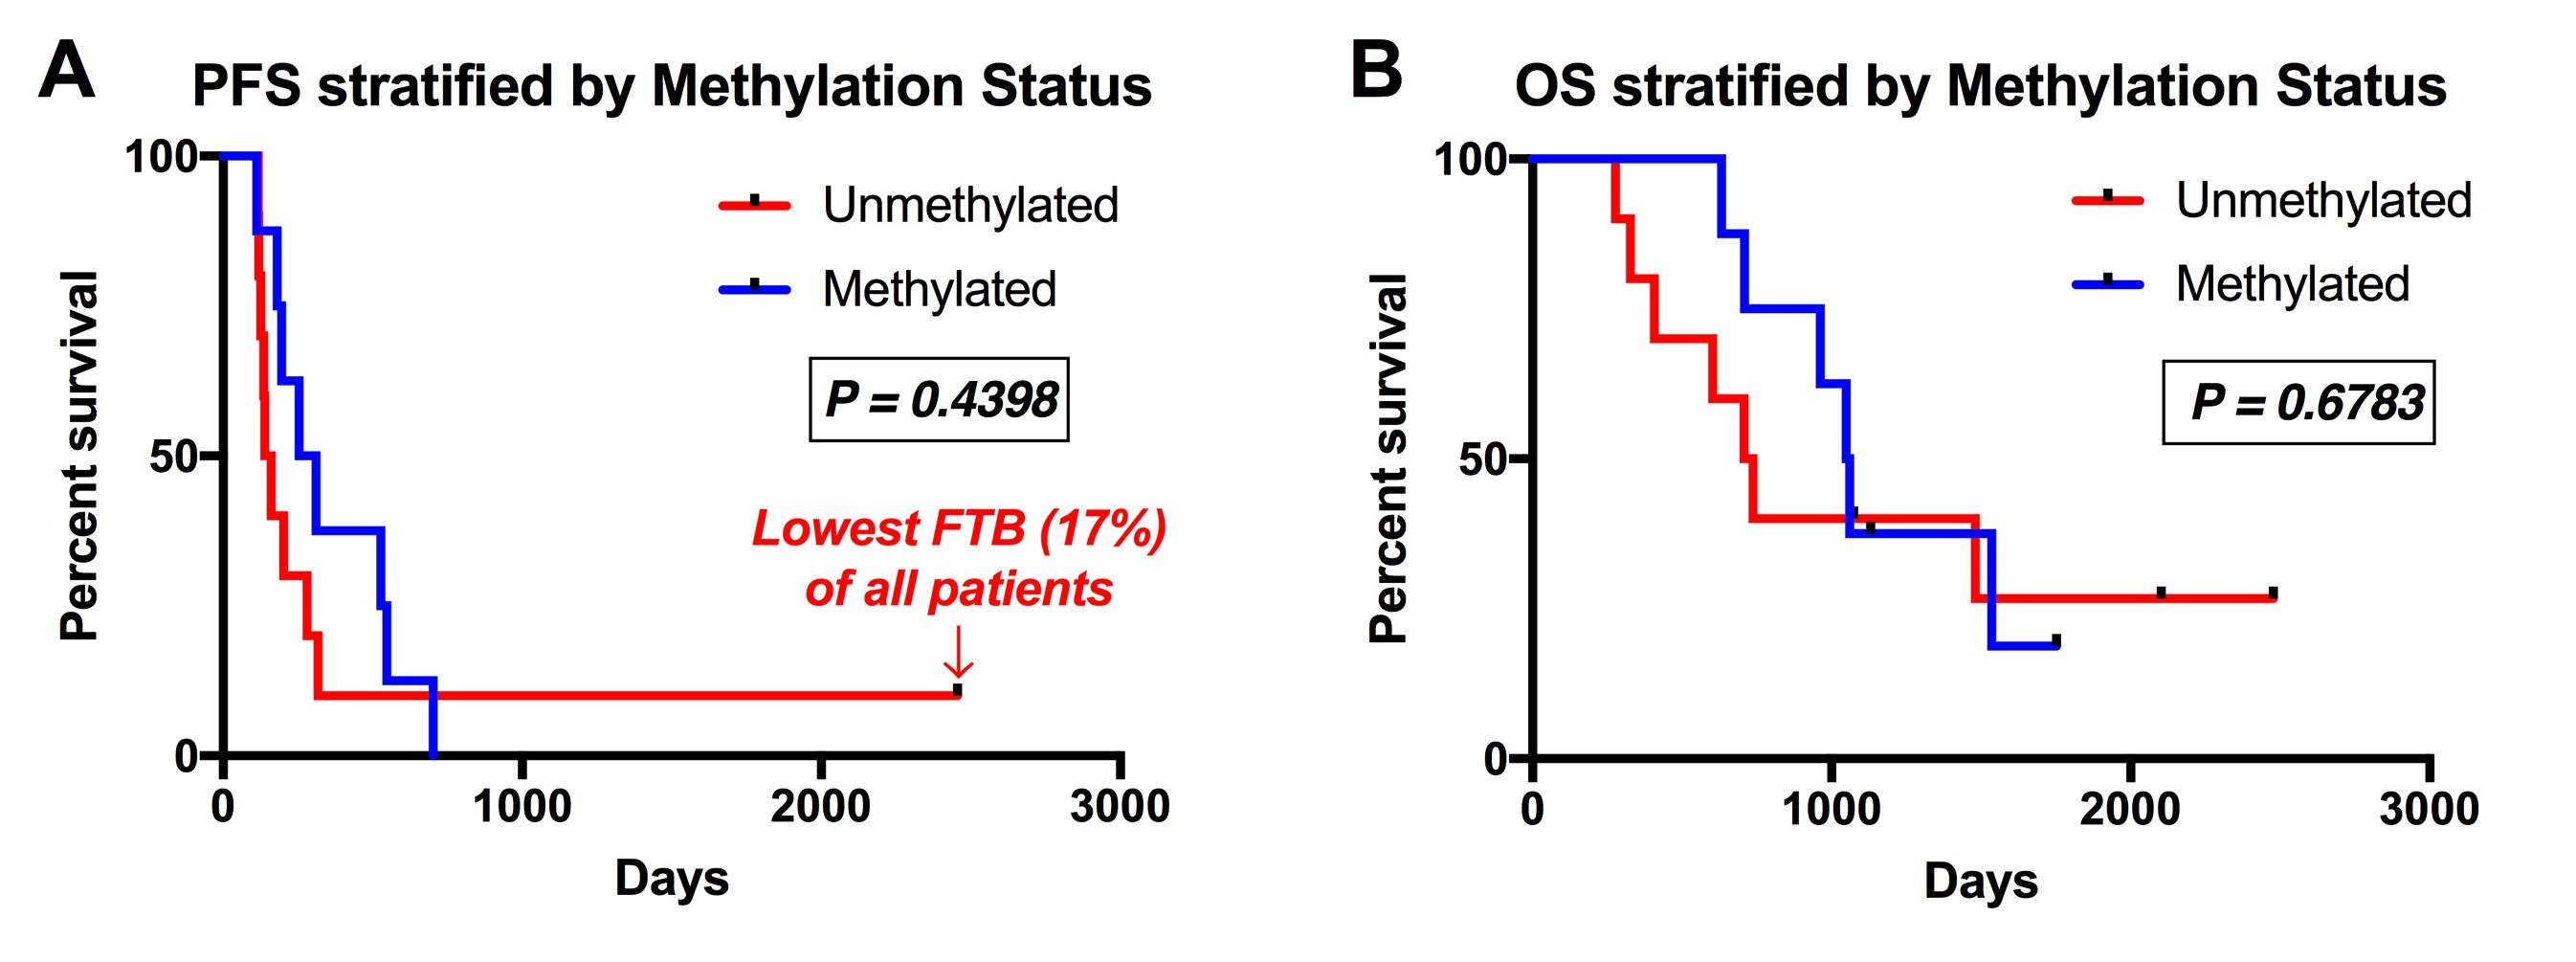
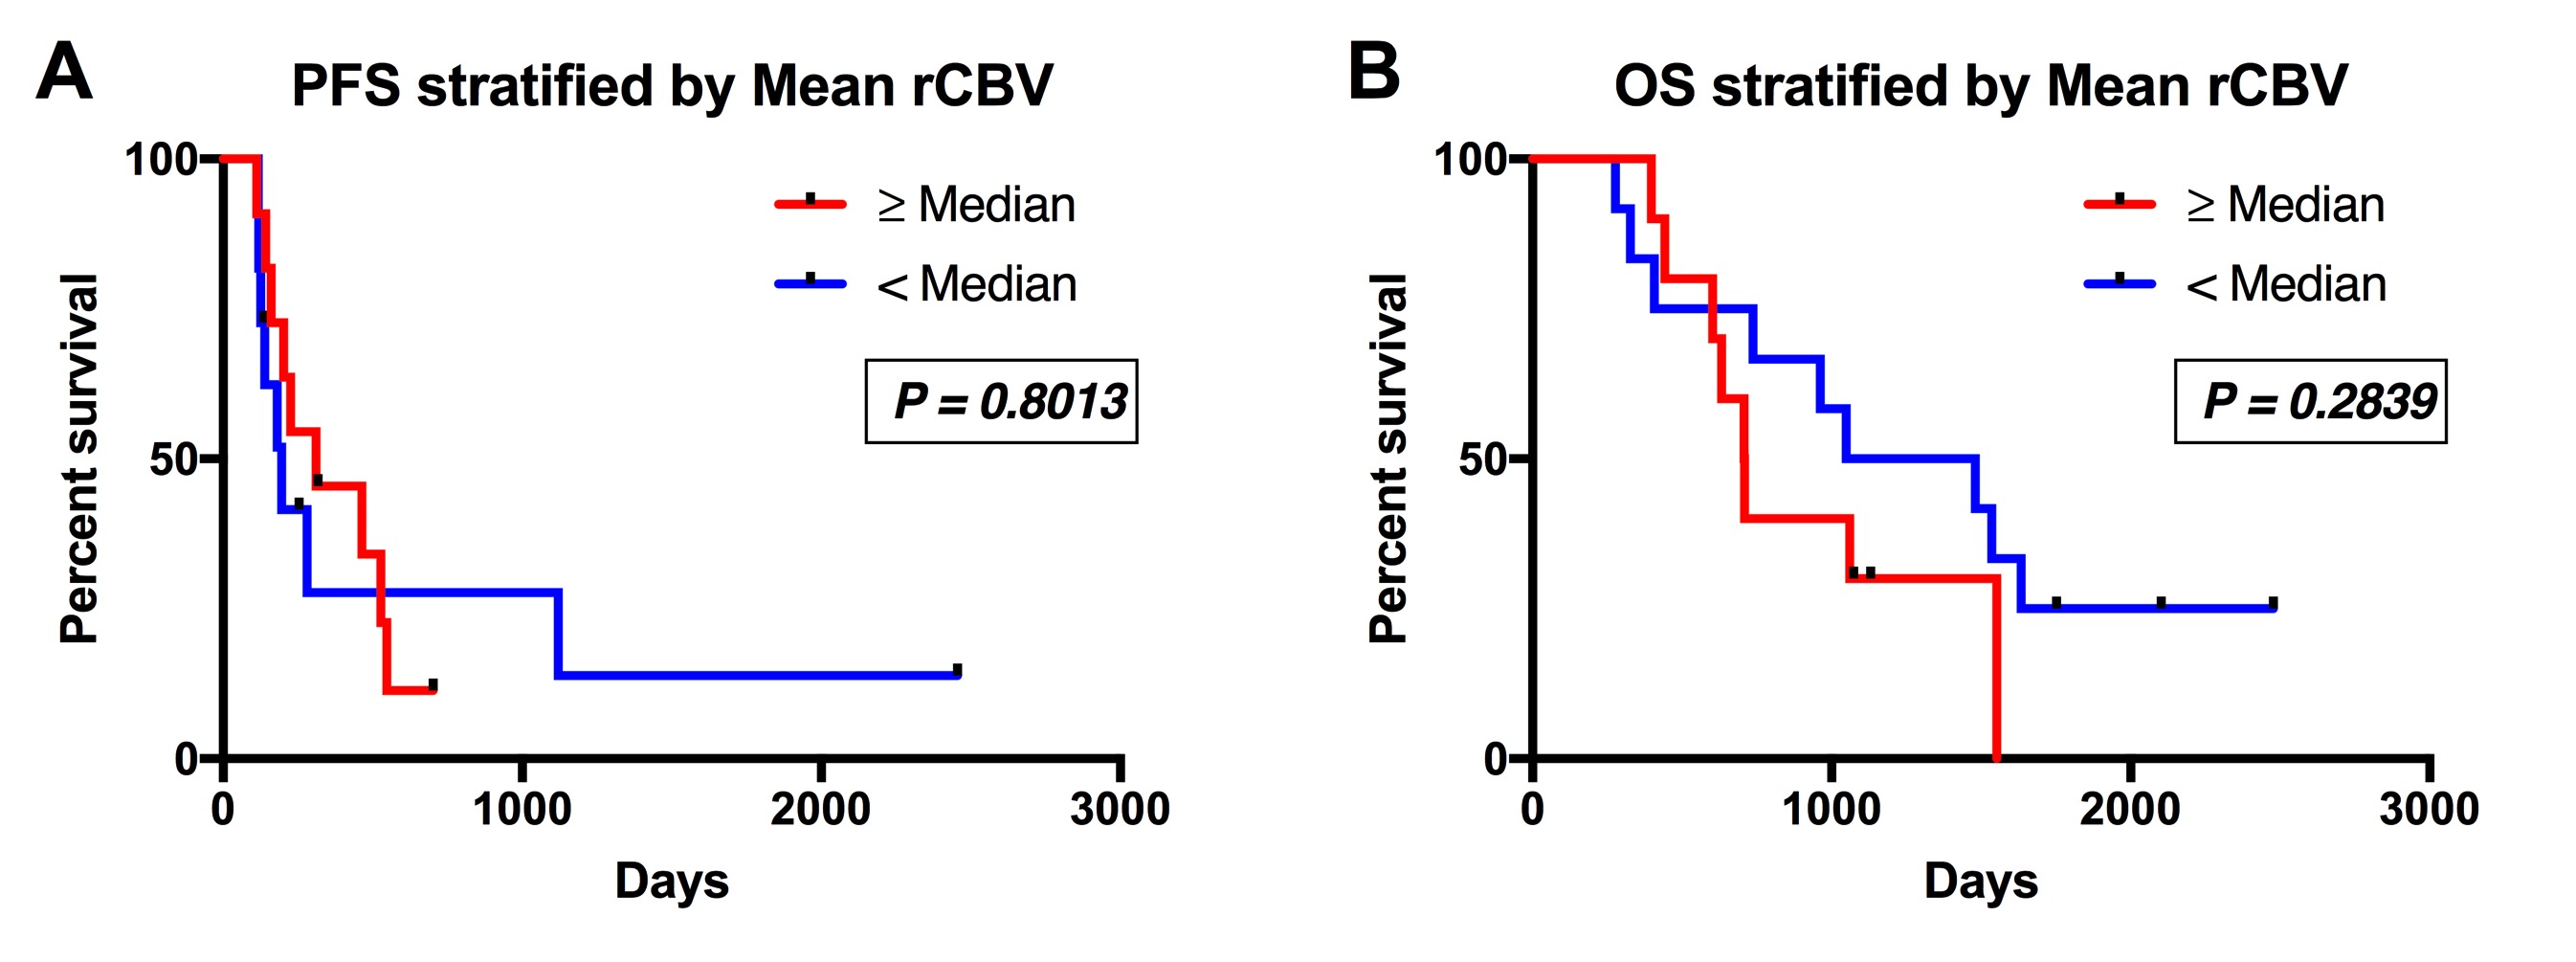
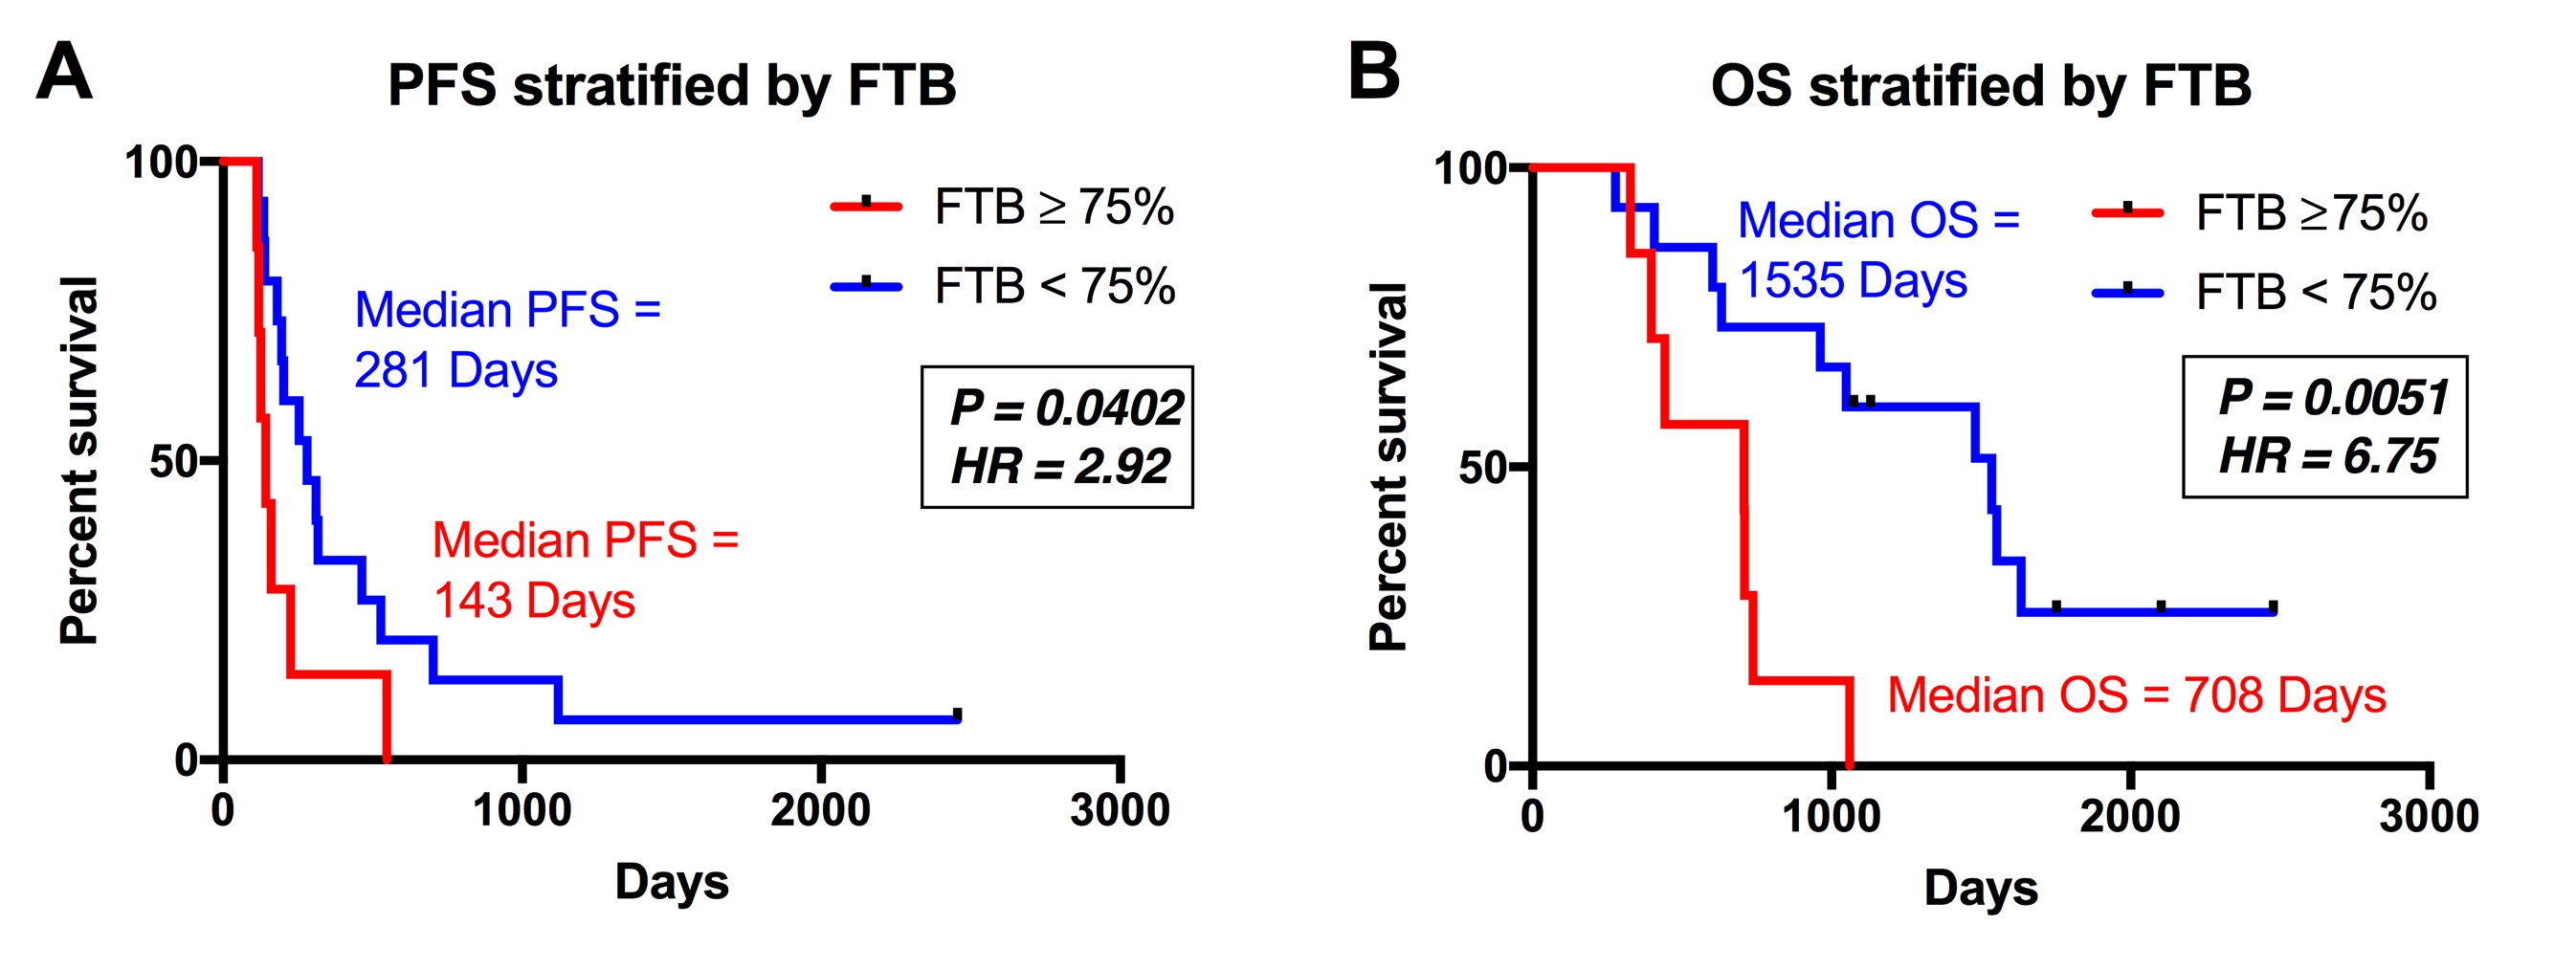
There were 30 participants that met inclusion criteria for this analysis, with 8 excluded for incomplete anatomic MRI coverage (n=1), <1cc enhancement (n=6), or inadequate contrast agent injection (n=1). For the remaining 22 participants, DSC imaging was acquired at a median of 32 (range=27-97) days following CRT. Median age at GBM diagnosis was 58yrs (range=23-71) with 11 male (52yrs) and 11 female (61yrs) participants. All patients completed CRT a median of 77 (range=62-93) days following surgical resection. Example imaging, including rCBV and FTB maps are displayed (Figure 1). PFS (P=0.4398) and OS (P=0.6783) were not significantly different between methylated (n=8) and unmethylated (n=10) GBM (Figure 2). Likewise, PFS (P=0.8013) and OS (P=0.2839) were not significantly different for mean rCBV (Figure 3). However, for FTB less than 75% a statistically longer PFS (281 vs. 143 days; P=0.0402, HR=2.92) and OS (1535 vs. 708 days; P=0.0051, HR=6.75) was observed (Figure 4).Discussion
These results demonstrate that FTB may be a valuable biomarker in the assessment of treatment response during the 4-month timeframe following CRT. As assessed by FTB, when the residual enhancing lesion was comprised of less than 75% GBM, a patient lived longer and progressed later. As expected, the subject with the lowest FTB (17%) had the longest PFS and OS of all participants analyzed. Interestingly, this subject also had a GBM that was unmethylated, which typically represents worse prognosis due to decreased responsiveness to temozolomide.7 In these same patients, survival differences were not seen based on methylation status or mean rCBV.Conclusion
Accurate and timely assessment of treatment response following CRT is vital. FTB clearly shows promise as a surrogate biomarker for both PFS and OS in patients that were treated within 4 months of CRT. Application of FTB may provide clinicians with greater confidence in imaging assessment of response, allowing for more timely treatment management decisions.Acknowledgements
NIH/NCI R01 CA082500, NIH/NCI U01 176110, Advancing a Healthier WisconsinReferences
1. Parvez K, Parvez A, Zadeh G. The diagnosis and treatment of pseudoprogression, radiation necrosis and brain tumor recurrence. Int J Mol Sci 2014;15(7):11832-11846.
2. Patel P, Baradaran H, Delgado D, Askin G, Christos P, Tsiouris AJ, Gupta A. MR perfusion-weighted imaging in the evaluation of high-grade gliomas after treatment: a systematic review and meta-analysis. Neuro Oncol 2016.
3. Prah MA, Al-Gizawiy MM, Mueller WM, Hoffmann RG, Dasgupta M, K.M. S. Comparison of diffusion and perfusion parameters in distinguishing radiation effect and necrosis from GBM. 2015; Toronto, Ontario, Canada. Mira Smart Conferencing.
4. Hu LS, Eschbacher JM, Heiserman JE, Dueck AC, Shapiro WR, Liu S, Karis JP, Smith KA, Coons SW, Nakaji P, Spetzler RF, Feuerstein BG, Debbins J, Baxter LC. Reevaluating the imaging definition of tumor progression: perfusion MRI quantifies recurrent glioblastoma tumor fraction, pseudoprogression, and radiation necrosis to predict survival. Neuro Oncol 2012;14(7):919-930.
5. Boxerman JL, Prah DE, Paulson ES, Machan JT, Bedekar D, Schmainda KM. The Role of preload and leakage correction in gadolinium-based cerebral blood volume estimation determined by comparison with MION as a criterion standard. AJNR Am J Neuroradiol 2012;33(6):1081-1087.
6. Cox RW. AFNI: software for analysis and visualization of functional magnetic resonance neuroimages. Comput Biomed Res 1996;29(3):162-173.
7. Li H, Li J, Cheng G, Zhang J, Li X. IDH mutation and MGMT promoter methylation are associated with the pseudoprogression and improved prognosis of glioblastoma multiforme patients who have undergone concurrent and adjuvant temozolomide-based chemoradiotherapy. Clin Neurol Neurosurg 2016;151:31-36.
Figures