0706
Optimization of acquisition and analysis methods for clinical dynamic susceptibility contrast (DSC) MRI using a validated digital reference object1Translational Bioimaging, Barrow Neurological Institute, Phoenix, AZ, United States, 2Diagnostic Imaging, Rhode Island Hospital, Providence, RI, United States, 3imaging research, Barrow Neurological Institute, Phoenix, AZ, United States
Synopsis
Brain tumor DSC-MRI studies can be confounded by T1 and T2* effects that occur when the contrast agent extravasates. Traditionally a combination of contrast agent pre-loading and leakage correction techniques are used to minimize T1 leakage effects, but currently there is no consensus on the most robust dosing scheme. Using a validated DSC-MRI digital reference object we characterize the influence of pre-load dosing schemes, acquisition pulse parameters, and leakage correction methods on CBV accuracy. Our goal is to leverage this computational approach to identify the optimal combination of parameters for brain tumor CBV mapping.
Introduction
DSC-MRI is increasingly used in neurooncology, resulting in several initiatives to standardize acquisition and analysis protocols. A challenge to such efforts is the relative paucity of data systematically evaluating the influence of methodology on CBV accuracy. Uncertainty stems primarily from the phenomenon of contrast agent (CA) extravasation, which confounds reliable measurement of CBV.1,2 DSC-MRI acquisition strategies have been proposed to reduce T1 leakage effects, including preload dosing, low flip angles, and long echo and repetition times. Additionally, post-processing methods have been developed that remove residual T1 and/or T2* leakage effects.2-7 Our goal is to leverage our recently developed DSC-MRI population-based digital reference object (DRO) to help facilitate the rigorous evaluation of DSC-MRI parameters and their impact on CBV accuracy.Methods
To replicate in vivo brain tumor DSC-MRI signals we used a validated computational strategy as the foundation for the DRO. The DRO computes MRI signals for realistic 3D tissue structures modeled using ellipsoids (cells) packed around randomly oriented cylinders (vessels) and accounts for the static magnetic field strength, inter-compartment susceptibility differences, the water proton diffusion coefficient, and pulse sequence parameters. In order to ensure that the DRO’s simulated DSC-MRI signals accurately represent the magnitude and distribution of CA-induced T1 and T2* changes observed across typical glioblastomas, voxel-wise inputs to the simulation toolbox including CBF, CBV, CA transfer coefficient (Ktrans), volume fraction of the EES (ve), and the arterial input function (AIF) were extracted from voxel-wise training data from 23 glioblastoma patients (> 40,000 voxels). Clinical relevance is ensured through matching percent signal recovery (PSR) distribution and the mean and standard deviation of the signals across the DRO with the training data set. Further, the DRO was validated by comparison with a dataset acquired in a separate cohort of patients for pulse sequences and contrast agent dosing schemes different from those in the training dataset. To investigate the influence of acquisition and post-processing methods on the reliability of CBV measurements, we compared tumor CBV simulated with and without (Ktrans = 0) CA leakage effects for four pre-load and bolus injection combinations (no pre-load followed by full dose, a quarter dose followed by three quarter dose, half dose followed by half dose, and a full dose followed by full dose,), three flip angles (30o, 60o, and 90o), three TRs (1s, 1.5s and 2s), two B0 values (1.5T and 3T). Furthermore, we compared the uncorrected CBV estimates with three post-processing leakage correction methods: Boxerman-Schmaida-Weisskoff (BSW)2, Bidirectional (BD)4 and gamma-variate fit (GV)8. Additionally, for the entire parameter space CBV estimates were calculated for three leakage correction upper fit limit values and four CBV integration upper limit values.Results
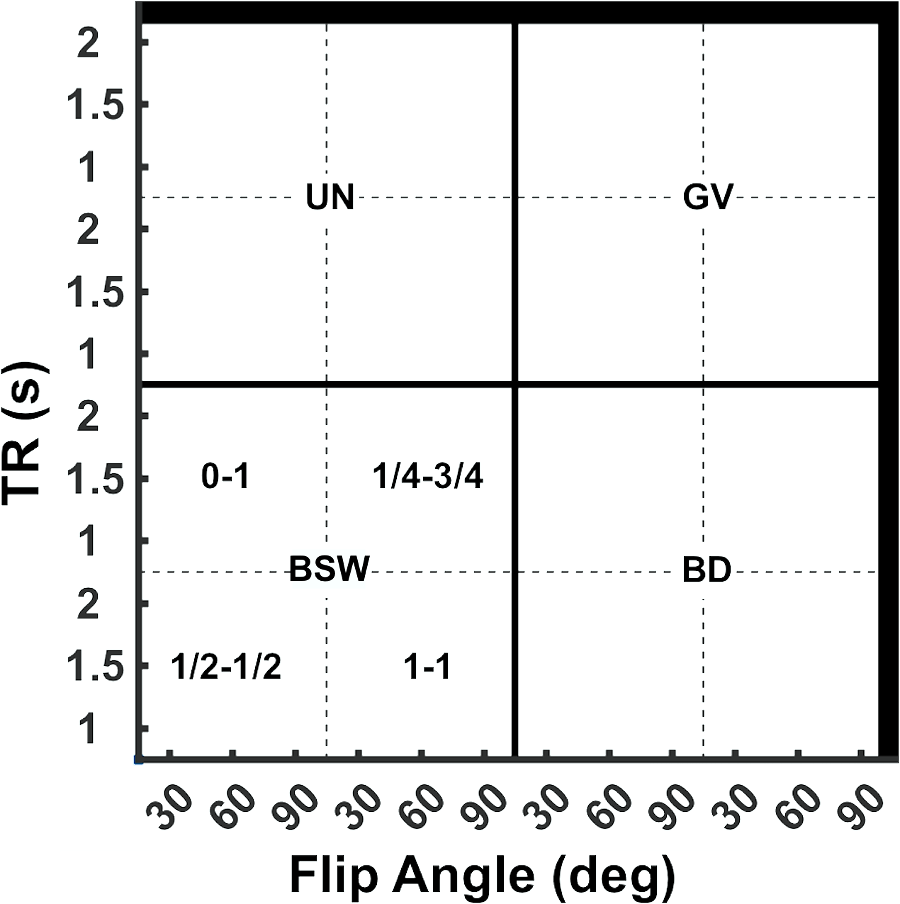
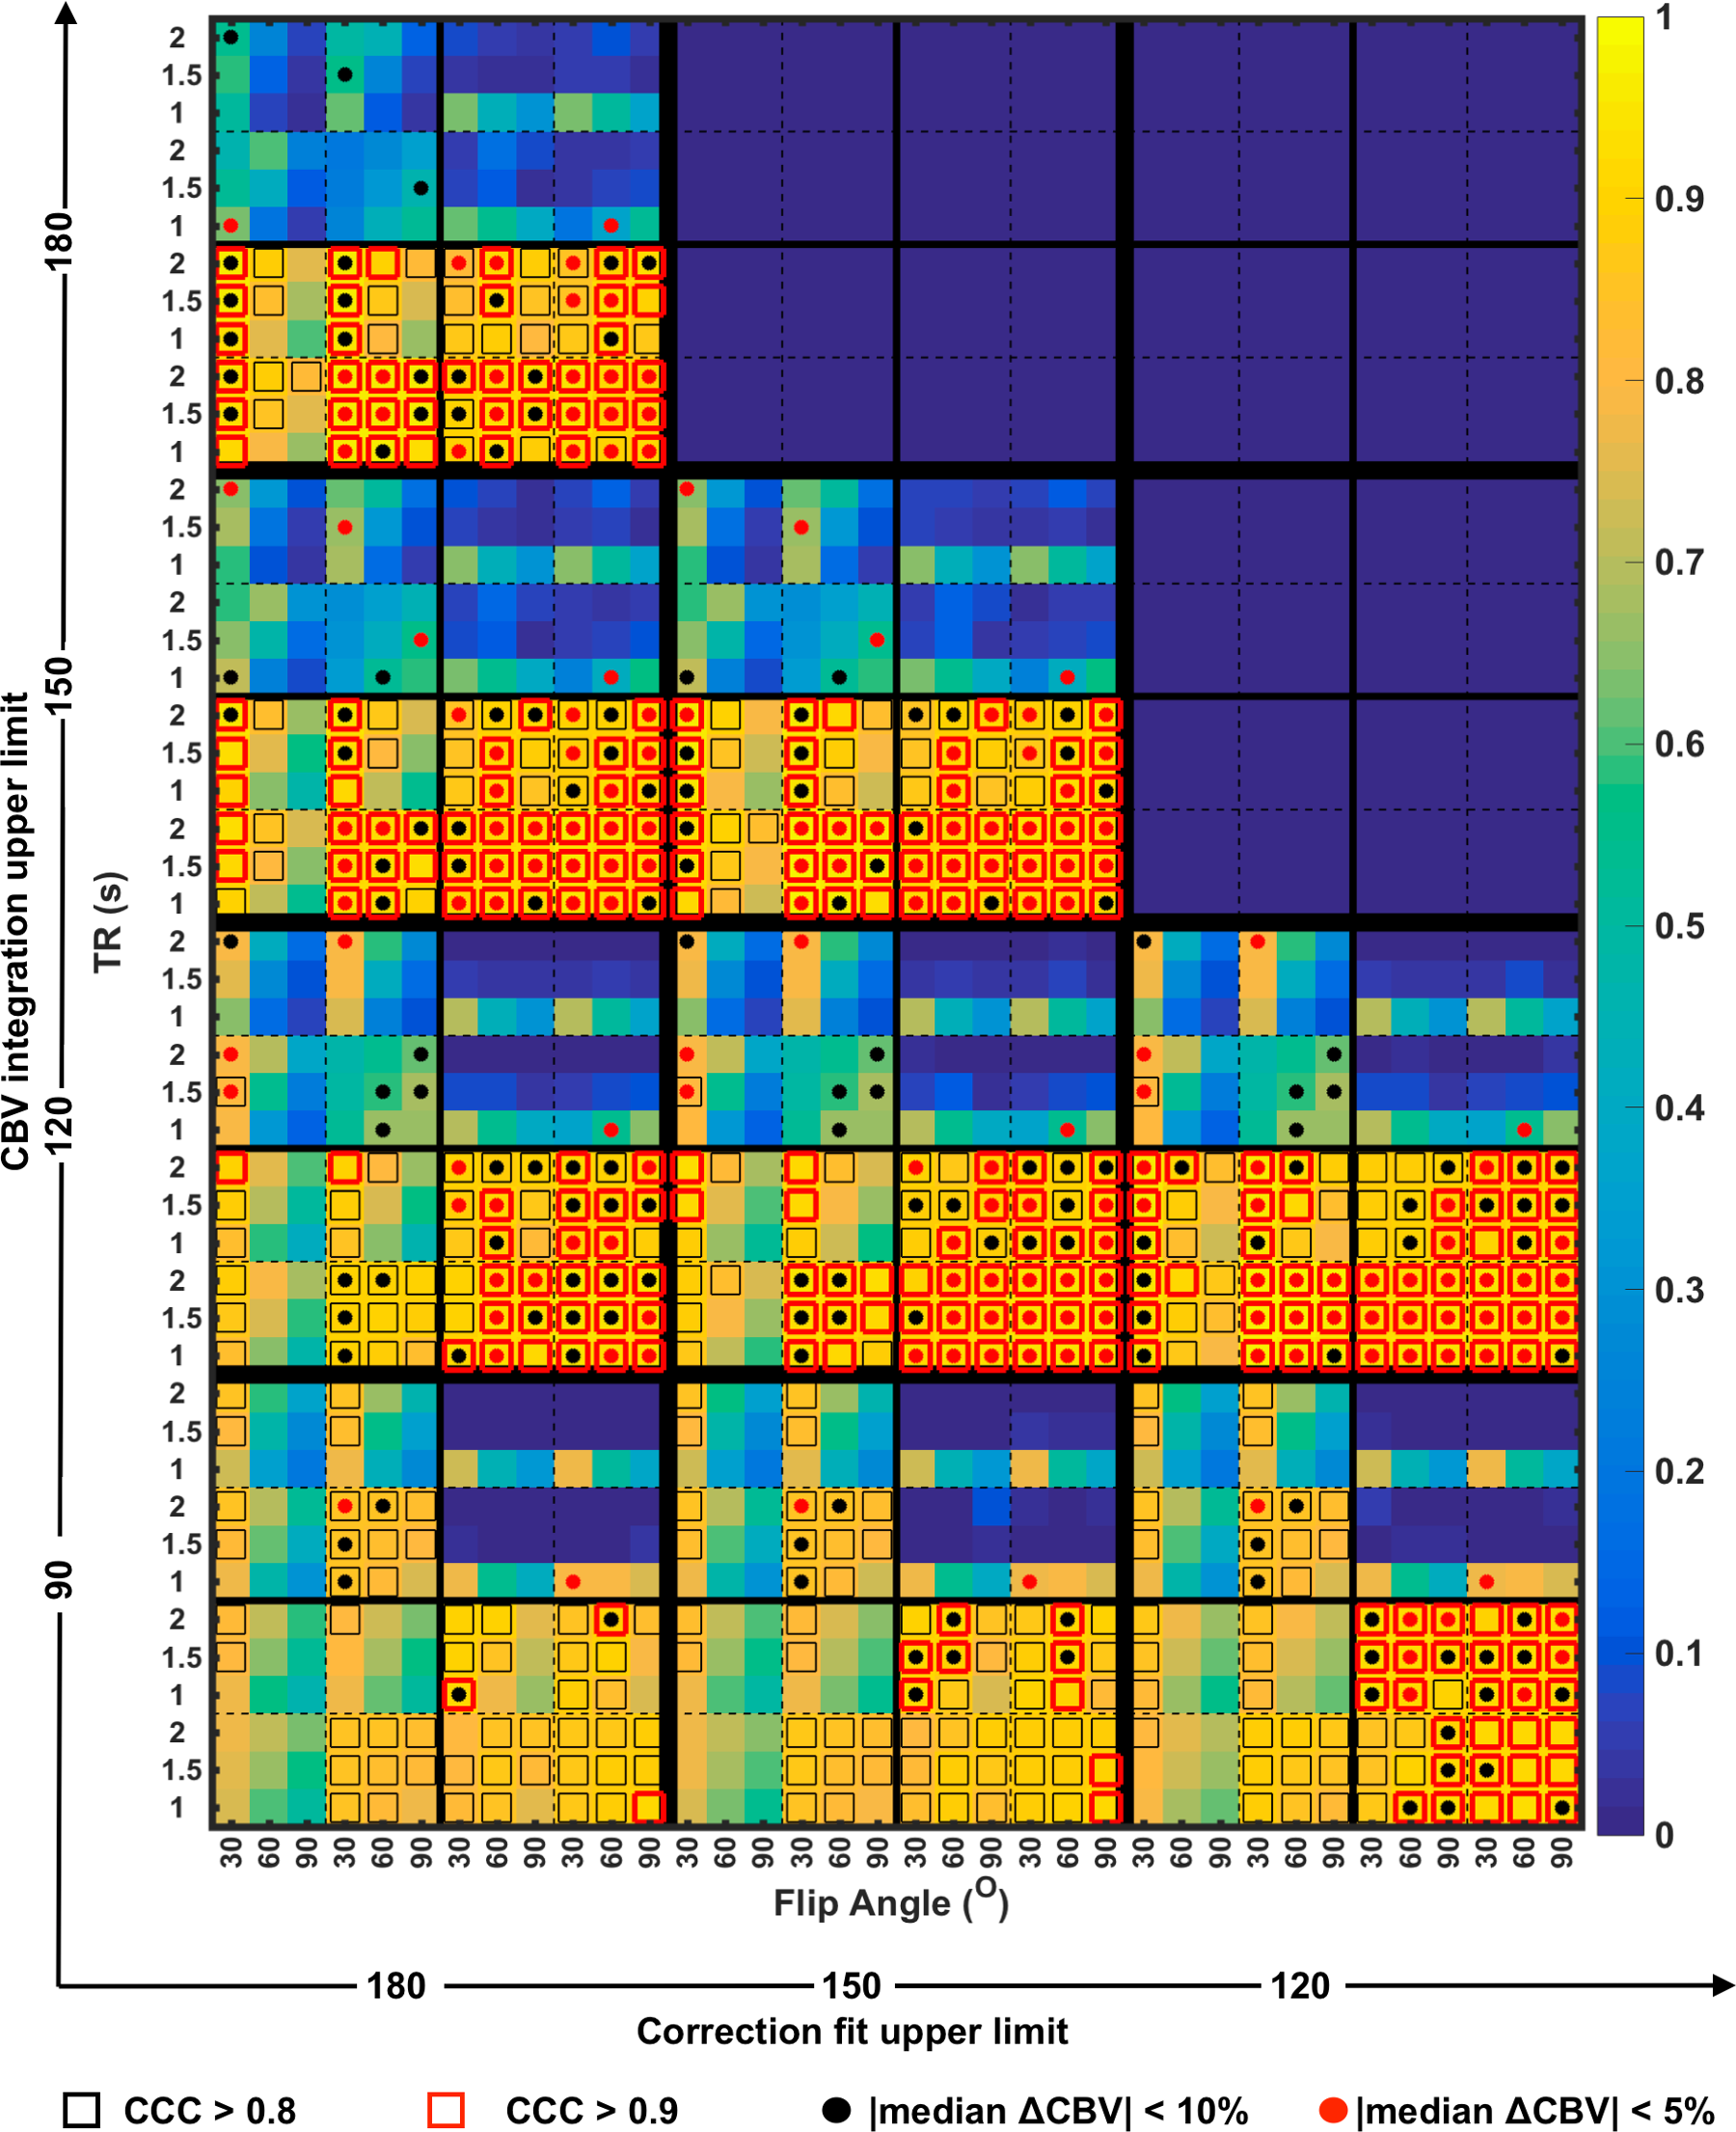
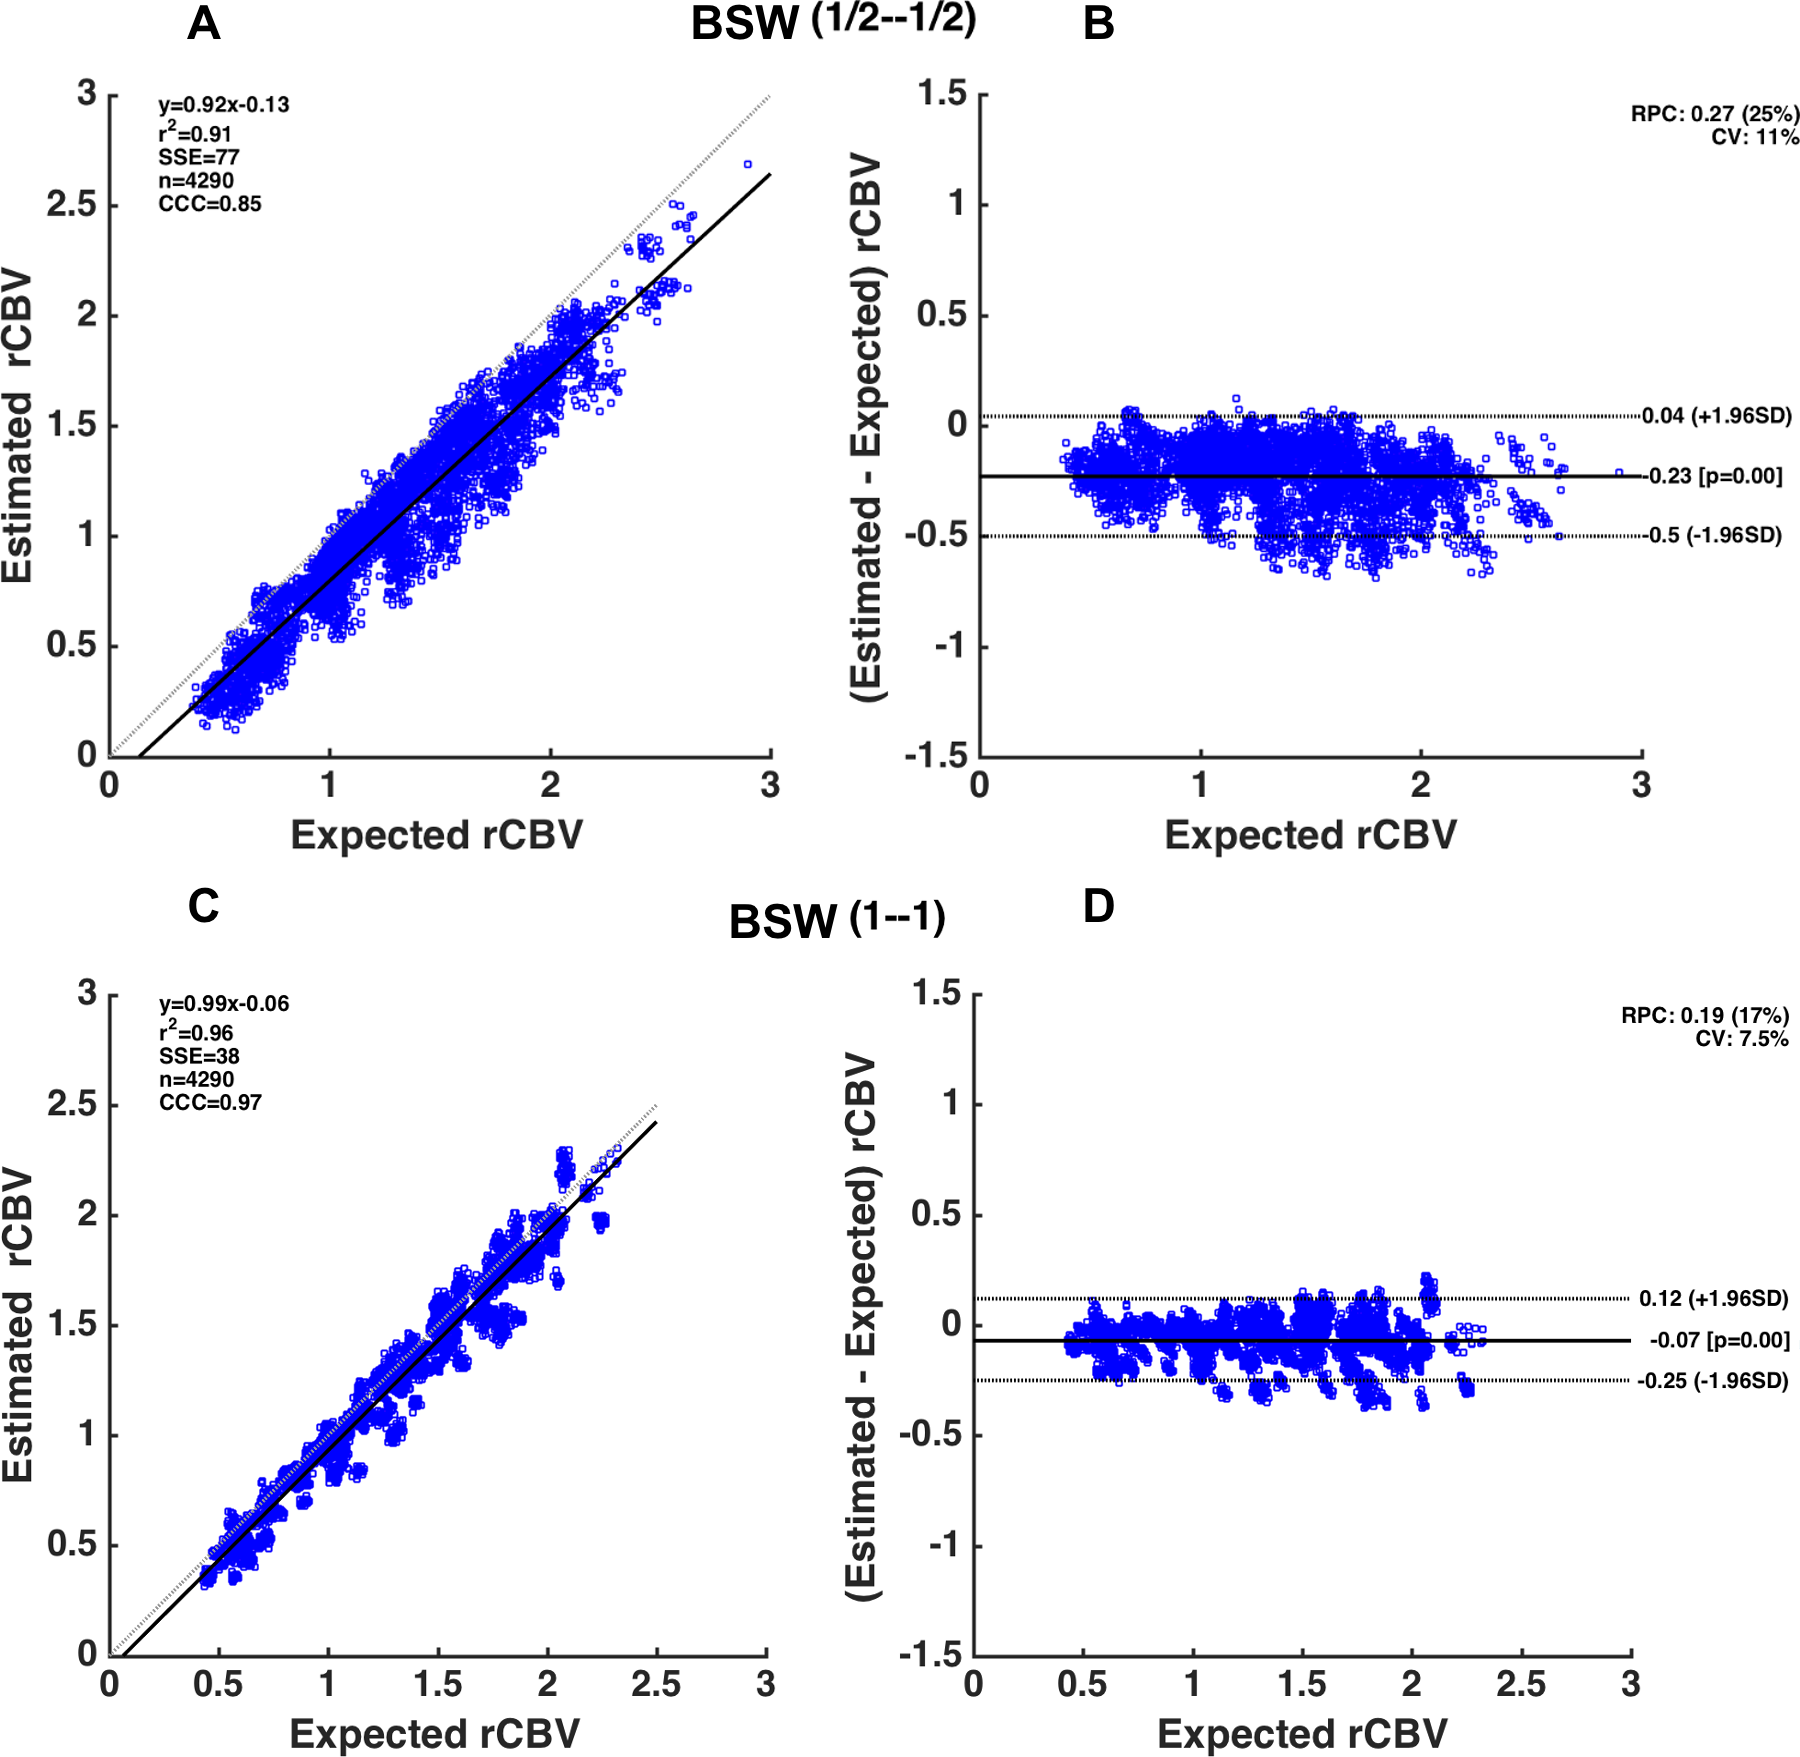
Figure 1 shows the legend for Figure 2 illustrating the spatial location of the aforementioned parameter combinations. Figure 2 shows a heat-map of concordance correlation coefficient (CCC) and median percentage difference, between expected and estimated CBV values computed for each parameter combination at Bo=3T. The uncorrected and GV corrected approach yield poor correlation and wide median percentage error as compared to the BSW and BD correction methods. At both field strengths, the most robust acquisition and post-processing strategies, specifically those with significant correlation (CCC > 0.8) and median percentage difference within 10% across the parameter array, are those acquired using TR=1.5s, 60o flip angle, either half-half or full-full preload scheme, and BSW or BD correction. For these parameters, Bland Altman plots were used to further assess the agreement and precision (Figure 3). While both preload options yielded comparable CCC values, the full-full combination had lower bias agreement and coefficients of variation (CV). For each preload scheme, the CV was lower at 3T and with BSW correction as compared to 1.5T and BD correction.Discussion/Conclusion
Pulse sequence parameters, CA leakage correction techniques, and preload schemes impact CBV accuracy. The CCC analysis reveals that data uncorrected for leakage effects or corrected using GV fitting are unreliable. The data simulated at 3T with a full–full preload scheme and BSW correction yielded the most accurate CBV estimates (CCC > 0.95) with the highest precision (CV=7.5%). Comparable CCC values were achieved with the half-half dosing scheme and lower field strengths but the precision was much lower (CV=14% and CV=16%). This DRO analysis provides the basis for selecting optimal single-echo DSC-MRI acquisition and post-processing strategies and can help inform standardization initiatives. We are currently expanding this systematic investigation to include a wider range of echo times, additional leakage correction strategies and use of multi-echo DSC-MRI data.Acknowledgements
NCI R01 CA158079References
1. Paulson, E.S. and K.M. Schmainda, Comparison of dynamic susceptibility-weighted contrast-enhanced MR methods: recommendations for measuring relative cerebral blood volume in brain tumors. Radiology, 2008. 249(2): p. 601-13.
2. Boxerman, J.L., K.M. Schmainda, and R.M. Weisskoff, Relative cerebral blood volume maps corrected for contrast agent extravasation significantly correlate with glioma tumor grade, whereas uncorrected maps do not. AJNR Am J Neuroradiol, 2006. 27(4): p. 859-67.
3. Bjornerud, A., et al., T1- and T2*-dominant extravasation correction in DSC-MRI: part I--theoretical considerations and implications for assessment of tumor hemodynamic properties. J Cereb Blood Flow Metab, 2011. 31(10): p. 2041-53.
4. Leu, K., et al., Improved Leakage Correction for Single-Echo Dynamic Susceptibility Contrast Perfusion MRI Estimates of Relative Cerebral Blood Volume in High-Grade Gliomas by Accounting for Bidirectional Contrast Agent Exchange. AJNR Am J Neuroradiol, 2016. 37(8): p. 1440-6.
5. Quarles, C.C., B.D. Ward, and K.M. Schmainda, Improving the reliability of obtaining tumor hemodynamic parameters in the presence of contrast agent extravasation. Magn Reson Med, 2005. 53(6): p. 1307-16.
6. Stokes, A.M., N. Semmineh, and C.C. Quarles, Validation of a T1 and T2* leakage correction method based on multiecho dynamic susceptibility contrast MRI using MION as a reference standard. Magn Reson Med, 2016. 76(2): p. 613-25.
7. Uematsu, H., et al., Vascular permeability: quantitative measurement with double-echo dynamic MR imaging--theory and clinical application. Radiology, 2000. 214(3): p. 912-7.
8. Smith, A.M., et al., Whole brain quantitative CBF and CBV measurements using MRI bolus tracking: comparison of methodologies. Magn Reson Med, 2000. 43(4): p. 559-64.
Figures