0704
Measurements of cardiac related pulsatile volumetric strain in grey and white matter brain tissue with high resolution DENSE at 7T1Department of Radiology, University Medical Center Utrecht, Utrecht, Netherlands
Synopsis
The aim of this study was to investigate the cardiac induced volumetric strain differences between grey and white matter at 7T with DENSE in young, healthy volunteers, which may provide information on properties of the microvasculature. Increasing volumetric strain was seen in the systolic phase of the heart. The average strain in the grey matter was larger compared to white matter, but this was not significant. Measuring whole brain volumetric strain is feasible with DENSE at 7T, and has the potential to assess microvascular function (passive swelling over the cardiac cycle) in various brain areas.
Purpose
Non-invasive measurements of the cardiac driven brain tissue pulsatility have the potential to provide information on the viscoelastic properties of the brain and potentially also on the properties of the microvasculature. As such, brain tissue pulsatility may be valuable in studying cerebral small vessel disease (SVD). Displacement encoding with stimulated echoes (DENSE) shows promise as a means to accurately measure tissue motion1. While volumetric strain may be used to quantify whole brain tissue pulsatility2, little is currently known about the volumetric strain differences between white and grey matter in healthy or aged brains. The aim of this study was to investigate the cardiac induced volumetric strain differences between grey and white matter at 7T with DENSE in young, healthy volunteers.Method
Measurement
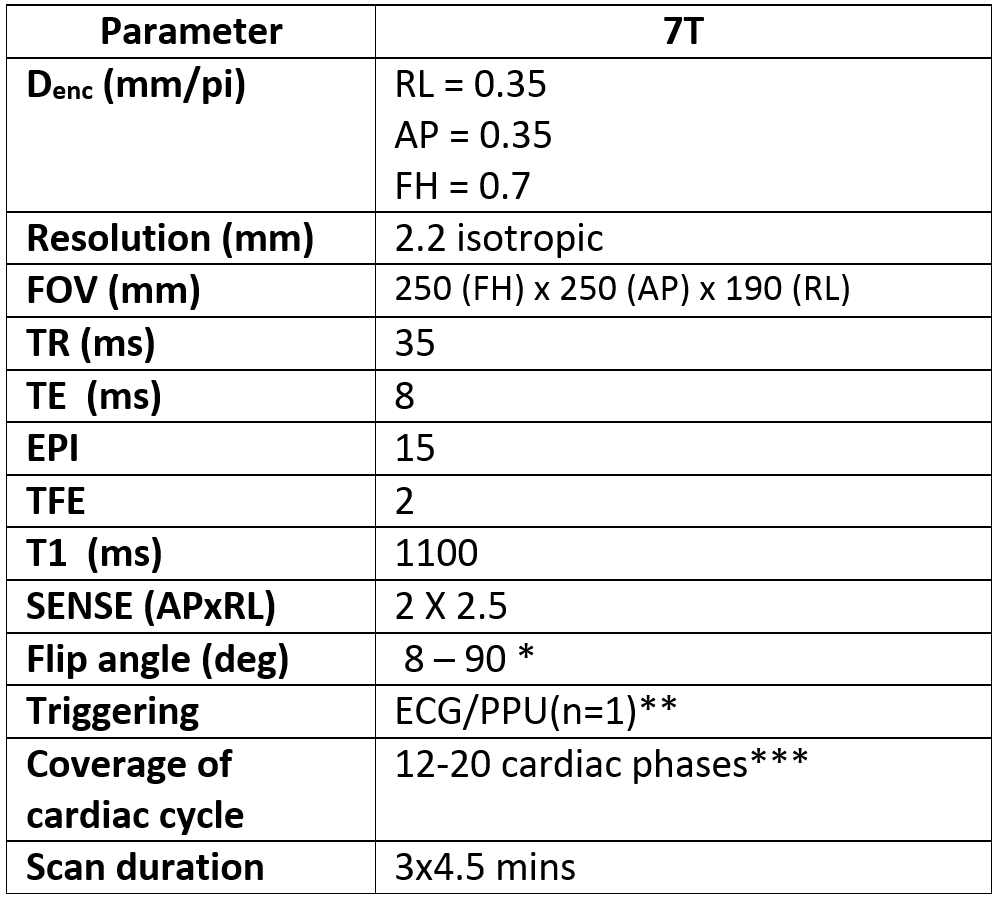
Eight subjects (5 females, age 24.3 ± 5 years) with no known cardiovascular disease were scanned on a 7T scanner (Philips Healthcare) using a 32 channel head coil (Nova Medical). Cardiac triggered DENSE was used to acquire whole volume displacement fields using a displacement sensitivity of 0.7 mm/pi in the feet-head direction (direction with largest motion1) and 0.35 mm/pi for the right-left and anterior-posterior directions. Each encoding direction was acquired in two dynamics with opposing encoding gradients for phase error correction. The number of cardiac phases acquired was varied between volunteers to cover a complete heart cycle, accounting for their individual heart rates. The protocol was similar as described by Soellinger et al.1 The parameters for the study are outlined in table 1.
Analysis
To extract the displacement information, magnitude images for each dynamic were averaged and used to create complex images by combination with the phase images of the two dynamics with opposing displacement encoding gradients. The two dynamics were subtracted through complex division to derive the final direction sensitive phase information. All phase images were unwrapped over time, thereby correcting any phase jumps that occurred between subsequent cardiac phases. Displacement was then calculated from the unwrapped phase images using $$$\mathbf{D}_{x,y,z} = \frac{D_{enc}}{2\pi } \times \Delta \varphi$$$, where $$$D_{enc}$$$ is the displacement encoding value in mm.
Volumetric strain was computed as the divergence of the displacement field ($$$\nabla \cdot \mathbf{D}= \frac{\partial \mathbf{D}_{x} }{\partial x} + \frac{\partial \mathbf{D}_{y} }{\partial y} + \frac{\partial \mathbf{D}_{z} }{\partial z}$$$), with a transverse 2D-median filter (kernel size: 2x2 pixels) being applied to each partial derivative before summation in order to smooth the data.
4D volumetric strain maps were created for each volunteer. SPM was used to segment T1 images into grey and white matter 3D masks that were then applied to the strain maps. These masks were further refined using the variance in the displacement images over the cardiac cycle, which removed noisy sources from the masks. Histograms were applied to the masked strain maps to determine the grey and white matter volumetric strain value for all cardiac phases. The volumetric strain value was considered to be the peak of the smoothed histogram curve.
Results
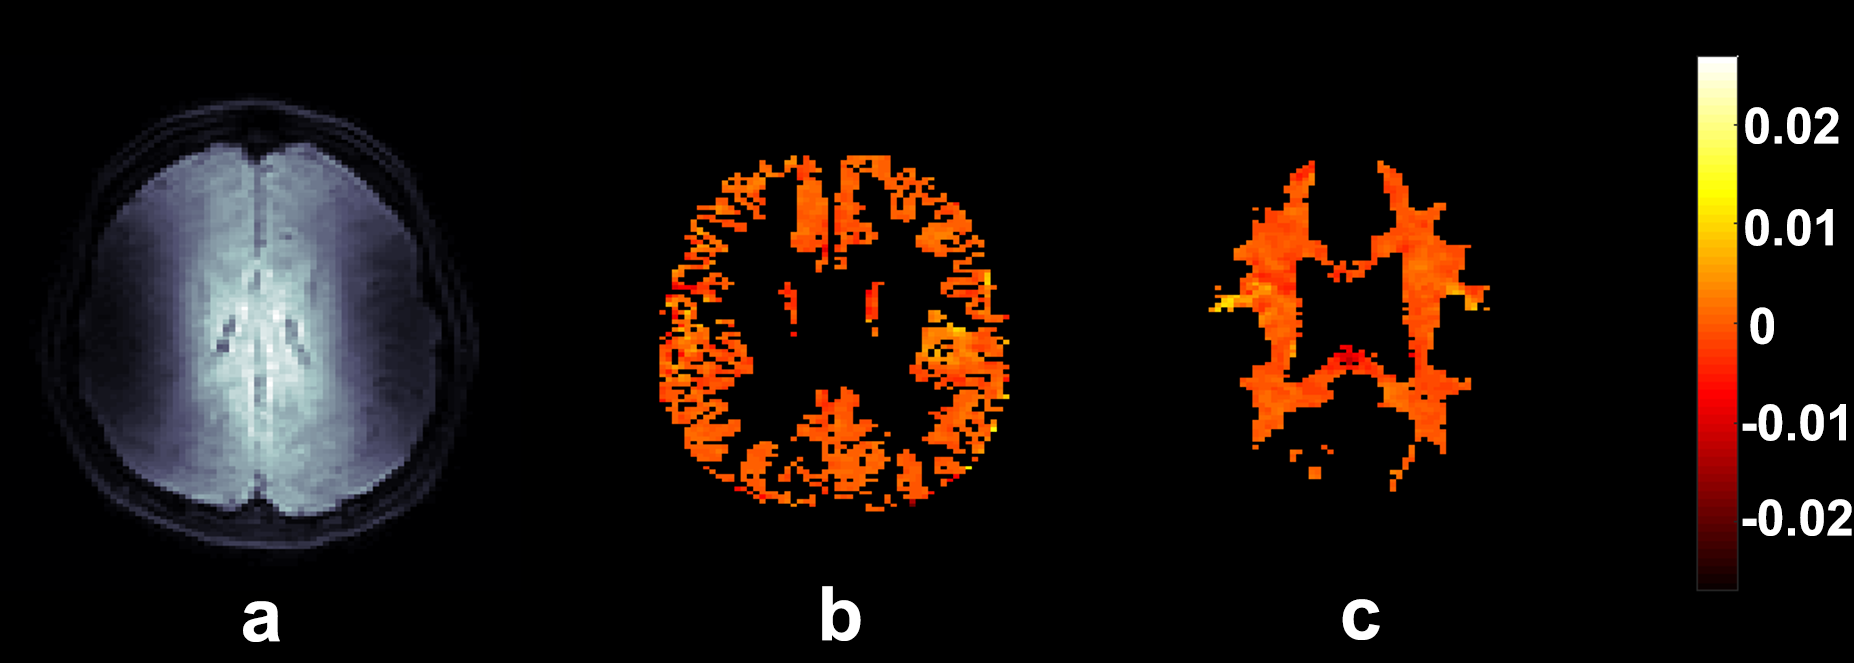
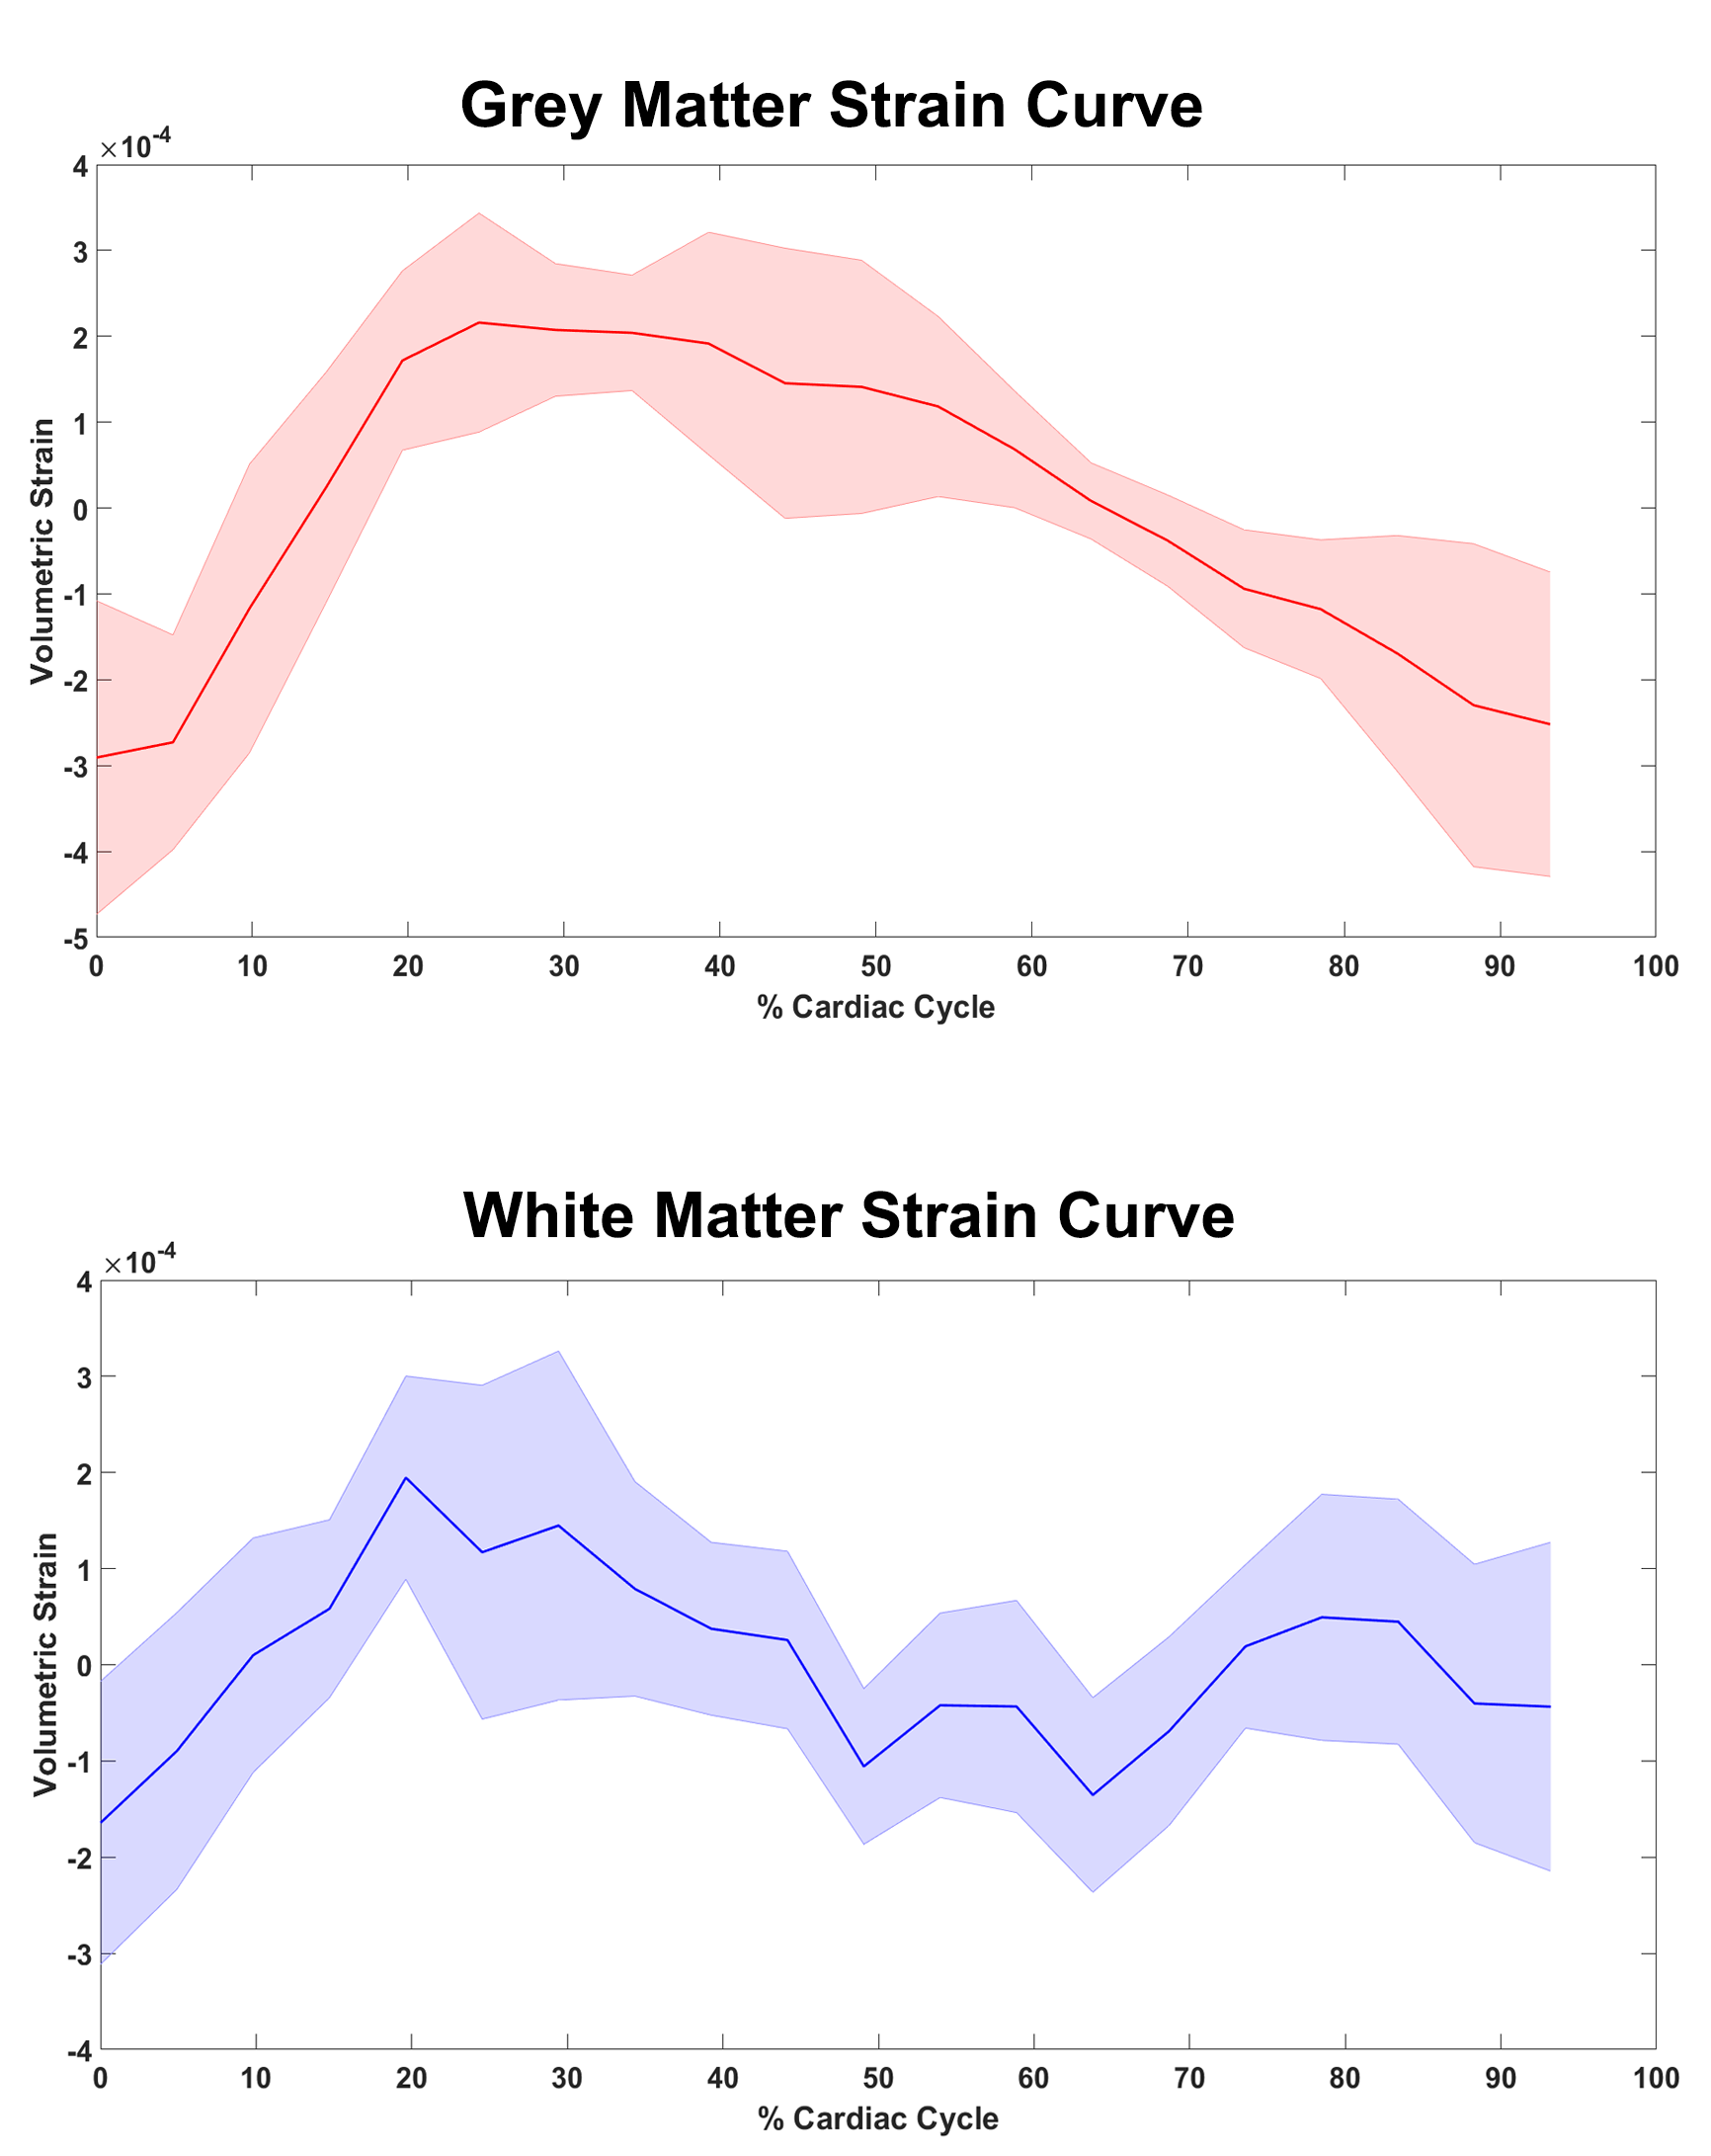
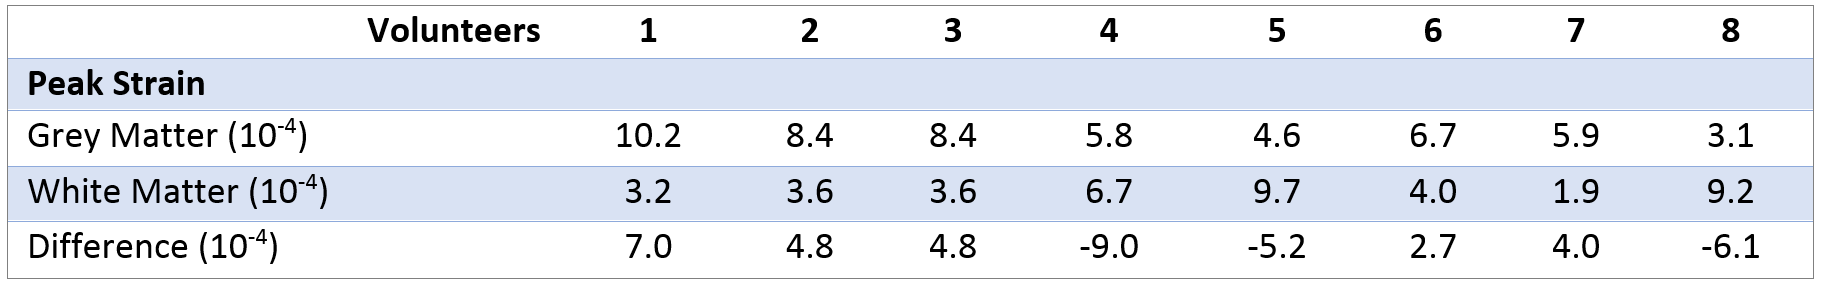
Figure 1 shows example segmented volumetric strain data. Figure 2 shows the average volumetric strain over cardiac cycle as determined by histogram peaks of the tissue strain maps for each time point of the cardiac cycle. The volumetric strain of white matter was lower than that of grey matter, but this was not significant (table 2). Mean peak strains were (mean± std) : (6.6 ± 2.3)*10-4 and (5.2 ± 2.9)*10-4 for grey and white matter respectively.Discussion
DENSE at 7T MRI allowed for sufficiently high SNR and resolution to analyse the grey and white matter tissue separately. The average volumetric strain over all volunteers was larger in grey matter, which would be consistent with the higher blood volume in grey matter compared to white matter. However, the difference with white matter was not significant. The increase in volume during the systolic phase of the cardiac cycle suggests that the volumetric strain reflects swelling of the microvasculature, rather than tissue compression from the large vessels. Some images exhibited ghosting artefacts from heart rate variation as mentioned by Soellinger1. These areas were excluded by our analysis thanks to the histogram analysis, but should be addressed in future work. A complete dataset of three orthogonal displacement fields is required for volumetric strain computation, thus considerable distortion in any of the three could cause inaccurate calculations. Future work is needed to establish the reproducibility and the potential for studying differences between healthy subjects and patients with SVD.Conclusion
Measuring whole brain volumetric strain is feasible with DENSE at 7T, and has the potential to assess microvascular function (passive swelling over the cardiac cycle) in various brain areas.Acknowledgements
This work was supported by the European Research Council, ERC grant agreement n°337333.References
1. Soellinger M, Rutz AK, Kozerke S, Boesiger P. 3D cine displacement-encoded MRI of pulsatile brain motion. Magn Reson Med. 2009;61(1):153-162.
2. Hirsch S, Klatt D, Freimann F, Scheel M, Braun J, Sack I. In vivo measurement of volumetric strain in the human brain induced by arterial pulsation and harmonic waves. Magn Reson Med. 2013;70(3):671-682.
3. Fischer SE, McKinnon GC, Maier SE, Boesiger P. Improved myocardial tagging contrast. Magn Reson Med. 1993;30(2):191-200.
Figures