0703
An Improved Probabilistic Atlas of the Dentate Nucleus Derived with QSM1Radiology, Ruijin Hospital,Shanghai Jiao Tong University School of Medicine, Shanghai, People's Republic of China, 2Center for Advanced Neuroimaging, University of California, Riverside, Riverside, CA, United States, 3Center for Advanced NeuroImaging, University of California Riverside, Riverside, CA, United States, 4the department of Neurology, Emory School of Medicine, Atlanta, GA, United States, 5Radiology, Ruijin Hospital,Shanghai Jiao Tong University School of Medicine, 6Electrical Engineering and Computer Sciences, University of California, Berkeley, CA, United States, 7MR Research, GE Healthcare, Shanghai, People's Republic of China, 8Radiology, Ruijin Hospital,Shanghai Jiao Tong University School of Medicine, shanghai, People's Republic of China, 9Center for Advanced Neuroimaging, University of California, Riverside, CA, United States, 10Bioengineering, University of California, Riverside, Riverside, CA, United States
Synopsis
Prior dentate nucleus (DN) atlases were derived using T1-, T2*- or susceptibility-weighted imaging. Accurate delineation of the DN boundary is difficult in these images. We present an atlas derived from quantitative susceptibility maps, which exhibit better contrast between DN and surrounding cerebellum tissue. An improved delineation of DN boundaries was achieved, resulting in increased maximum overlap in our DN atlas as compared to previously published results. We anticipate the atlas to be used in a variety of imaging applications ranging from functional imaging of DN to measuring DN iron deposition arising from disease.
Introduction
The dentate nucleus (DN) is the major output nucleus of the cerebellum and is rich in iron. It is structurally connected to the red nucleus, thalamus, and motor cortex via the cerebellar-thalamus-cortex circuit and is functionally connected to the motor cortex, premotor cortex, prefrontal cortex, and posterior parietal areas. Due to these connections, DN plays a key role in both normal brain function (such as movement, cognition, and emotion) and is involved in multiple neurological disorders. None the less, DN is rarely investigated in imaging studies. This is partly due to difficulties arising from the delineation of DN in magnetic resonance images with conventional contrasts. Atlases overcome these issues by providing a standardized region of interest (ROI) for automated processing. Prior DN atlases were derived using T1-weighted images, T2*-weighted images or susceptibility weighted images (SWI). T2* blooming artifacts and the non-local property of phase make identification of DN boundaries challenging in T2*-weighted or SWI images. Such difficulty in the accurate delineation of the DN may be the reason for lower consistency of previously published dentate nucleus atlases.Objectives
Quantitative susceptibility mapping (QSM) provides more accurate mapping of iron, allowing for more precise delineation of DN than either T2-weighted images or susceptibility weighted images as shown in Figure 1. The objective of the present work is to construct a new DN atlas in MNI space using QSM images, for use in investigating normal function as well as dysfunction of DN in imaging studies.Methods and Materials
Image Acquisition
MRI scanning was performed on a 3.0 T MR system (Signa HDxt; GE Healthcare, Milwaukee, WI). Imaging parameters for the multiecho-GRE sequence were: repetition time: 59.3 ms; echoes: 16; first echo time: 2.7 ms; echo time spacing: 2.9 ms; bandwidth: 488.28Hz/pixel; flip angle: 12°; field of view: 22x22 cm; matrix size: 256×256; resolution: 0.86×0.86×1.0mm3; acceleration factor: 2; slices: 136; total acquisition time: 10 minutes 42 seconds. Slices in the multi-echo GRE sequence were oriented axially.
Image processing and DN Segmentation
QSM processing was performed as described in previous studies [1, 2]. Dentate nuclei were segmented in QSM images using a thresholding approach (threshold = 0.025 ppm, voxels with susceptibility values higher than 0.025ppm were classified as DN) from 41 healthy volunteers (mean age: 63.7±7.4 years; age range: 45-75 years; 15 males and 26 females).
Probabilistic Atlas Creation
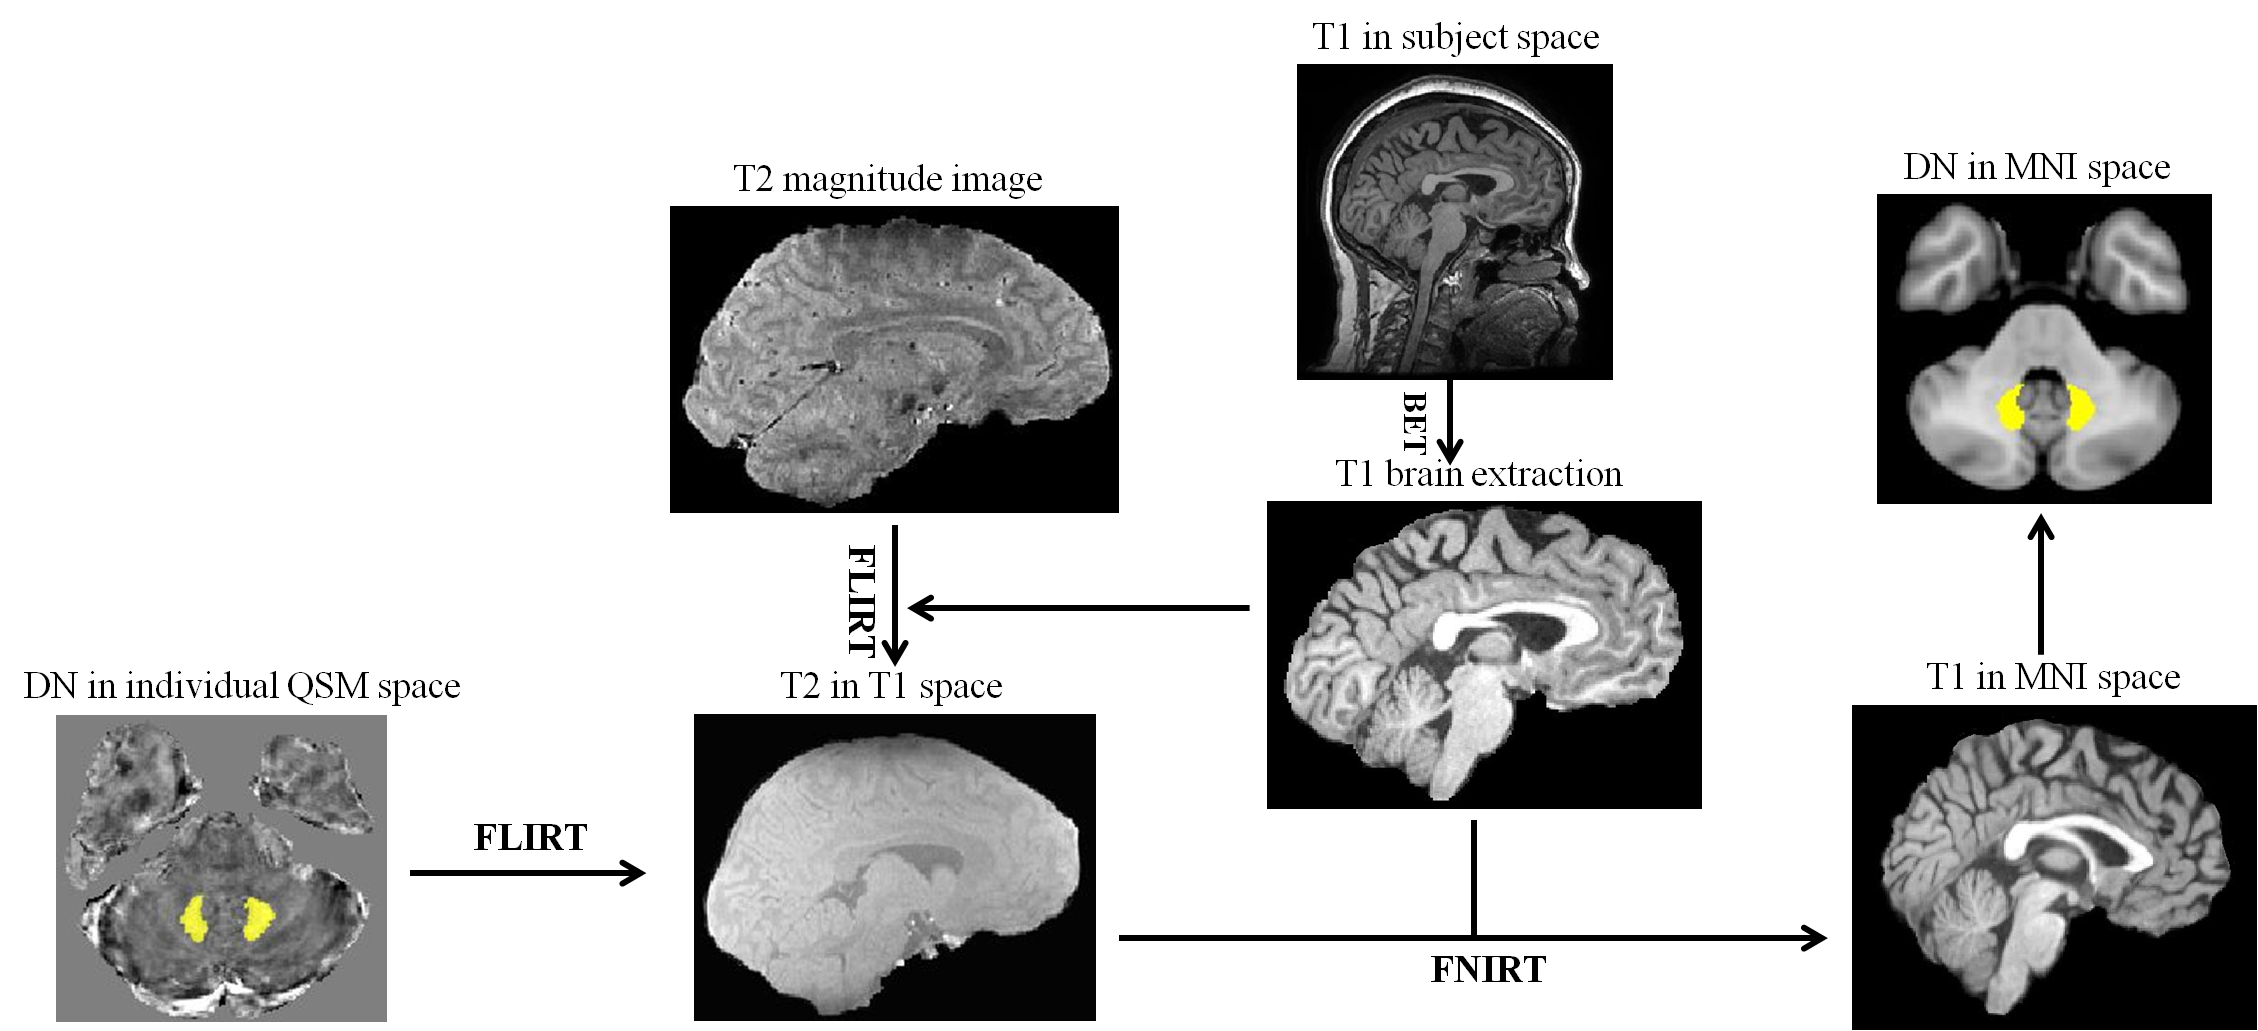
After delineation of bilateral dentate nuclei in individual QSM space, the DN volumes were transformed into T1 space, and then, the DN volumes in T1 space were transformed into Montreal Neurological Institute (MNI) common space using FMRIB’s Software Library (FSL) package (http://fsl.fmrib.ox.ac.uk/fsl/fslwiki/) as detailed in a previous paper [3] (shown in Figure 2). Next, the resulting individual DN volumes, in MNI space, which contains values between 0 and 1 due to interpolation dictated by registration, were binarized at a thresholod of 0.5. Finally, the binarized DN volumes were averaged across all subjects to create the probabilistic atlas for DN in MNI space. The center of mass of bilateral DNs was determined from the population mask.
Results
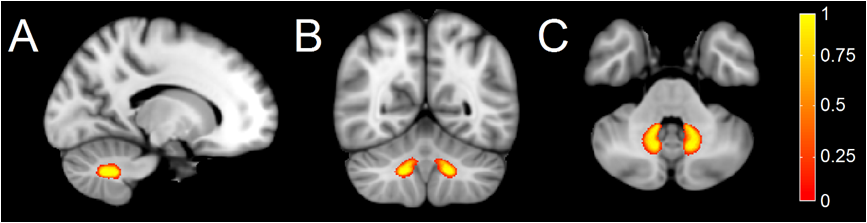
The center of mass of the left and right sides of the QSM-based DN atlas in Montreal Neurological Institute space was (-13.6 mm, -56.3 mm, -36.9 mm) and (13.8 mm, -56.2 mm, -36.8 mm), respectively (Figure 3). The maximal overlap and mean overlap of the DN atlas with the individually segmented DNs in this cohort was 100% and 50.8%, respectively, in contrast to the maximum overlap of approximately 75% and mean overlap of 23.4% to 33.7% with earlier DN atlases [4, 5].Conclusions
Using QSM, which provides superior iron-sensitive MRI contrast for delineating iron-rich structures, an improved probabilistic atlas for the dentate nuclear has been generated. The atlas can be applied to investigate the role of DN in both normal cortico-cerebellar physiology and the variety of disease states in which it is implicated.Acknowledgements
The authors thank Dr. Thomas Wichmann for critical review of this abstract. The authors thank Dr. Hongmei Fu and Dr. Hengfen Gong for recruiting part of the volunteers. The authors wish to thank all the subjects who participated in this study. The study was supported in part through State Key Clinical Department of Medical Imaging. XH, DH, and JL are supported in part by the Michael J. Fox Foundation (MJF 10854). CL is supported in part by the National Institutes of Health through grants R01MH096979 and R01NS079653.References
1. Li W, Wu B, Liu C. Quantitative susceptibility mapping of human brain reflects spatial variation in tissue composition. Neuroimage 2011;55:1645-1656.
2. He N, Huang P, Ling H, et al. Dentate nucleus iron deposition is a potential biomarker for tremor-dominant Parkinson's disease. NMR in biomedicine 2016. DOI: 10.1002/nbm.3554.
3. Langley J, Huddleston DE, Merritt M, et al. Diffusion tensor imaging of the substantia nigra in Parkinson's disease revisited. Human Brain Mapping 2016; 37:2547-56.
4. Dimitrova A, Zeljko D, Schwarze F, et al. Probabilistic 3D MRI atlas of the human cerebellar dentate/interposed nuclei. Neuroimage 2006;30:12-25.
5. Diedrichsen J, Maderwald S, Kuper M, et al. Imaging the deep cerebellar nuclei: a probabilistic atlas and normalization procedure. Neuroimage 2011;54:1786-1794.
Figures