0701
A seed point discontinuity-based level set method for accurate substantia nigra and red nucleus segmetation in QSM images1Department of Physics, Shanghai Key Laboratory of Magnetic Resonance, East China Normal University, Shanghai, People's Republic of China, 2MR Collaboration NE Asia, Siemens Healthcare, Shanghai, People's Republic of China, 3Siemens Shenzhen Magnetic Resonance Ltd., Shenzhen, People's Republic of China, 4Department of Neurology, East Hospital Affiliated to Tongji University, Shanghai, People's Republic of China, 5Department of Radiology, Weill Medical College of Cornell University, New York, United States
Synopsis
Accurate segmentation of substantia nigra (SN) and red nucleus (RN) in quantitative susceptibility mapping (QSM) images has great clinical value in quantifying iron deposition and measuring disease severity. We propose a new segmentation algorithm which uses the discontinuity of seed points in different tissues as prior knowledge. Seed points in SN or RN can be obtained from standard atlas or specified manually. This prior was then incorporated into level set method to segment SN and RN. Experiments on in-vivo MR images showed that the proposed method achieved more accurate segmentation results than the atlas-based method and classic level-set method.
Background and Purpose
Quantitative susceptibility mapping (QSM) is a powerful tool for quantifying iron deposition increase in the substantia nigra (SN) and red nucleus (RN) of patients with idiopathic Parkinson’s disease (PD).1 Due to the small size of SN and RN, accurate segmentation is essential for quantification of iron deposition and, in turn, the severity of disease progression. Current segmentation methods, however, are suboptimal. The conventional atlas-based methods may be substantially influenced by inter-subject variability. Subject-specific methods, such as level set, perform poorly when deep brain nuclei are in close proximity. Here, we describe a method to improve the segmentation accuracy of SN and RN in QSM images.
Methods
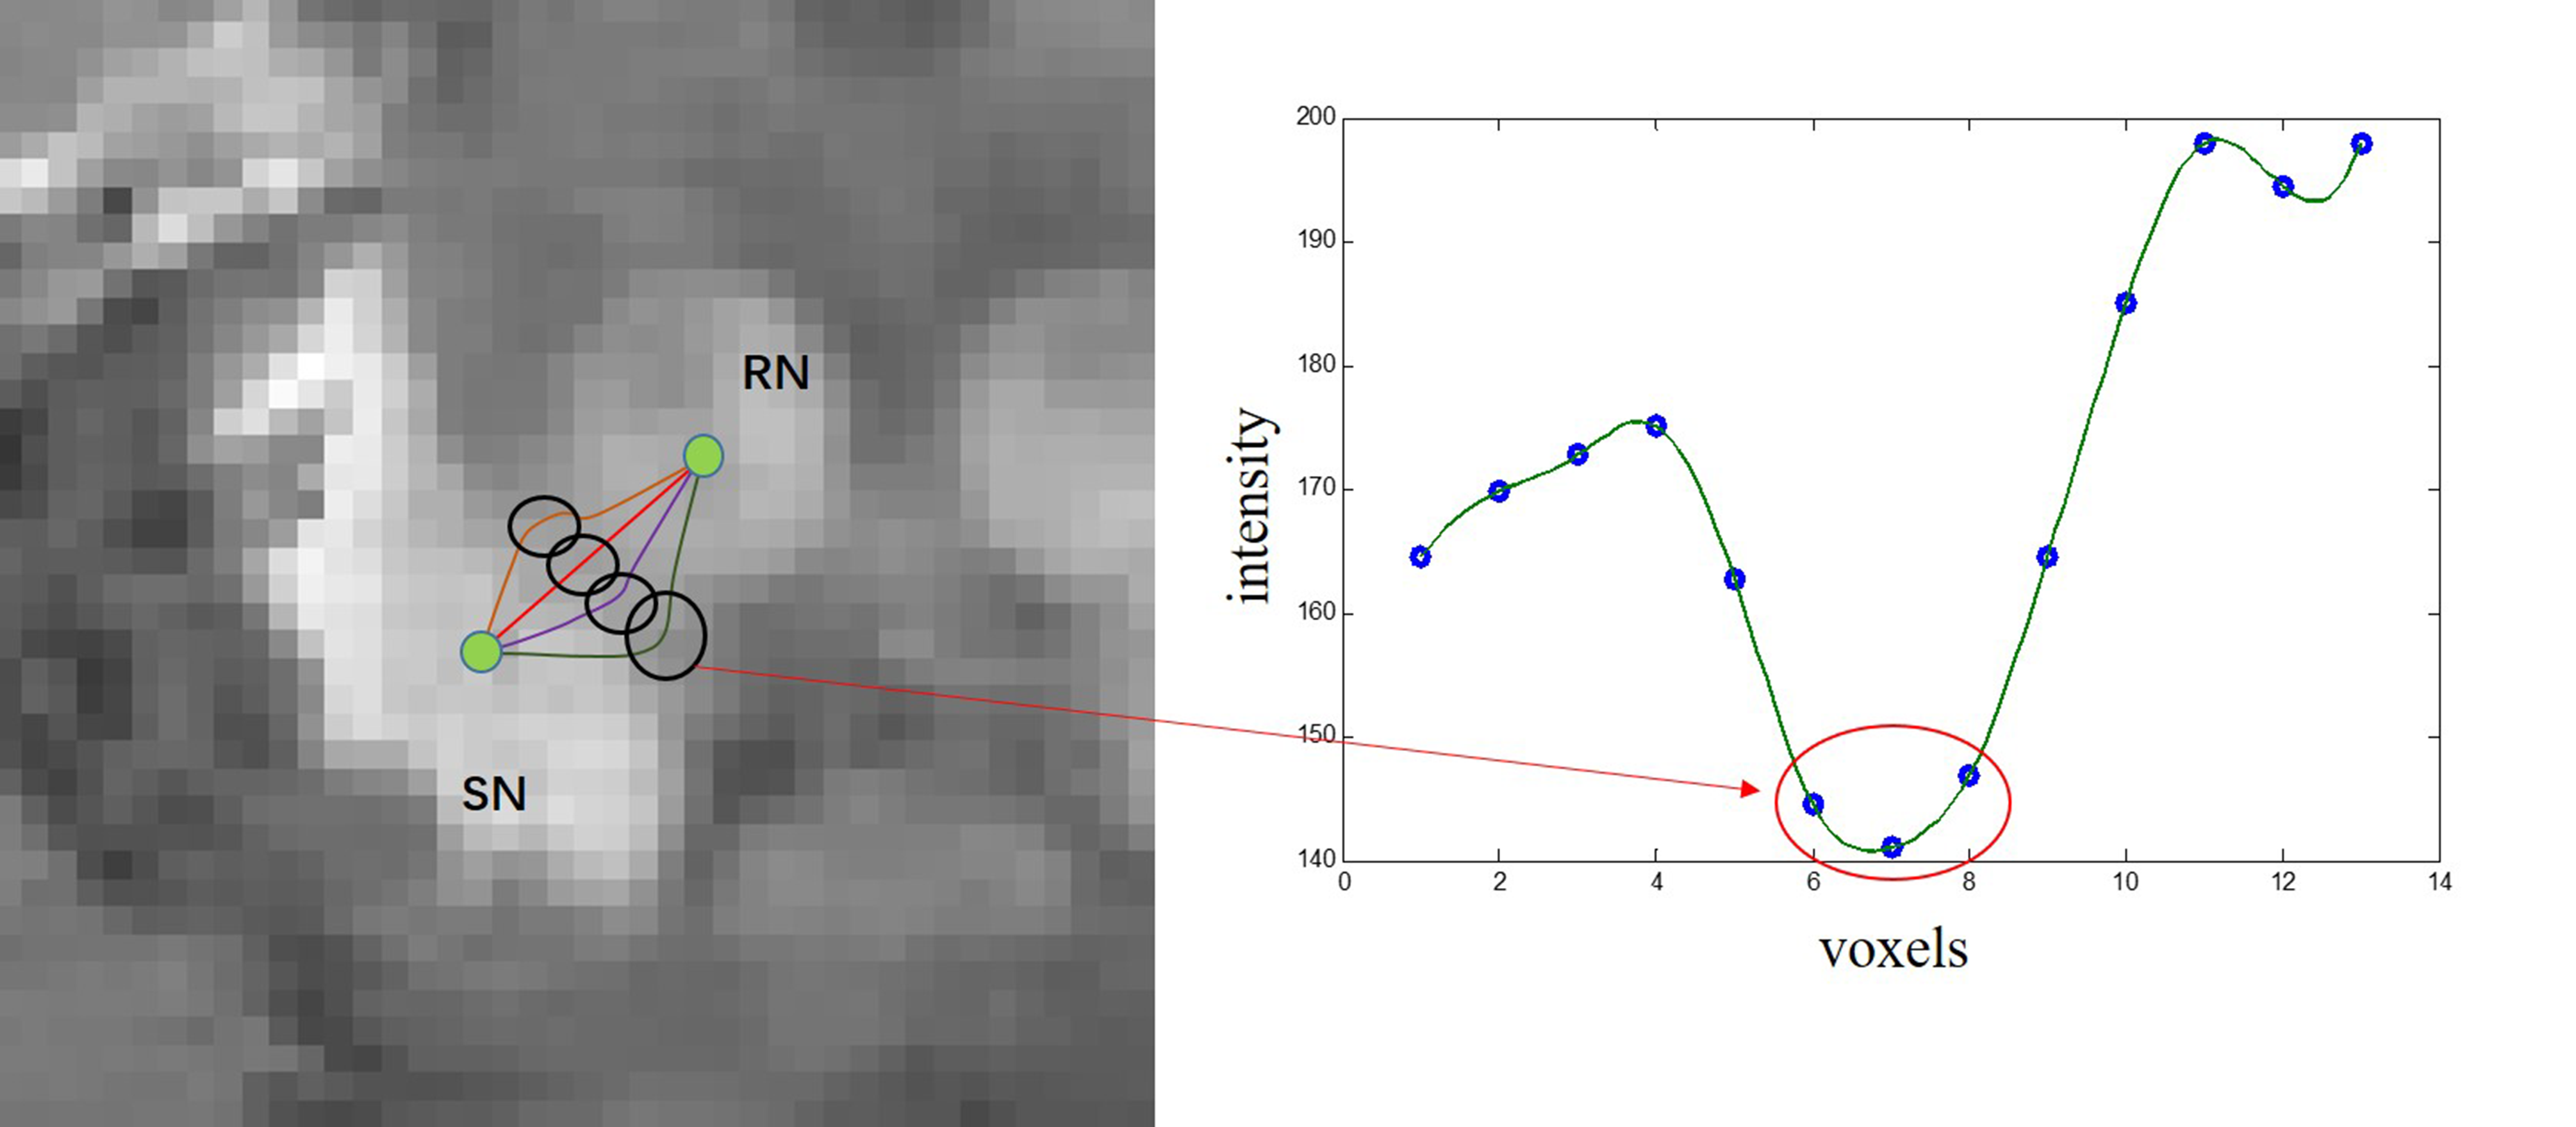
A total of 11 patients with PD (67.9 ±4.9 years old, 5 males and 6 females) and 11 healthy controls (HC) (68.2 ± 5.6 years old, 5 males and 6 females) underwent MR scans on a clinical 3T system (MAGNETOM Trio Tim; Siemens, Erlangen, Germany) with a 12-channel head matrix coil. The QSM images and R2* mapping were obtained from the same three-dimensional (3D) multi-echo gradient-echo sequence with the following parameters: TR = 60ms, TE1 = 6.8ms, ΔTE = 6.8ms, echo number = 8, flip angle = 15˚, FOV = 240x180 mm2, in-plane resolution = 0.625x0.625 mm2, slice thickness = 2 mm, number of slices = 96. QSM images were calculated from the phase data using the Morphology Enabled Dipole Inversion (MEDI) algorithm.2 Prior knowledge of seed points was used to improve segmentation accuracy of the level set method for slices with poor contrast between SN and RN. We first obtained initial regions-of-interest (ROIs) of the whole SN and RN using the human brain atlas method.3 Although the ROIs were not accurate, two seed points lied in SN and RN respectively can be found correctly by calculating the barycenter of each ROIs (or manually made them). We knew these two seed points are not connected due to they belong to different tissues. Thus, an intensity profile of the voxels along the shortest path between the two seed points was then analyzed so as to wipe off those voxels that belonging to neither SN nor RN. The above processing was repeated several times until the classic level set method could separate these two nuclei effectively after a proper number of voxles (belong to neither SN nor RN) were wiped off. Note that the shortest path between two seed points changed constantly with iterations because it could not get through the voxels that had been wiped off. The details of the processing is shown in Figure1. The ROIs were obtained using the "Diffeomap" software provided by Issel Anne L. Lim.3 We adopted a Dice Similarity Index to evaluate the results:$$Dice = \frac{2\left({S}\cap{T}\right)}{\left(S+T\right)}$$ where S and T denote the number of pixels in the manual and automatic segmentation and S∩T denotes the number of pixels in the overlay of the two segmentation results.
Results
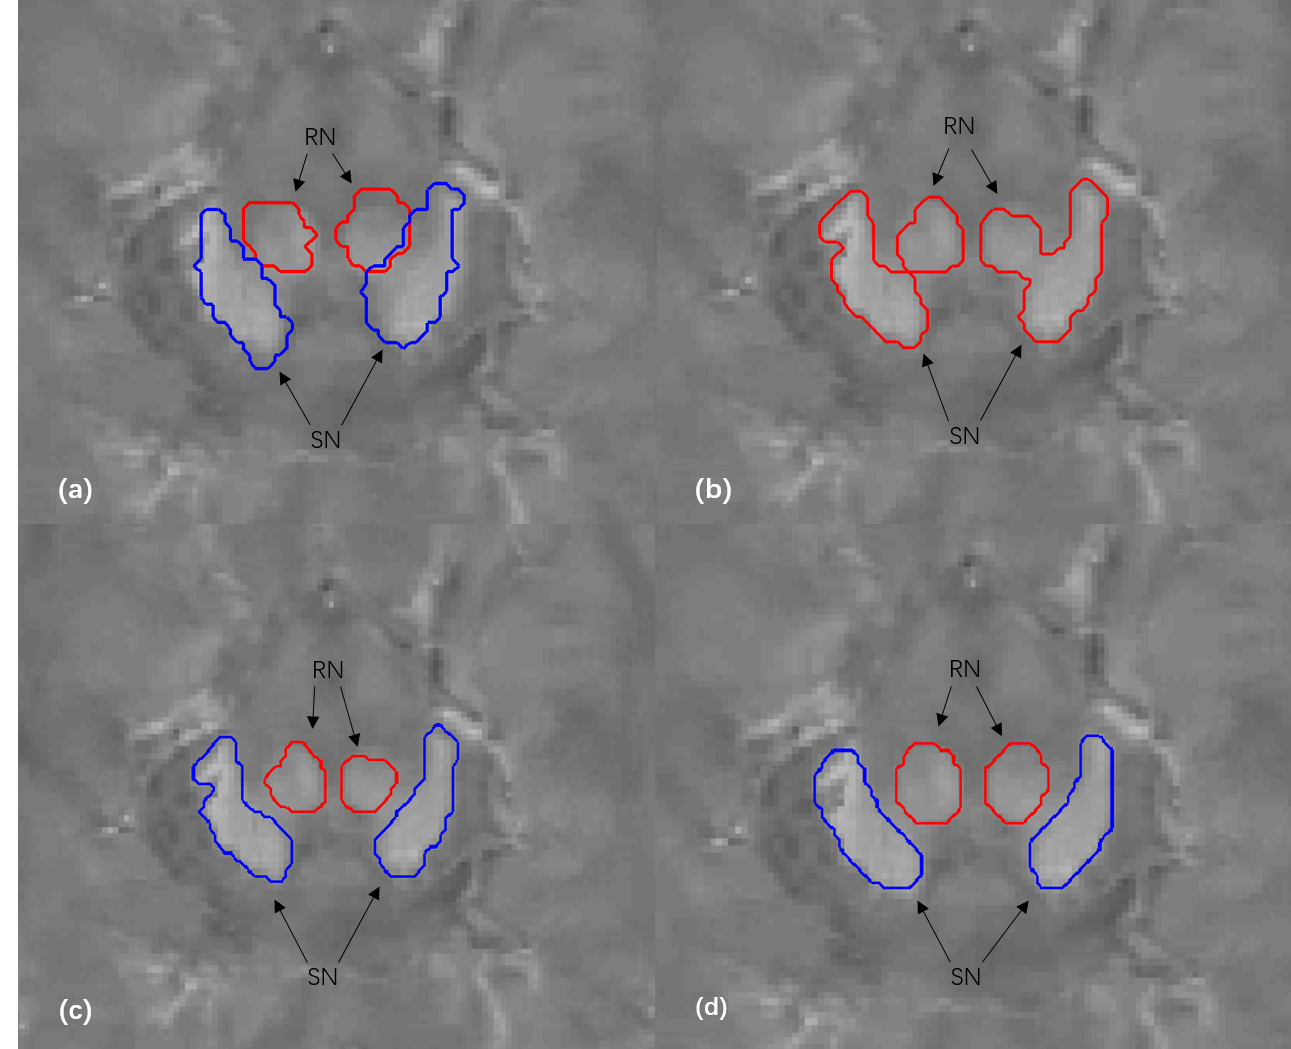
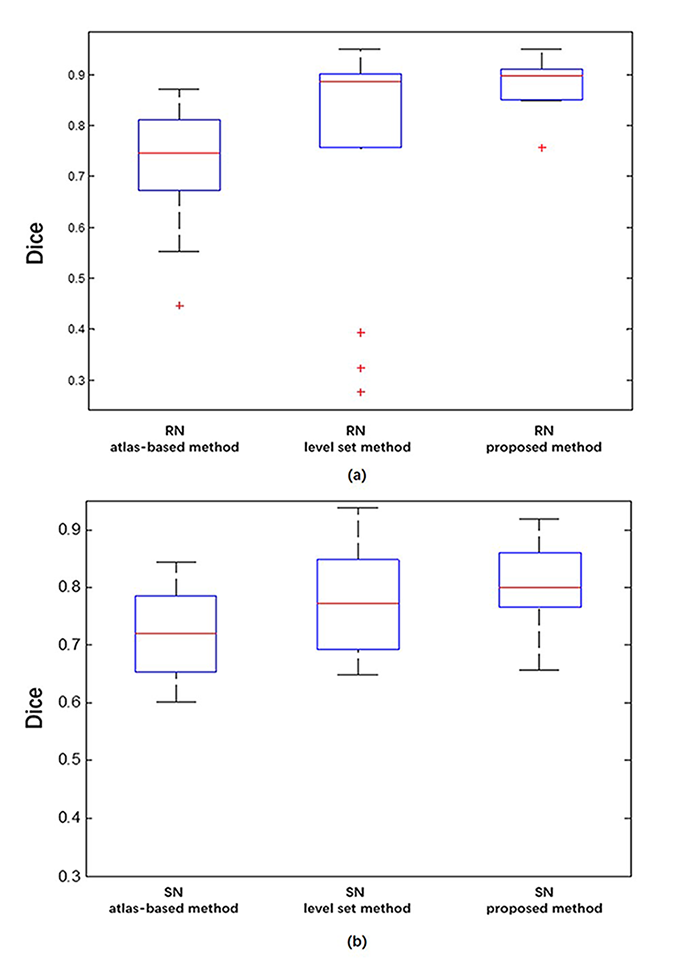
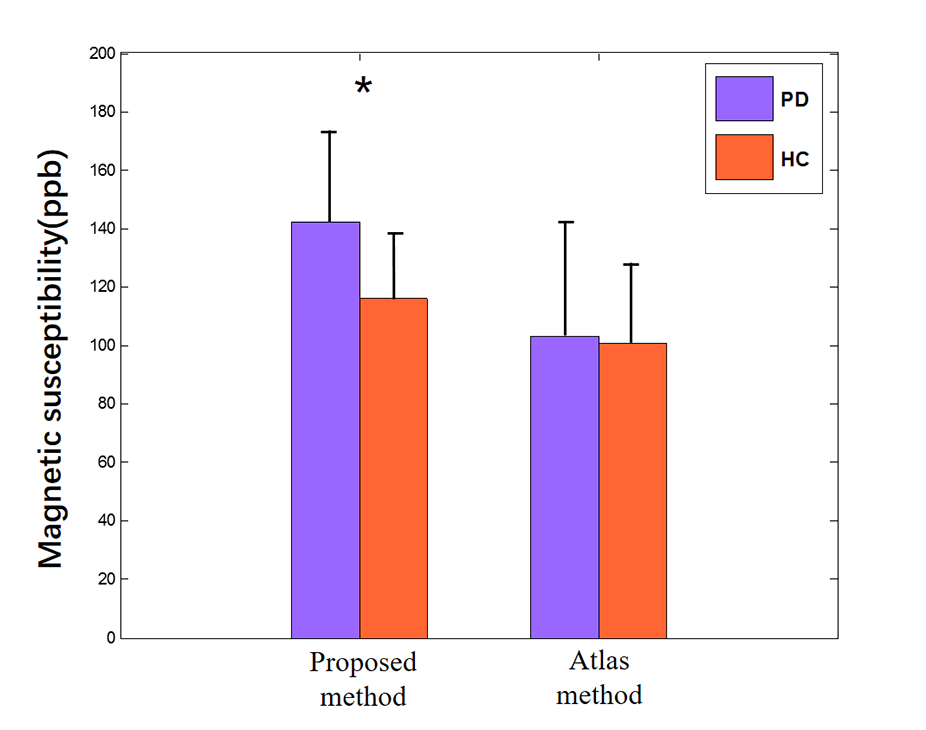
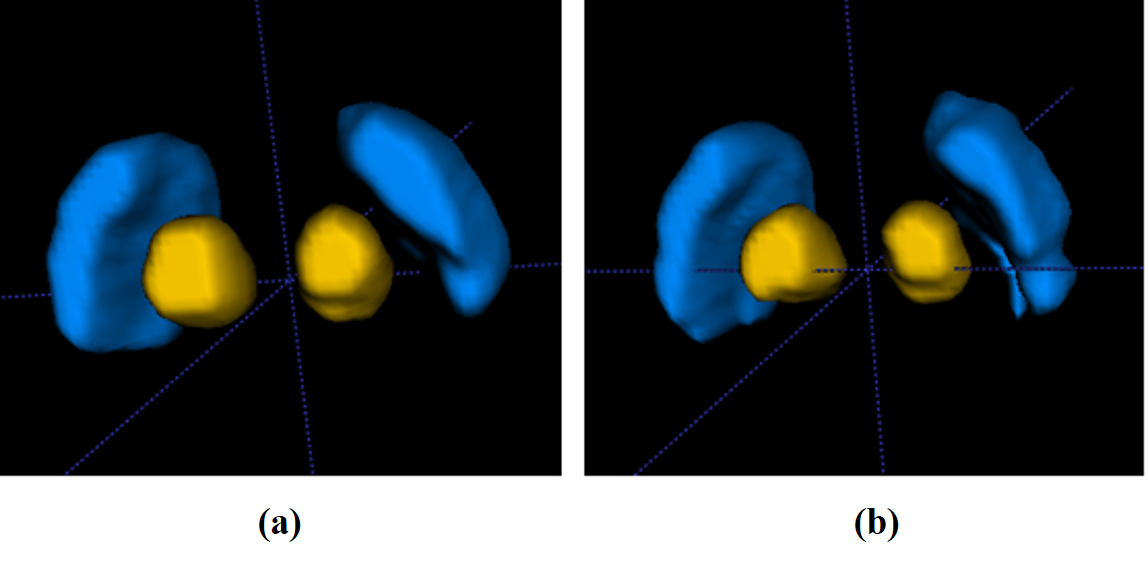
An example of the segmentation obtained with the proposed method is shown in Figure 2, along with a comparison to other methods. Compared with the atlas-based method 3 and the level set method 4, our method effectively separated SN from RN. Fourteen image sets were segmented using three algorithms. Statistics of the Dice coefficients of all three methods are shown in Figure 3 for RN and SN. It can be seen that our method performed best in that it has the highest Dice for both RN and SN. In addition, we applied the proposed method to calculate the mean susceptibility in SN, which yielded a significantly higher susceptibility value in PD patients than that in healthy controls. However, this conclusion could not be obtained by the conventional atlas method (Figure 4). A three--dimensional representation of segmenting SN and RN is shown in Figure 5.
Discussion and Conclusion
We proposed a seed point discontinuity-based method for level set to improve its segment accuracy of SN and RN in QSM images. Results showed that the proposed method has better consistency to manual segmentation results than the conventional atlas-based method and classic level set method, because it has the highest Dice Similarity Index. Moreover, from clinical perspective, the proposed method demonstrated a significant higher magnetic susceptibility value of SN in patients with PD than that in healthy controls, which is consistent with other's findings.5Acknowledgements
This study was supported in part by grants from The National Natural Science Foundation of China (81271533) and Shanghai Key Laboratory of Magnetic Resonance.References
1. Murakami Y, Kakeda S, Watanabe K, et al. Usefulness of quantitative susceptibility mapping for the diagnosis of Parkinson disease. American Journal of Neuroradiology. 2015; 36(6): 1102-1108.
2. Liu T et al. Cerebral Microbleeds: Burden assessment by using quantitative susceptibility mapping. Radiology. 2011; 262(1):269-78.
3. Lim I A L, Faria A V, Li X, et al. Human brain atlas for automated region of interest selection in quantitative susceptibility mapping: application to determine iron content in deep gray matter structures. Neuroimage. 2013; 82: 449-469.
4. Li B, Jiang C, Li L, et al. Automated Segmentation and Reconstruction of the Subthalamic Nucleus in Parkinson's Disease Patients. Neuromodulation: Technology at the Neural Interface. 2016; 19(1): 13-19.
5. Langkammer C, Pirpamer L, Seiler S, Deistung A, Schweser F, Franthal S, et al. Quantitative Susceptibility Mapping in Parkinson's Disease. PLOS ONE. 2016; 11(9): e0162460.
Figures