0700
In vivo imaging of human Locus coeruleus at 3 and 7 Tesla1Faculty of Health and Medicine, Maastricht University, Maastricht, Netherlands, 2Faculty of Physhology and Neuroscience, Maastricht University, Maastricht, Netherlands
Synopsis
Structural and functional alterations of the Locus coeruleus (LC) are implicated in various neurological diseases, including Alzheimer’s. Current standard spin-echo based approaches to imaging the LC suffer from several limitations at 3T, including long acquisition time and highly anisotropic resolution. In this study, we have evaluated in healthy human subjects different MRI contrasts both at 3 and 7 Tesla to image LC. We show that visualization of the locus coeruleus is best achieved with magnetization transfer contrast at 7T superior to standard T1- and T2-weighted methods.
Introduction
The Locus Coeruleus (LC) is a neuromelanin-rich brainstem structure that is the source of noradrenaline in the cortex. LC is thought to modulate attention [1] and memory [2]. Recently, LC has been suggested as the starting point for Alzheimer’s disease pathology in the brain [3-5]. In vivo LC imaging is commonly performed with a 2D T1-weighted Turbo Spin Echo (TSE) sequence. Sufficient Signal-to-Noise ratio (SNR) with 3T TSE time requires the use of thick slices [6,7], restricted coverage and long acquisition times. Furthermore, LC contrast in TSE is thought to occur due to incidental Magnetization Transfer (MT) effects [8] and/or iron deposition [6]. Achieving incidental-MT contrast with 7T TSE is challenging due to increased energy deposition (SAR); this has hindered LC imaging at 7T so far. Goal of this project was to achieve high-resolution LC imaging at 7T and compare it with standard approaches at 3T.
Knowledge of the source of contrast is important for the development of a quantitative LC atrophy estimation method. In this study, we developed a high-resolution MT-weighted imaging approach based on a gradient-echo sequence and we compared its performance to a TSE at both 3T and 7T. Furthermore, we explored if the LC contrast reported in the TSE relates to MT effects or increased iron deposition.
Methods
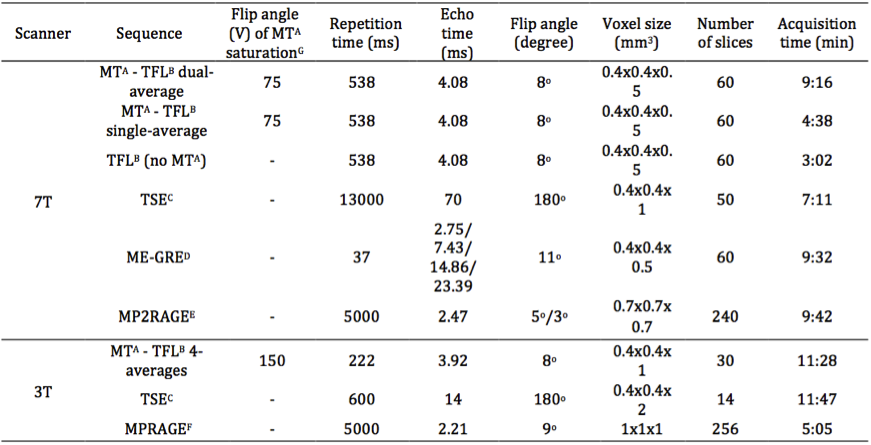
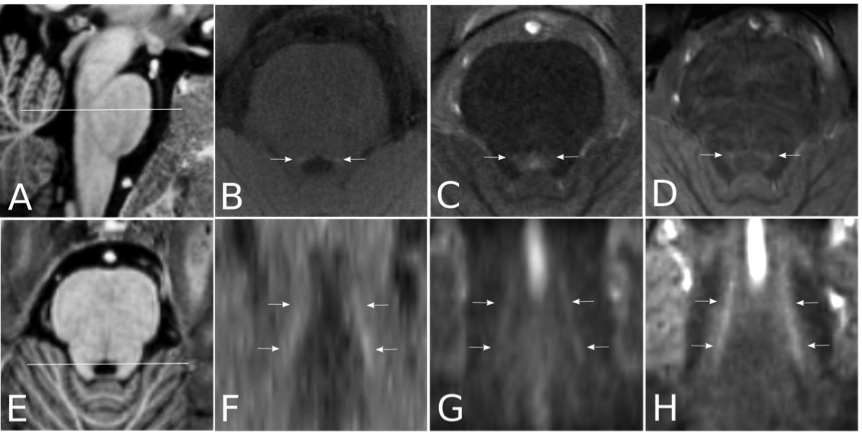
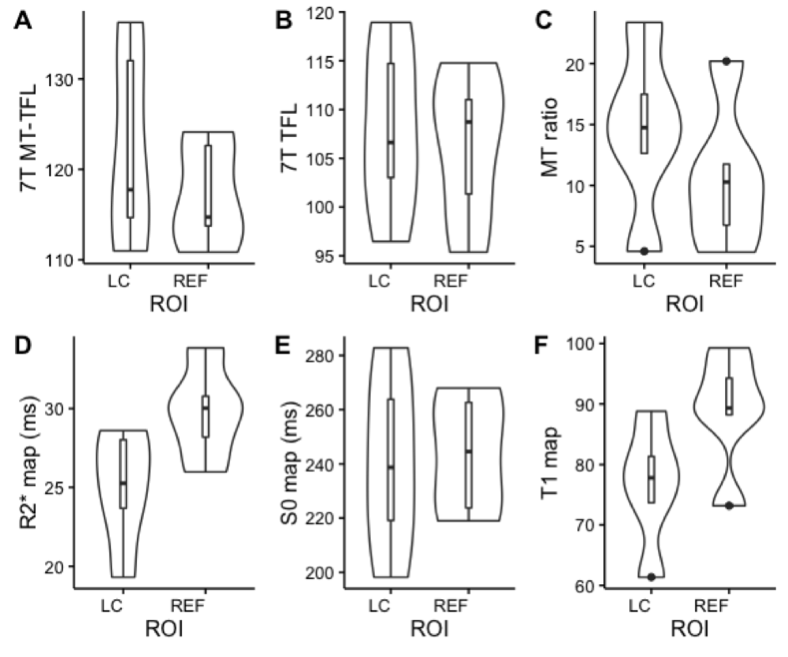
A MT-weighted Turbo Flash (MT-TFL) sequence was developed, consisting of a multi-shot 3D readout with center-out k-space sampling [9] preceded by a train of off-resonant Gaussian sinc pulses. MR data from 6 young healthy participants (4 males, 25.6±4.1 years) were acquired on a 7T Magnetom scanner and a 3T Prisma scanner (Siemens Healthineers, Erlangen, Germany). At 7T, we performed acquisition-time-matched TSE (0.4x0.4x1mm³) and MT-TFL (0.4x0.4x0.5mm³), a shorter single-average MT-TFL (TA=4:35min), a non-MT-TFL (to obtain MT-ratio), multi-echo gradient-echo (ME-GRE) and MP2RAGE [10] scans. At 3T, we performed acquisition-time-matched TSE (0.4x0.4x2mm³) and MT-TFL (0.4x0.4x1mm³) and a MPRAGE [11]. All acquisition parameters are listed in detail in Table 1. Hyperintense voxels in the LC region were selected in the 3T TSE 3T, 3T MT-TFL and 7T MT-TFL scans (Figure 1). SNR and Contrast-to-Noise (CNR) between the LC and a reference ROI (REF) were calculated. For the MT-TFL and ME-GRE comparison, the R2* and S0 (signal at TE = 0) maps were obtained from the magnitude images of the 7T ME-GRE, as well as the MT-ratio maps from the 7T MT-TFL. LC and REF TSE 3T segmentations were projected to each scan and the average intensity was entered into a Wilcoxon signed-rank test for MT-TFL, TFL, MTR, R2*, S0 and T1 images.Results
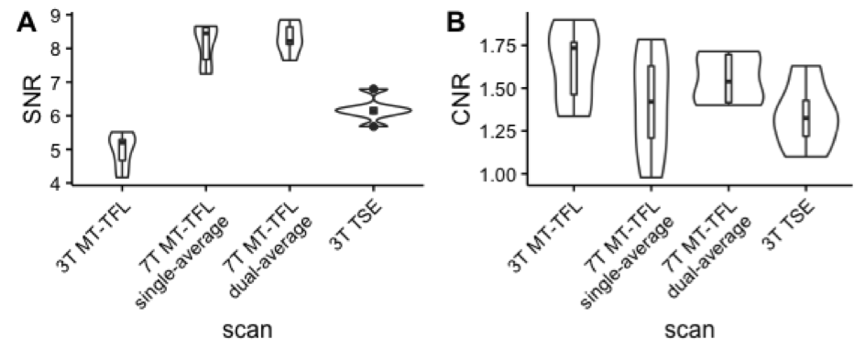
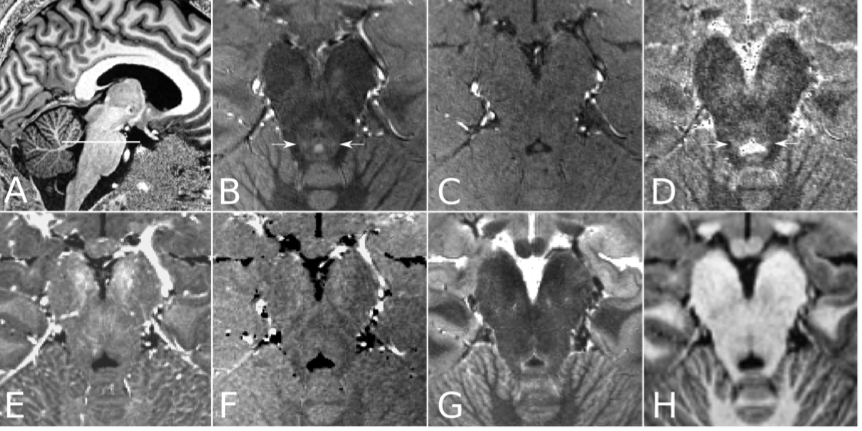
The MT-TFL sequence showed contrast at both 3T and 7T in the LC region. In 7T MT-TFL, this was the case for both single- and dual-average acquisitions. No LC contrast was detected with 7T TSE (Figure 1, 3). 3T and 7T MT-TFL and 3T TSE had comparable LC SNR and CNR towards REF (Figure 2). In the MT-TFL and ME-GRE comparison, the mean LC intensity (M=122.33, SD=11.14) was higher compared to the REF (M=117.21, SD=5.83) in the MT image, Z=15.00, p=0.03. No difference between LC and REF was found in TFL, R2*, S0, MTR or T1 images (Figure 3, 4).Discussion
This novel in-house developed MT-TFL sequence provided contrast in the LC region at both 3T and 7T. For the first time, in-vivo LC imaging was achieved at higher resolution (2 and 4 times smaller voxel size for 3T and 7T respectively) and with comparable SNR and CNR to the current standard TSE. At 7T, this was also the case with the much shorter MT-TFL, which holds promise for clinical application where short scan times are imperative for patient comfort and to avoid motion-induced image corruption. Interestingly, we observed that the source of the LC contrast is primarily due to MT rather than iron deposition.Conclusion
In this study, we used a MT-weighted sequence to image the LC in vivo at 3T and, for the first time, at 7T at greater resolution. Our results indicate that MT-TFL compares favorably to the current standard TSE. There is increased interest on LC atrophy as a potential biomarker in neurodegenerative diseases (particularly Alzheimer’s) and our results provide evidence that MT approaches hold great promise for clinical diagnostics in the future.Acknowledgements
We would like to thank the University Fund Limburg for funding support.References
1. Berridge CW, and Waterhouse BD. The locus coeruleus–noradrenergic system: modulation of behavioral state and state-dependent cognitive processes. Brain Research Reviews. 2003;42(1):33-84.
2. Sterpenich V, D’Argembeau A, Desseilles M, et al. The Locus Ceruleus Is Involved in the Successful Retrieval of Emotional Memories in Humans. The Journal of Neuroscience. 2006;26(28):7416-7423.
3. Marcyniuk B, Mann D, and Yates P. The topography of cell loss from locus caeruleus in Alzheimer's disease. J Neurol Sci. 1986;76(2):335-345.
4. Busch C, Bohl J, and Ohm TG. Spatial, temporal and numeric analysis of Alzheimer changes in the nucleus coeruleus. Neurobiol Aging. 1997;18(4):401-406.
5. Braak H, and Del Tredici K. Alzheimer's pathogenesis: is there neuron-to-neuron propagation? Acta Neuropathol. 2011;121(5);589-595.
6. Sasaki M, Shibata E, Tohyama K, et al. Neuromelanin magnetic resonance imaging of locus ceruleus and substantia nigra in Parkinson's disease. Neuroreport. 2006;17(11):1215-1218.
7. Keren N, Lozar C, Harris K, et al. In vivo mapping of the human locus coeruleus, Neuroimage. 2009;47(4):1261-1267.
8. Keren N, Taheri S, Vazey EM, et al. Histologic validation of locus coeruleus MRI contrast in post-mortem tissue. NeuroImage. 2015;113(1):235-245.
9. Mougin OE, Coxon RC, Pitiot A, et al. Magnetization transfer phenomenon in the human brain at 7 T. Neuroimage. 2010;49(1):272-281.
10. Marques JP, Kober T, Krueger G, et al. MP2RAGE, a self bias-field corrected sequence for improved segmentation and T1-mapping at high field. Neuroimage. 2010;49(2):1271-1281.
11. Mugler III JP, Brookeman JR. Three-dimensional magnetization-prepared rapid gradient-echo imaging (3D MP RAGE). Magn Reson Med. 1990;15(1):152-157
Figures