0699
Optimization of Lateral Geniculate Nucleus Volume Determination at 3T and 7TNjoud Aldusary1,2, Lars Michels1, Birgit Keisker1, Michael Wyss3, Karen Huebel1, Arwa Baeshen1,2, David Otto Brunner3, Klaas Paul Pruessmann3, Klara Landau4, Spyridon Kollias1, and Marco Piccirelli1
1Neuroradiology, University Hospital Zurich, Zurich, Switzerland, 2King Abdulaziz University, Jedaah, Saudi Arabia, 3Inst. for Biomed. Eng., University and ETH Zurich, Zurich, Switzerland, 4Ophthalmology, University Hospital Zurich, Zurich, Switzerland
Synopsis
The clinical 2D PD scans and the research very high resolution 3D T1 scans used to determine the lateral geniculate nucleus (LGN) have high contrast respectively high resolution, but too low resolution respectively too long acquisition time. Nevertheless, volumetric and contrast quantification of the LGN and of other brain tissues might increase in clinical relevance. Therefore, we optimized the contrast of 3D T1 MPRAGE to obtain the best contrast with sufficient resolution to quantify volume and contrast of the LGN.
Purpose
The lateral geniculate nucleus (LGN) is a small (50-150 mm3) thalamic nucleus of the visual pathway processing motion. Precise depiction of LGN borders is needed to establish structural and anatomical alterations in ophthalmologic and neurodegenerative pathologies. Nevertheless, LGN volumes reported in the literature spread greatly. Therefore, we test the ability of 3D isotropic high resolution images with increased contrast to noise ratio (CNR) to improve LGN volume assessment against the clinical standard: proton density (PD) 2D TSE at 3T and the research standard: a motion corrected very high resolution 3D TFE at 7T.Materials and Methods
First, the contrast between LGN and surrounding tissues in function of the MPRAGE inversion time (TI) was simulated to determine TIs for white matter (WM) anf grey matter (GM) signal nulling. Experimental validation was also performed.Then, MPRAGE with WM signal nulled (WM0), MPRAGE with GM nulled (GM0), and PD images were obtained at 3T on 25 healthy subjects and at 7T on a subgroup of 14 healthy subjects selected prospectively, after approval by the ethics committee of the Canton of Zurich and written informed consent, with 32 channels receive head coils. The research gold standard developed within this study was a motion corrected segmented (7 dynamics) MPRAGE scan at 7T with maximized CNR and a resolution of 0.4x0.4x0.4mm3.
GM0 images were also subtracted from WM0 images to further increase contrast between LGN and surrounding tissues.
Three investigators segmented LGN independently and intraclass correlation coefficients (ICCs) were determined for volume and CNR quantification.
Results
The chosen TI provided optimal grey respective white matter signal nulling.On coronal sections, at 3T and 7T, the LGN appeared as a small triangle in all MPRAGE images similarly as on PD images. The motion corrected 0.4x0.4x0.4mm3 segmented MPRAGE gave a very clear depiction of the LGN.
The CNR of the substracted WM0-GM0 images: 2.9±0.7 was higher than on other contrast: at 3T and 7T, and gave reliable estimations of the LGN volume and contrast at 3T and 7T. The CNR and the CNR after correction for voxel size and sqrt(acquisition time - TA) of the 3D TFE scan was higher than the PD 2D TSE at 3T and 7T. The 7T scanner had slightly higer CNR than the 3T scanner. Nevertheless, after correction for voxel size and sqrt(TA) the scanner effect disappeared, and the most efficient sequence was the WM0/GM0.
The LGN volumes determined at 3T were slightly smaller than the one determined at 7T (-7±2 mm3 p=0.003). The LGN volume was also smaller on the GM0 scan relative to the 3 other sequences (PD: -12±3, WM0: -9±1, WM0-GM0: -9±2 mm3 p<0.01). The correlation with the research standard, the motion corrected 0.4x0.4x0.4mm3 segmented MPRAGE, was significant (p<0.05) for all but one sequence and explained up to 50% of the variance. The mean LGN size was determined in the range 107±4 mm3. Male having a slightly bigger LGN. Age and laterality had consistent effect.
The raters’ ICCs were similar for all sequences for volume determination. For the CNR determination, the PD at 3T and the MPRAGE at 7T had the highest reliability. For LGN segmentation, all raters preferred the higher CNR and resolution of the MPRAGE scans. Nevertheless, thicker slices resulted in a good integrator and did not decrease the volume measurement accuracy – except for discretization noise due to the small number of slices covering the LGN for the PD scan at 7T.
Conclusion
High-resolution high-contrast 3D LGN images allow reliable LGN volume and signal determination. Our contrast optimization methods increased CNR and enabled thereby clinical applicability – also to other nuclei - and testing of clinical relevance.Acknowledgements
No acknowledgement found.References
No reference found.Figures
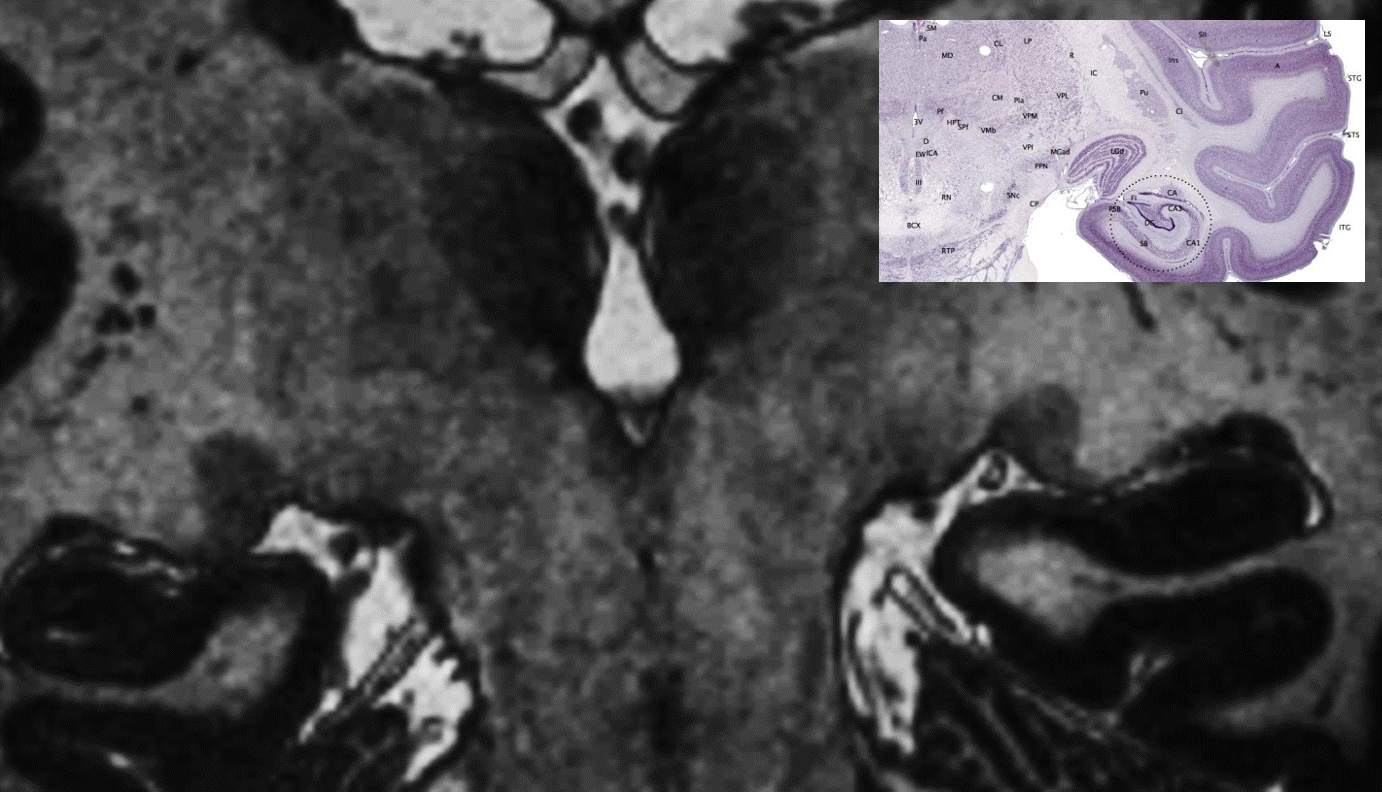
Figure1: Comparison of coronal LGN morphology with motion corrected 0.4x0.4x0.4mm3 3D T1 TFE image of the LGN. Notice the vessel wall depiction just below the LGN. On the right a histology preparation resolving the LGN’s 7 GM layers and the WM border of the LGN.
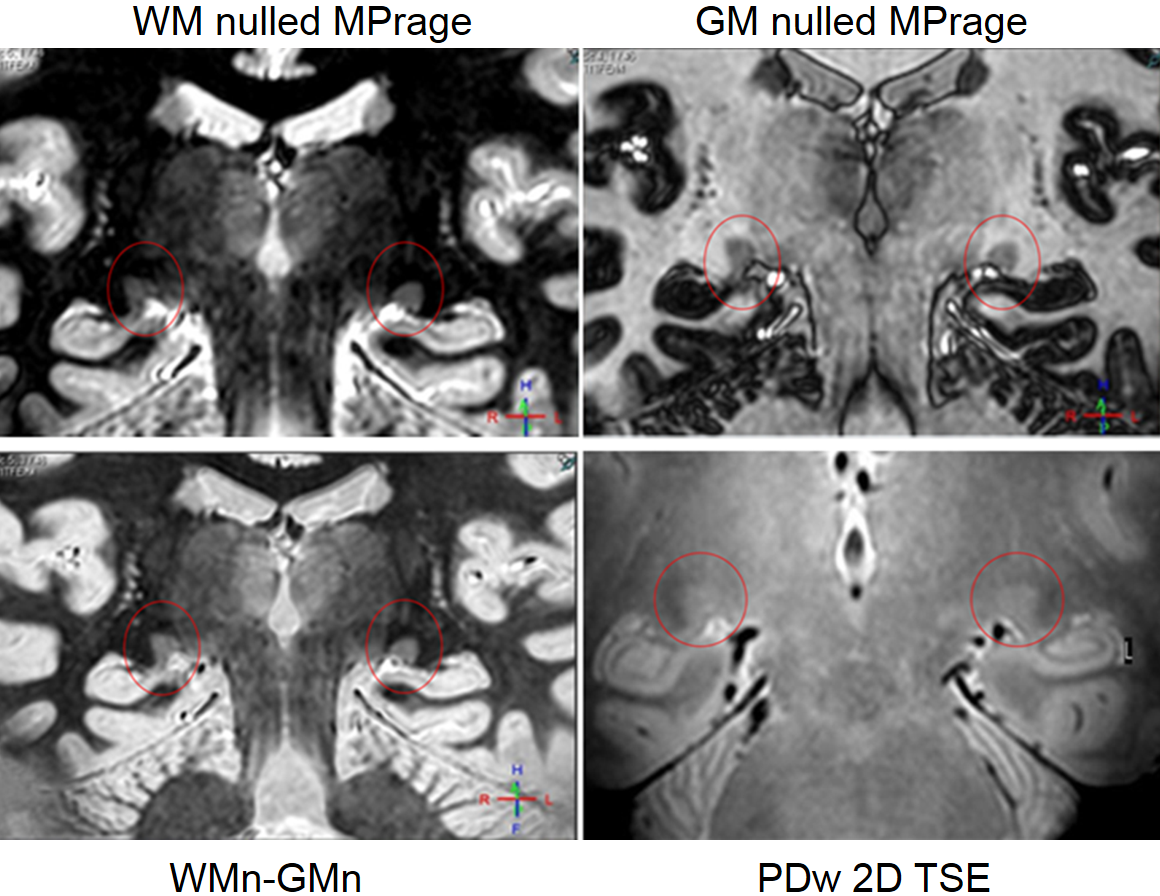
Figure2: Coronal LGN images obtained at 7T with 0.75x0.75x0.75mm3 resolution A white matter nulled (WM0) MPRAGE image B grey matter nulled (GM0) MPRAGE image C WM0-GM0 image D proton density (PD) weighted TSE image with resolution 0.6x0.6x1.5 mm3.
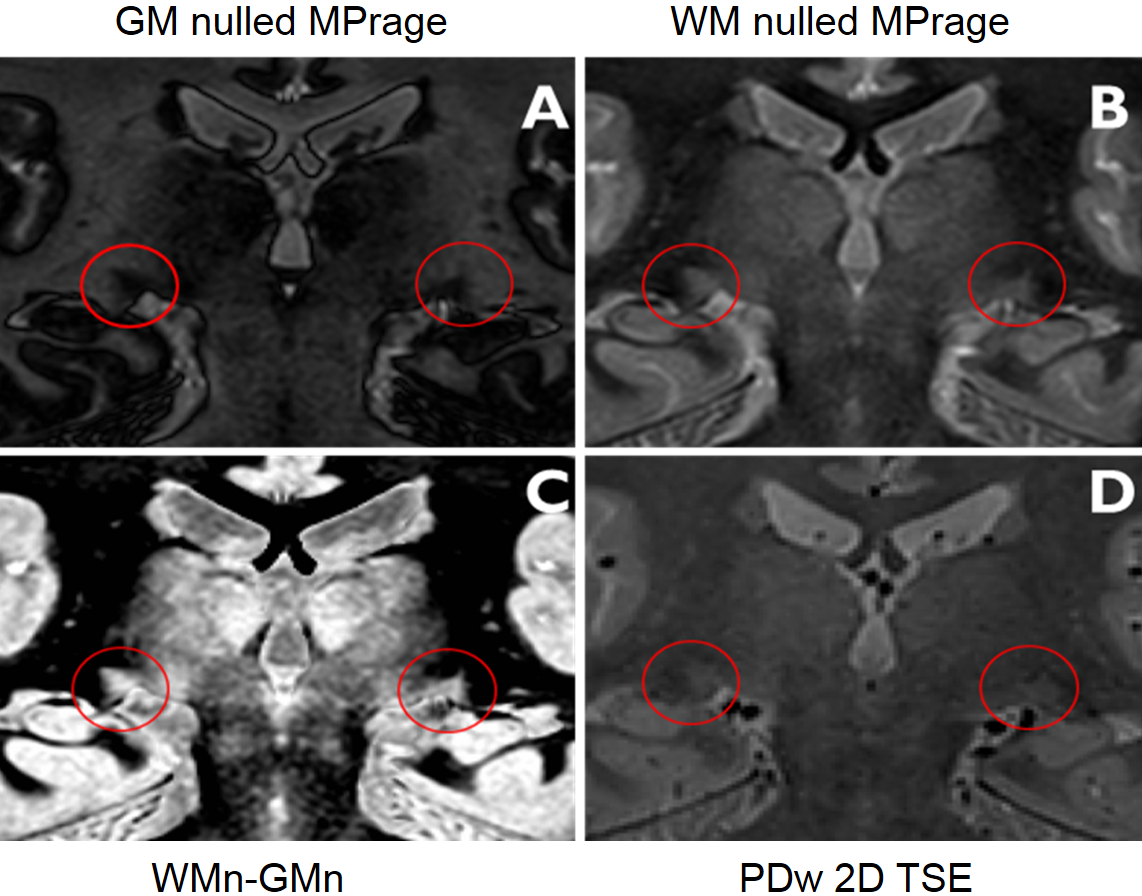
Figure3: Coronal LGN images obtained at 3T with 0.75x0.75x0.75mm3 resolution A grey matter nulled (GM0) MPRAGE image B white matter nulled (WM0) MPRAGE image C WM0-GM0 image D proton density (PD) weighted TSE image with resolution 0.8x0.8x0.8 mm3.
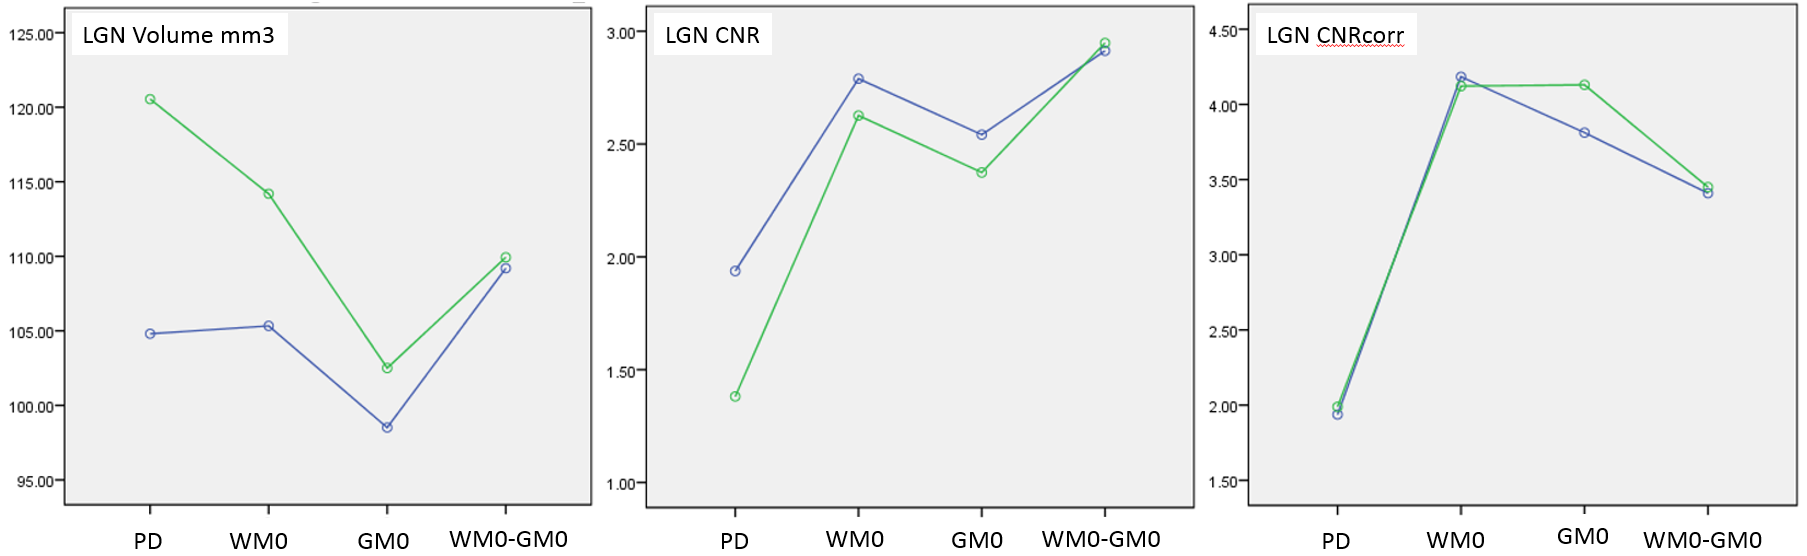
Figure4: The Volume, the CNR, and the CNRcorr are ploted for the 4 sequences for the 3T scanner in blue and the 7T scanner in green.
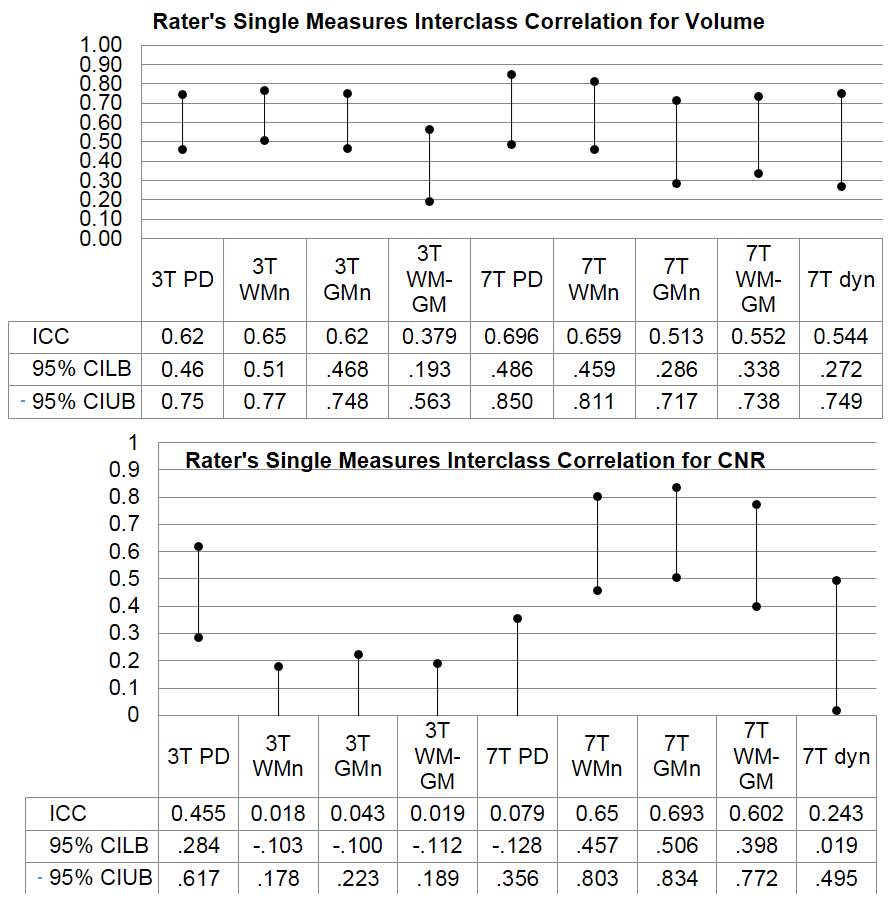
Figure5: Intraclass correlation coefficient for single rating for LGN Volume and CNR determination. The raters’ ICCs for the Volume are similar for the all sequences but the ICCs for CNR determination vary drastically between scanners. The effect of slice thickness on the ICC needs further investigation.
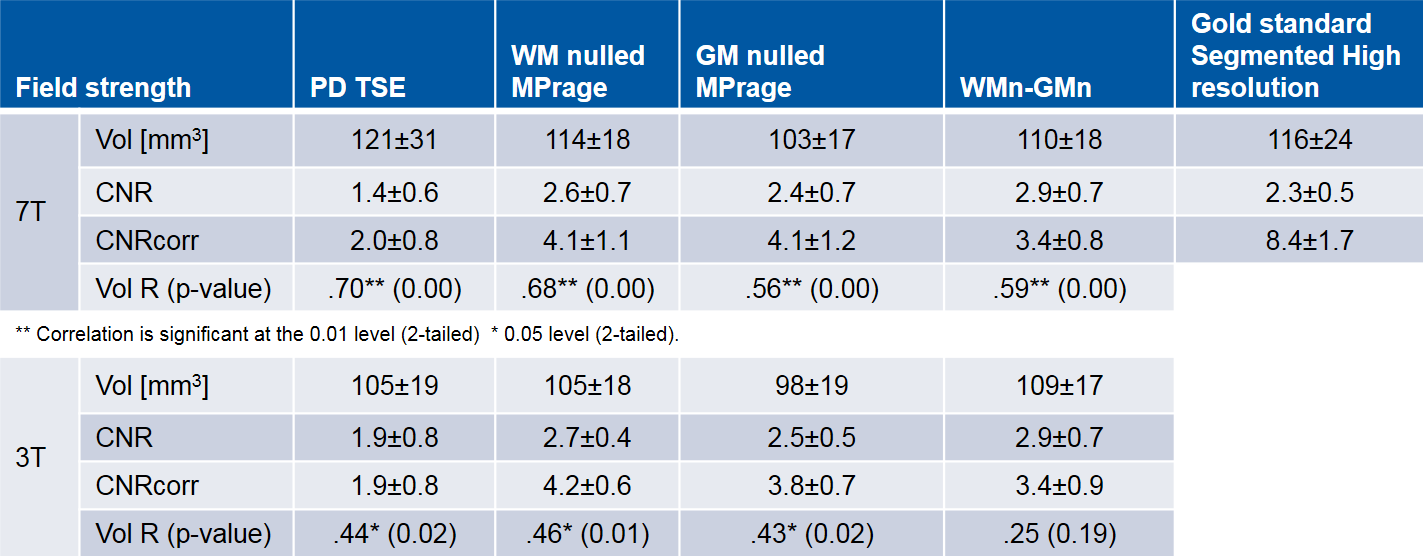
Table1: LGN Volume, CNR, and correlation with gold standard. The mean and standard deviation over the subjects (as population sample) of LGN Volume and CNR (corrected rel. to PD scan for resolution and TA) was calculate together with the Pearson’s correlation coefficient R and the two-tailed test of significance (p) for each “clinical” acquisition method (as dependent variable) and field strength, using SPSS Statistics (IBM).