0698
Segmentation of the Human Nucleus Accumbens Using High-Resolution Diffusion Tractography1Stanford University, Palo Alto, CA, United States
Synopsis
Tractography-based parcellation of the Nucleus Accumbens (NAc) was performed using high-resolution diffusion data from the Human Connectome Project. Analysis of clustering indicated the NAc was best separated into 2 subregions, consistent with anatomical and histological studies of animals. Output of the procedure gave qualitatively similar results across subjects, producing clusters that tended to occupy the ventromedial and dorsolateral portions of the NAc. The ventromedial subregion demonstrated increased task fMRI activation and displayed preferential connections to known biased projection areas such as medial orbitofrontal cortex. Finally, qualitatively similar results were obtained by performing the clustering procedure on a separate, lower-quality dataset.
Purpose
The Nucleus Accumbens (NAc) is a region within the ventral striatum that is strongly associated with reward and motivated behaviors. Histological and anatomical studies in animals and primates indicate that the NAc may be subdivided into at least 2 subregions: a ‘core’ and ‘shell’, which may also have different functional roles1-3. The NAc is a target for deep brain stimulation in the treatment of intractable Obsessive-Compulsive Disorder, but precise targeting of the appropriate subregion with this therapy is not possible as this structure has not been well-delineated4. The current study uses data-driven methods to explore whether diffusion tractography can delineate the core and shell subregions.Methods
Tractography
Multimodal (diffusion, functional, structural) 3T MRI data from 38 subjects were obtained from the publicly available WashU-Minn Human Connectome Project dataset5. FreeSurfer’s automatic parcellation was used to identify cortical and subcortical gray matter ROIs on the T1-weighted (1mm isotropic) images6. After co-registering the ROIs to diffusion space, probabilistic tractography was performed on the 1.25mm isotropic diffusion data (TR/TE=5520/89.5 ms, b=1000, 2000, 3000, 90 diffusion directions each) using each voxel in the NAc mask as a seed and every cortical and subcortical ROI generated from Freesurfer as target7[A1] . Analyses were conducted separately for each hemisphere.
Segmentation
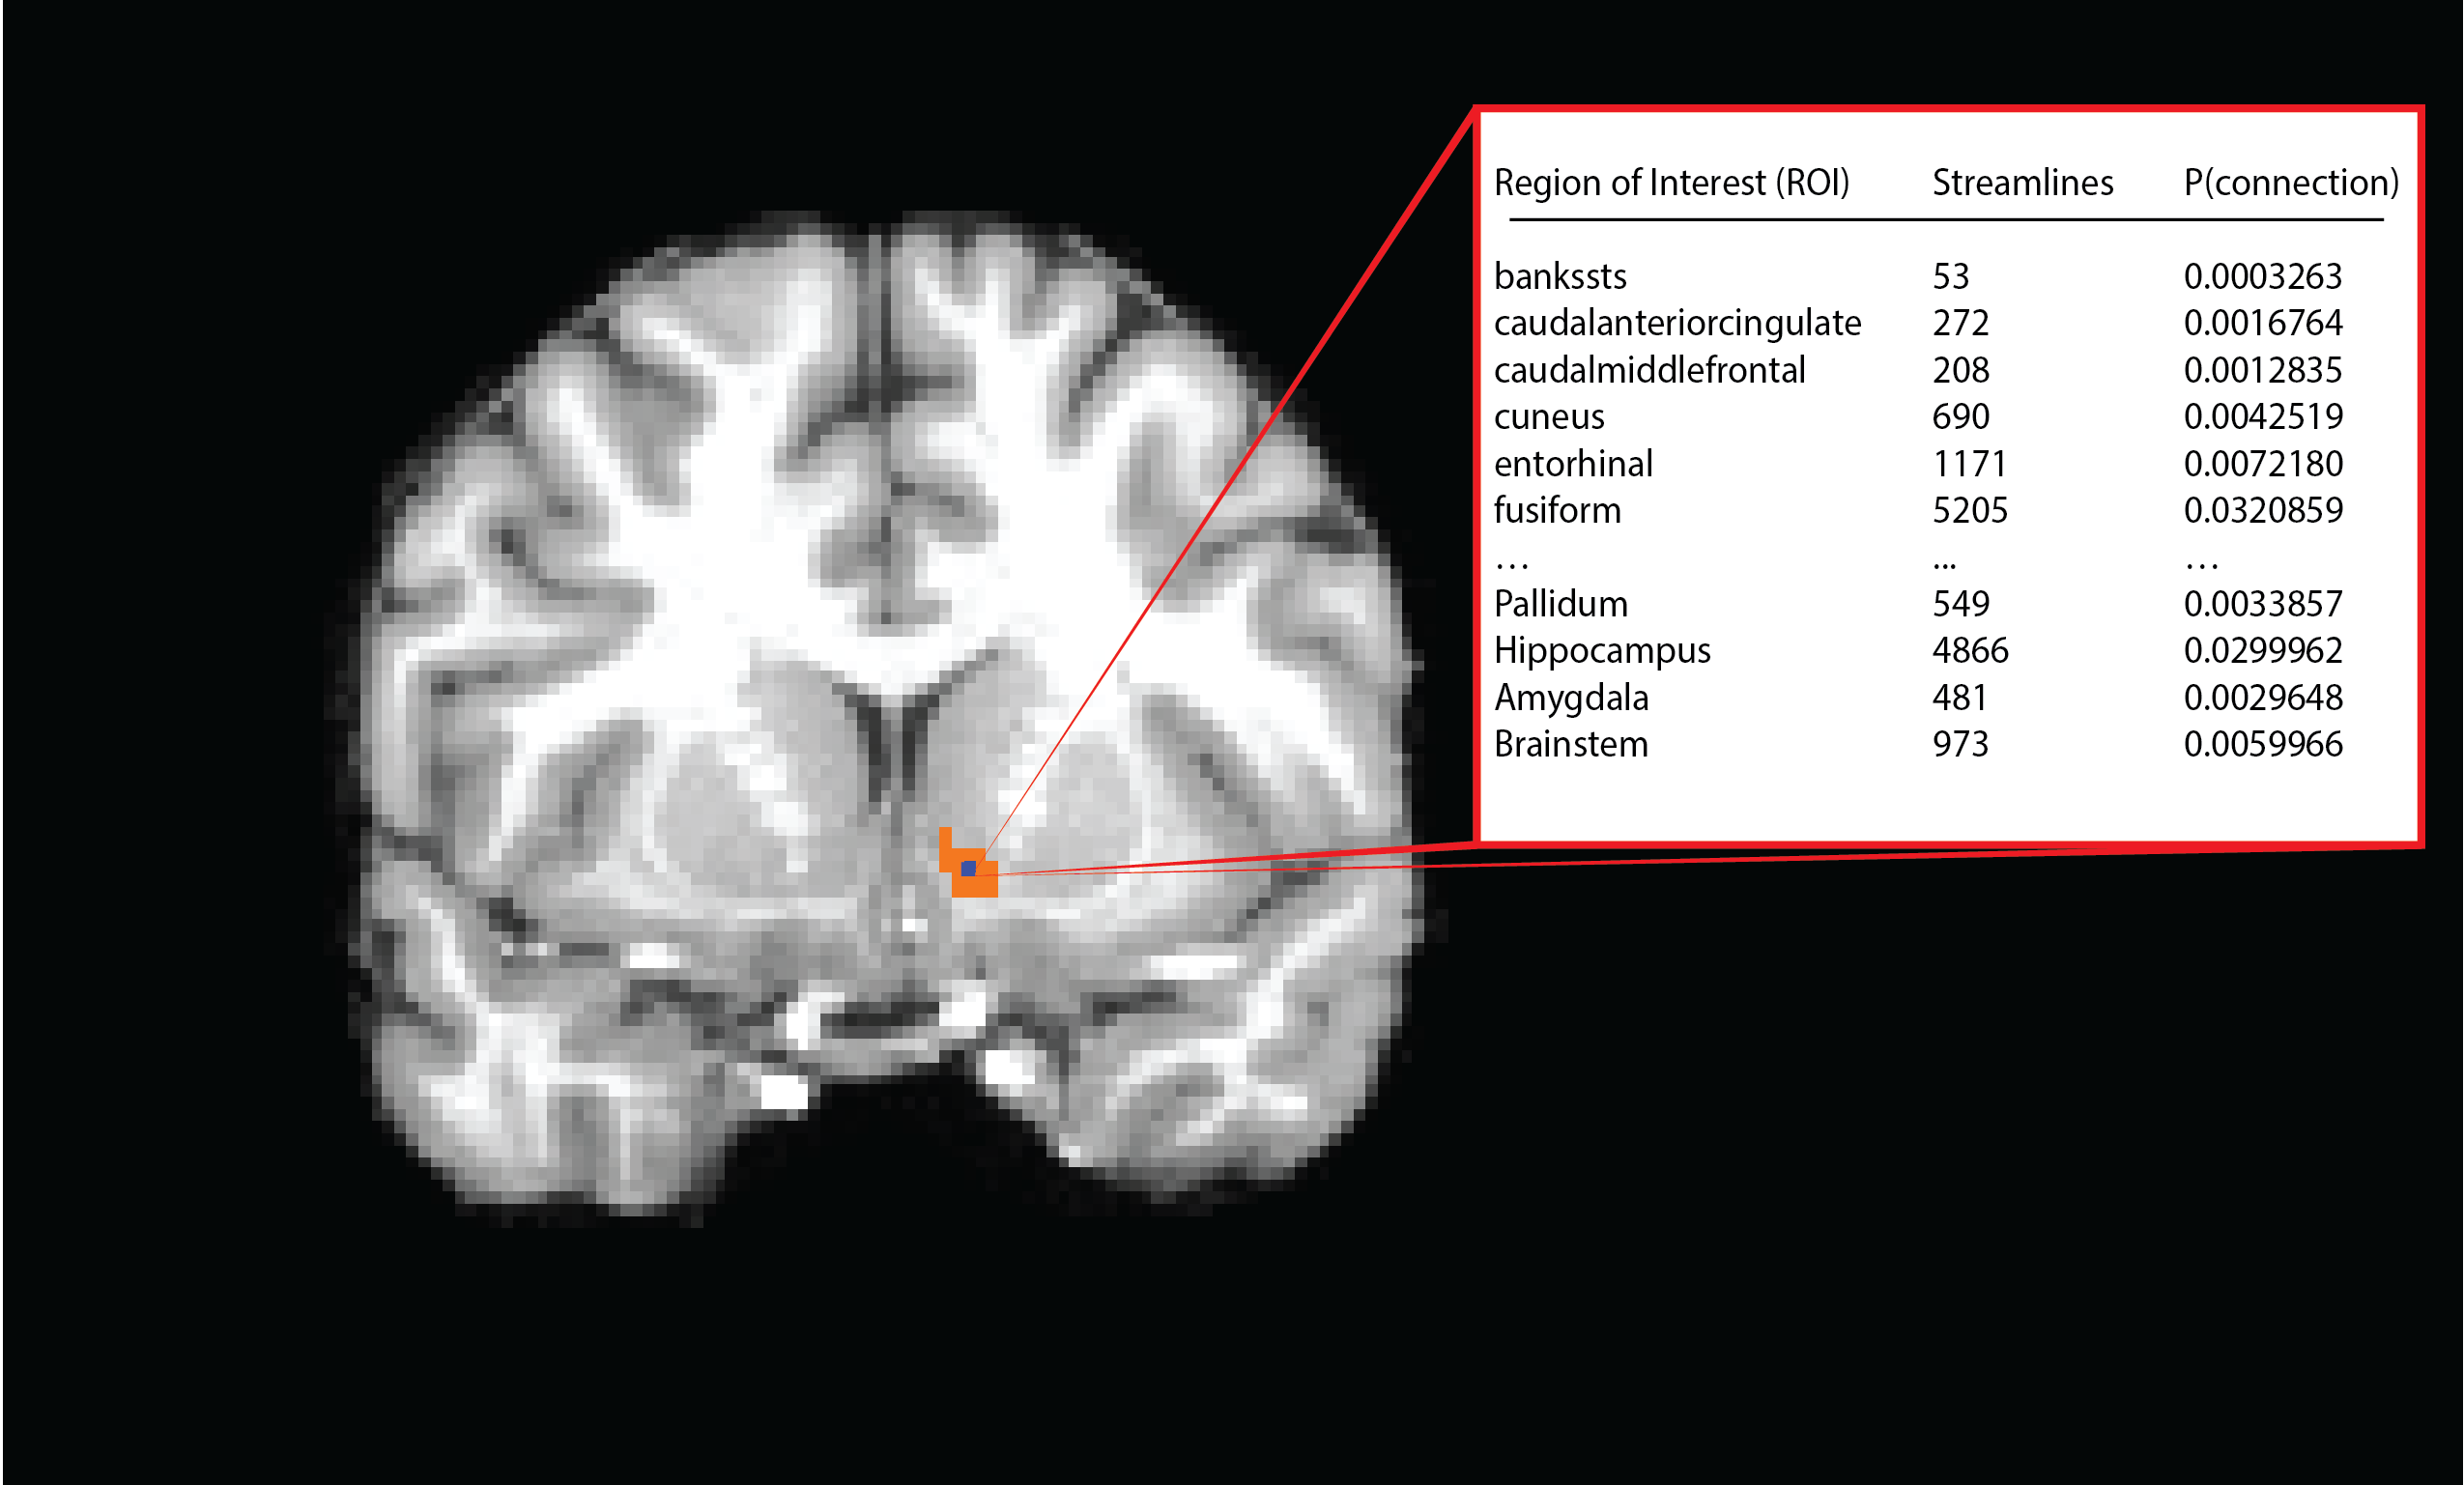
Tractography resulted in an m x n matrix for each subject for each hemisphere, where m is equal to the number of voxels in the NAc mask, and n is equal to the number of Freesurfer gray-matter ROI’s (42). The value of cell (i,j) thus is equal to the number of streamlines originating in voxel i and intersecting or terminating in the jth gray-matter ROI. A distance correction was implemented whereby the number of streamlines from seed to target was multiplied by the Euclidean distance between the seed voxel and centroid of the ROI. The number of streamlines was then converted to the proportion of the total number of streamlines originating from the seed voxel that reach each target. Subjects’ data were then concatenated into an (m x p) x n matrix, where p is the number of subjects. K-means clustering was performed for several values of k, and several parallel approaches were used to determine the appropriate number of clusters. The relative contribution of each ROI to the segmentation was then assessed by ‘leave-one-out’ k-means clustering, where each ROI’s column was removed from the tractography matrix, resulting in an (m x n) x (p – 1) matrix. The results of the ensuing clustering were then compared to the original assignments, and a percent change was calculated.
Validation
Masks in each subject’s diffusion space were created to reflect the cluster assignments and co-registered with the functional data to compare activity between clusters. To assess whether the segmentation procedure was robust across datasets, the same analysis was performed on a separate dataset containing 2 subjects with different acquisition parameters (TR/TE=8404/72.1; 2mm isotropic; b=1000, 60 directions; b=2500, 80 directions).
Results
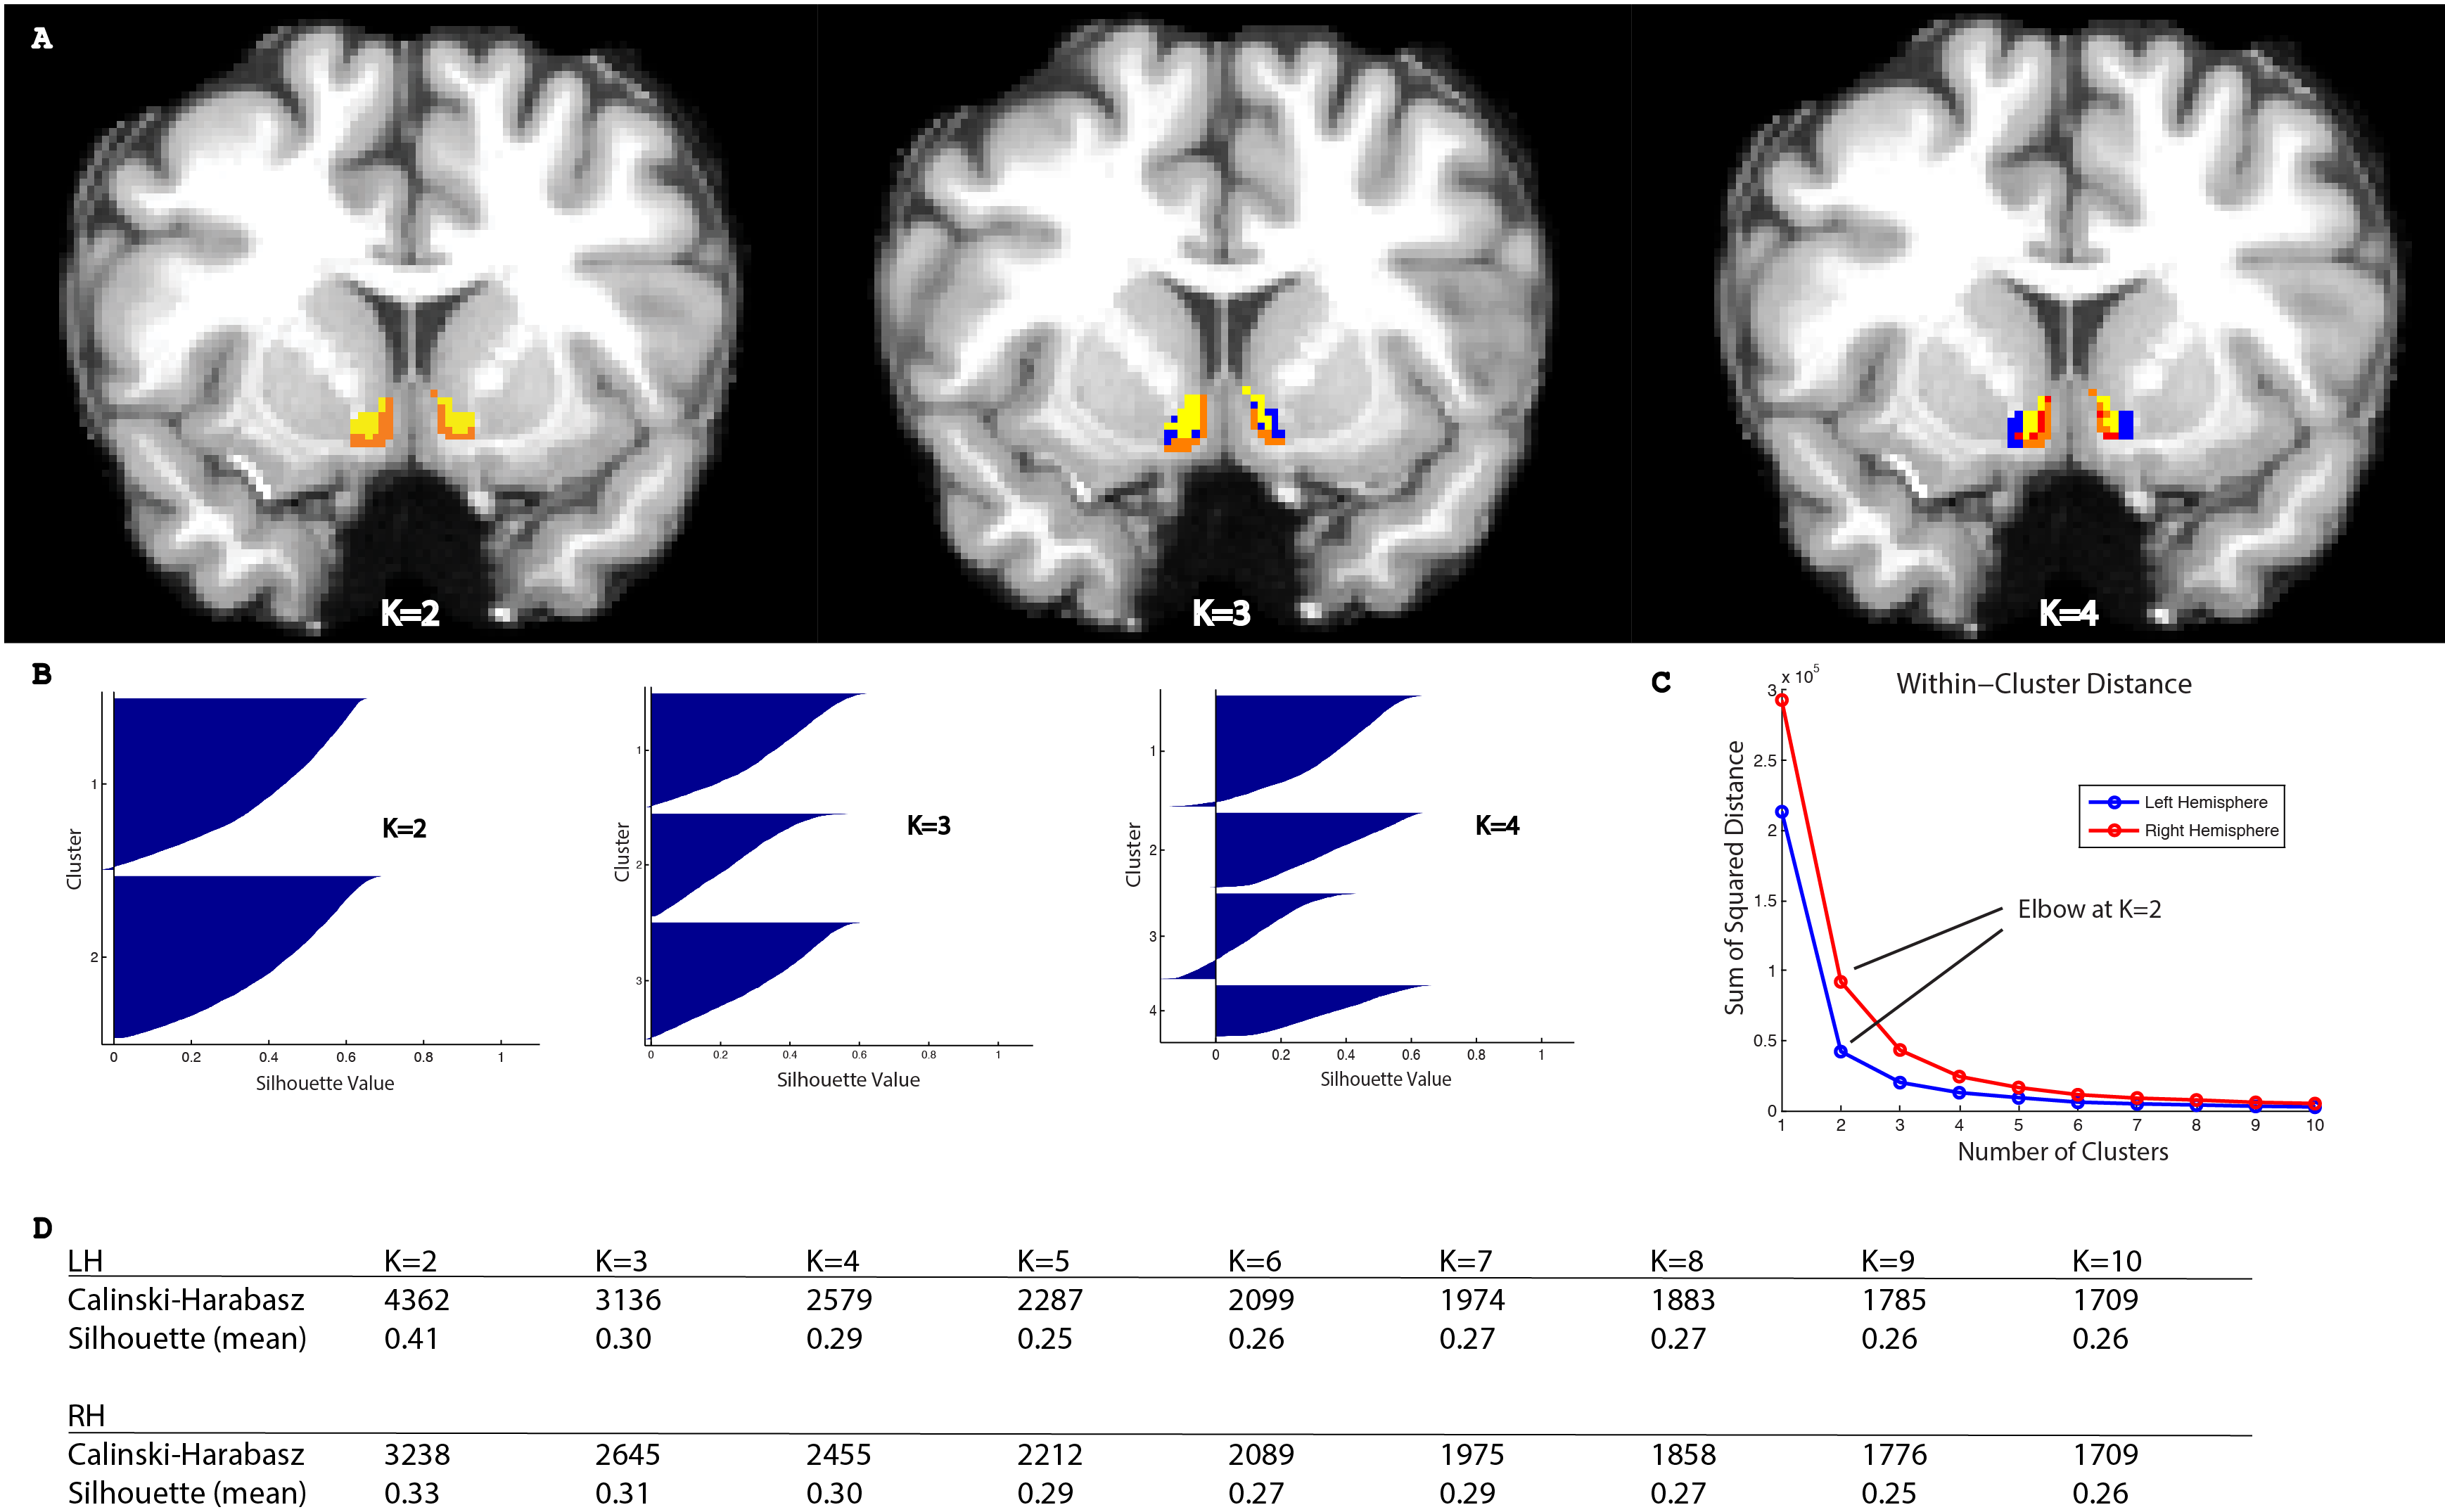
Different approaches to determining the appropriate number of clusters, including the Calinski-Harabasz criterion, Silhouette width, and ‘Elbow’ method gave convergent answers at an optimal k=2 (Figure 2).
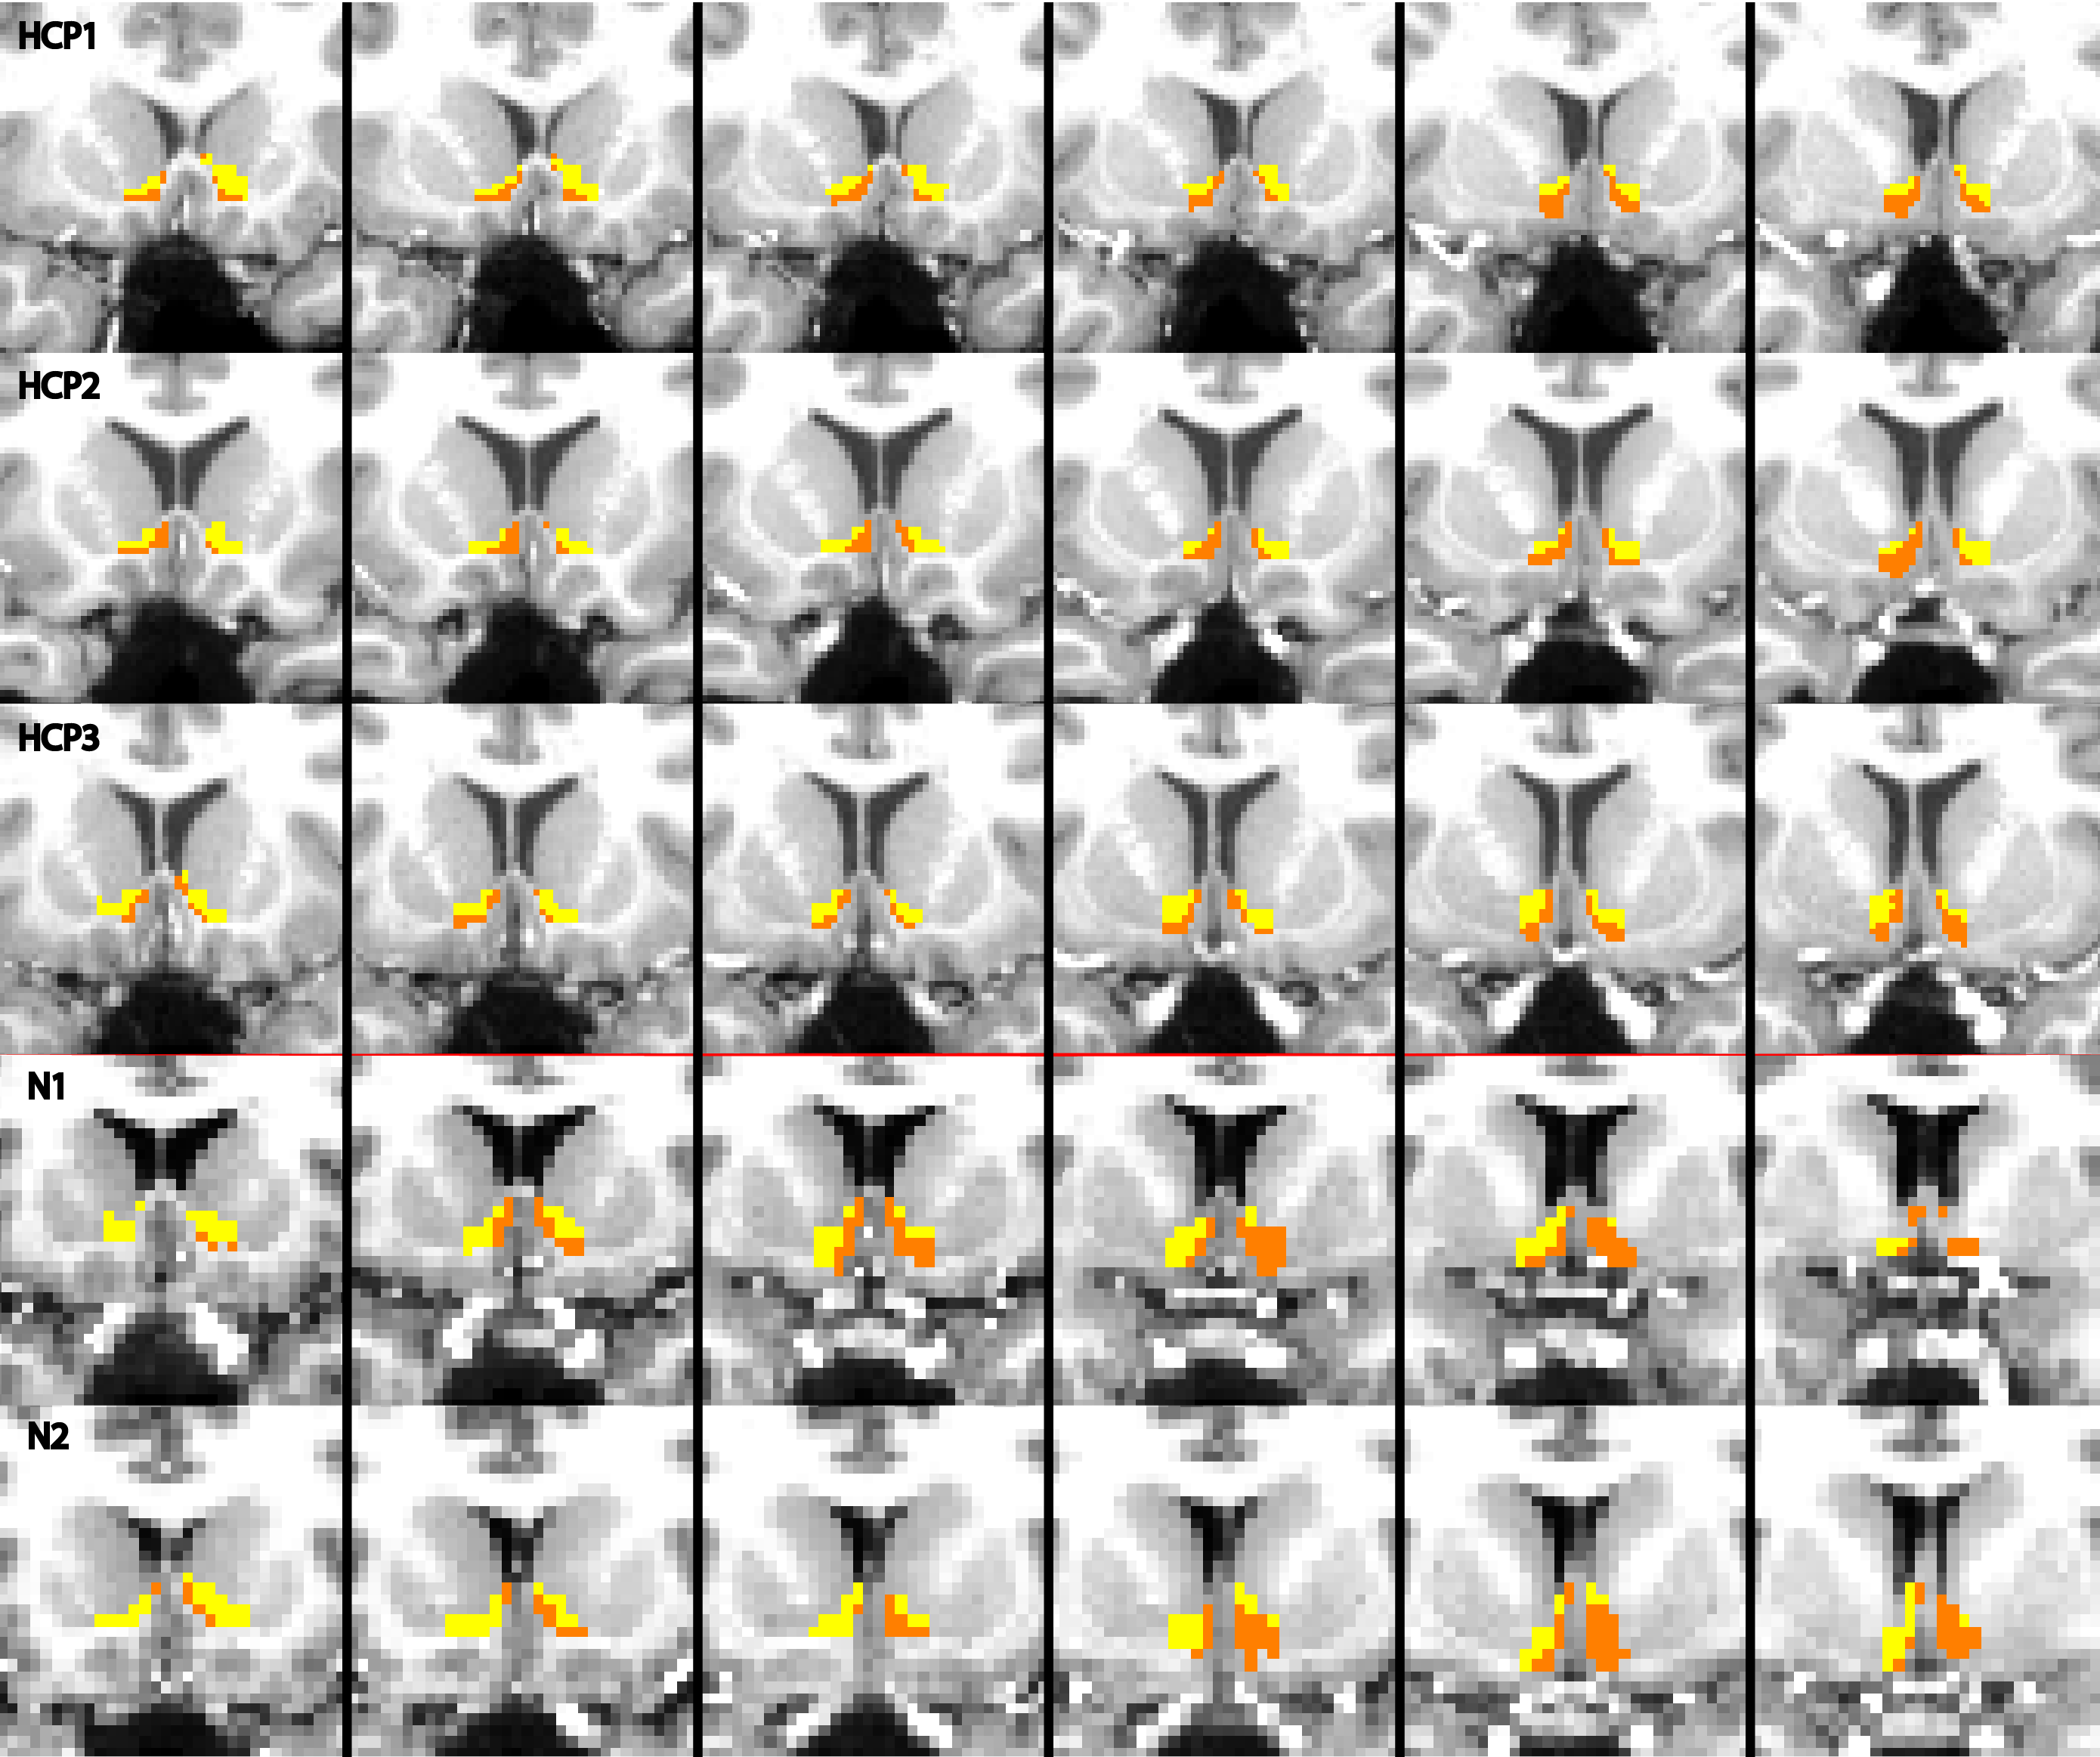
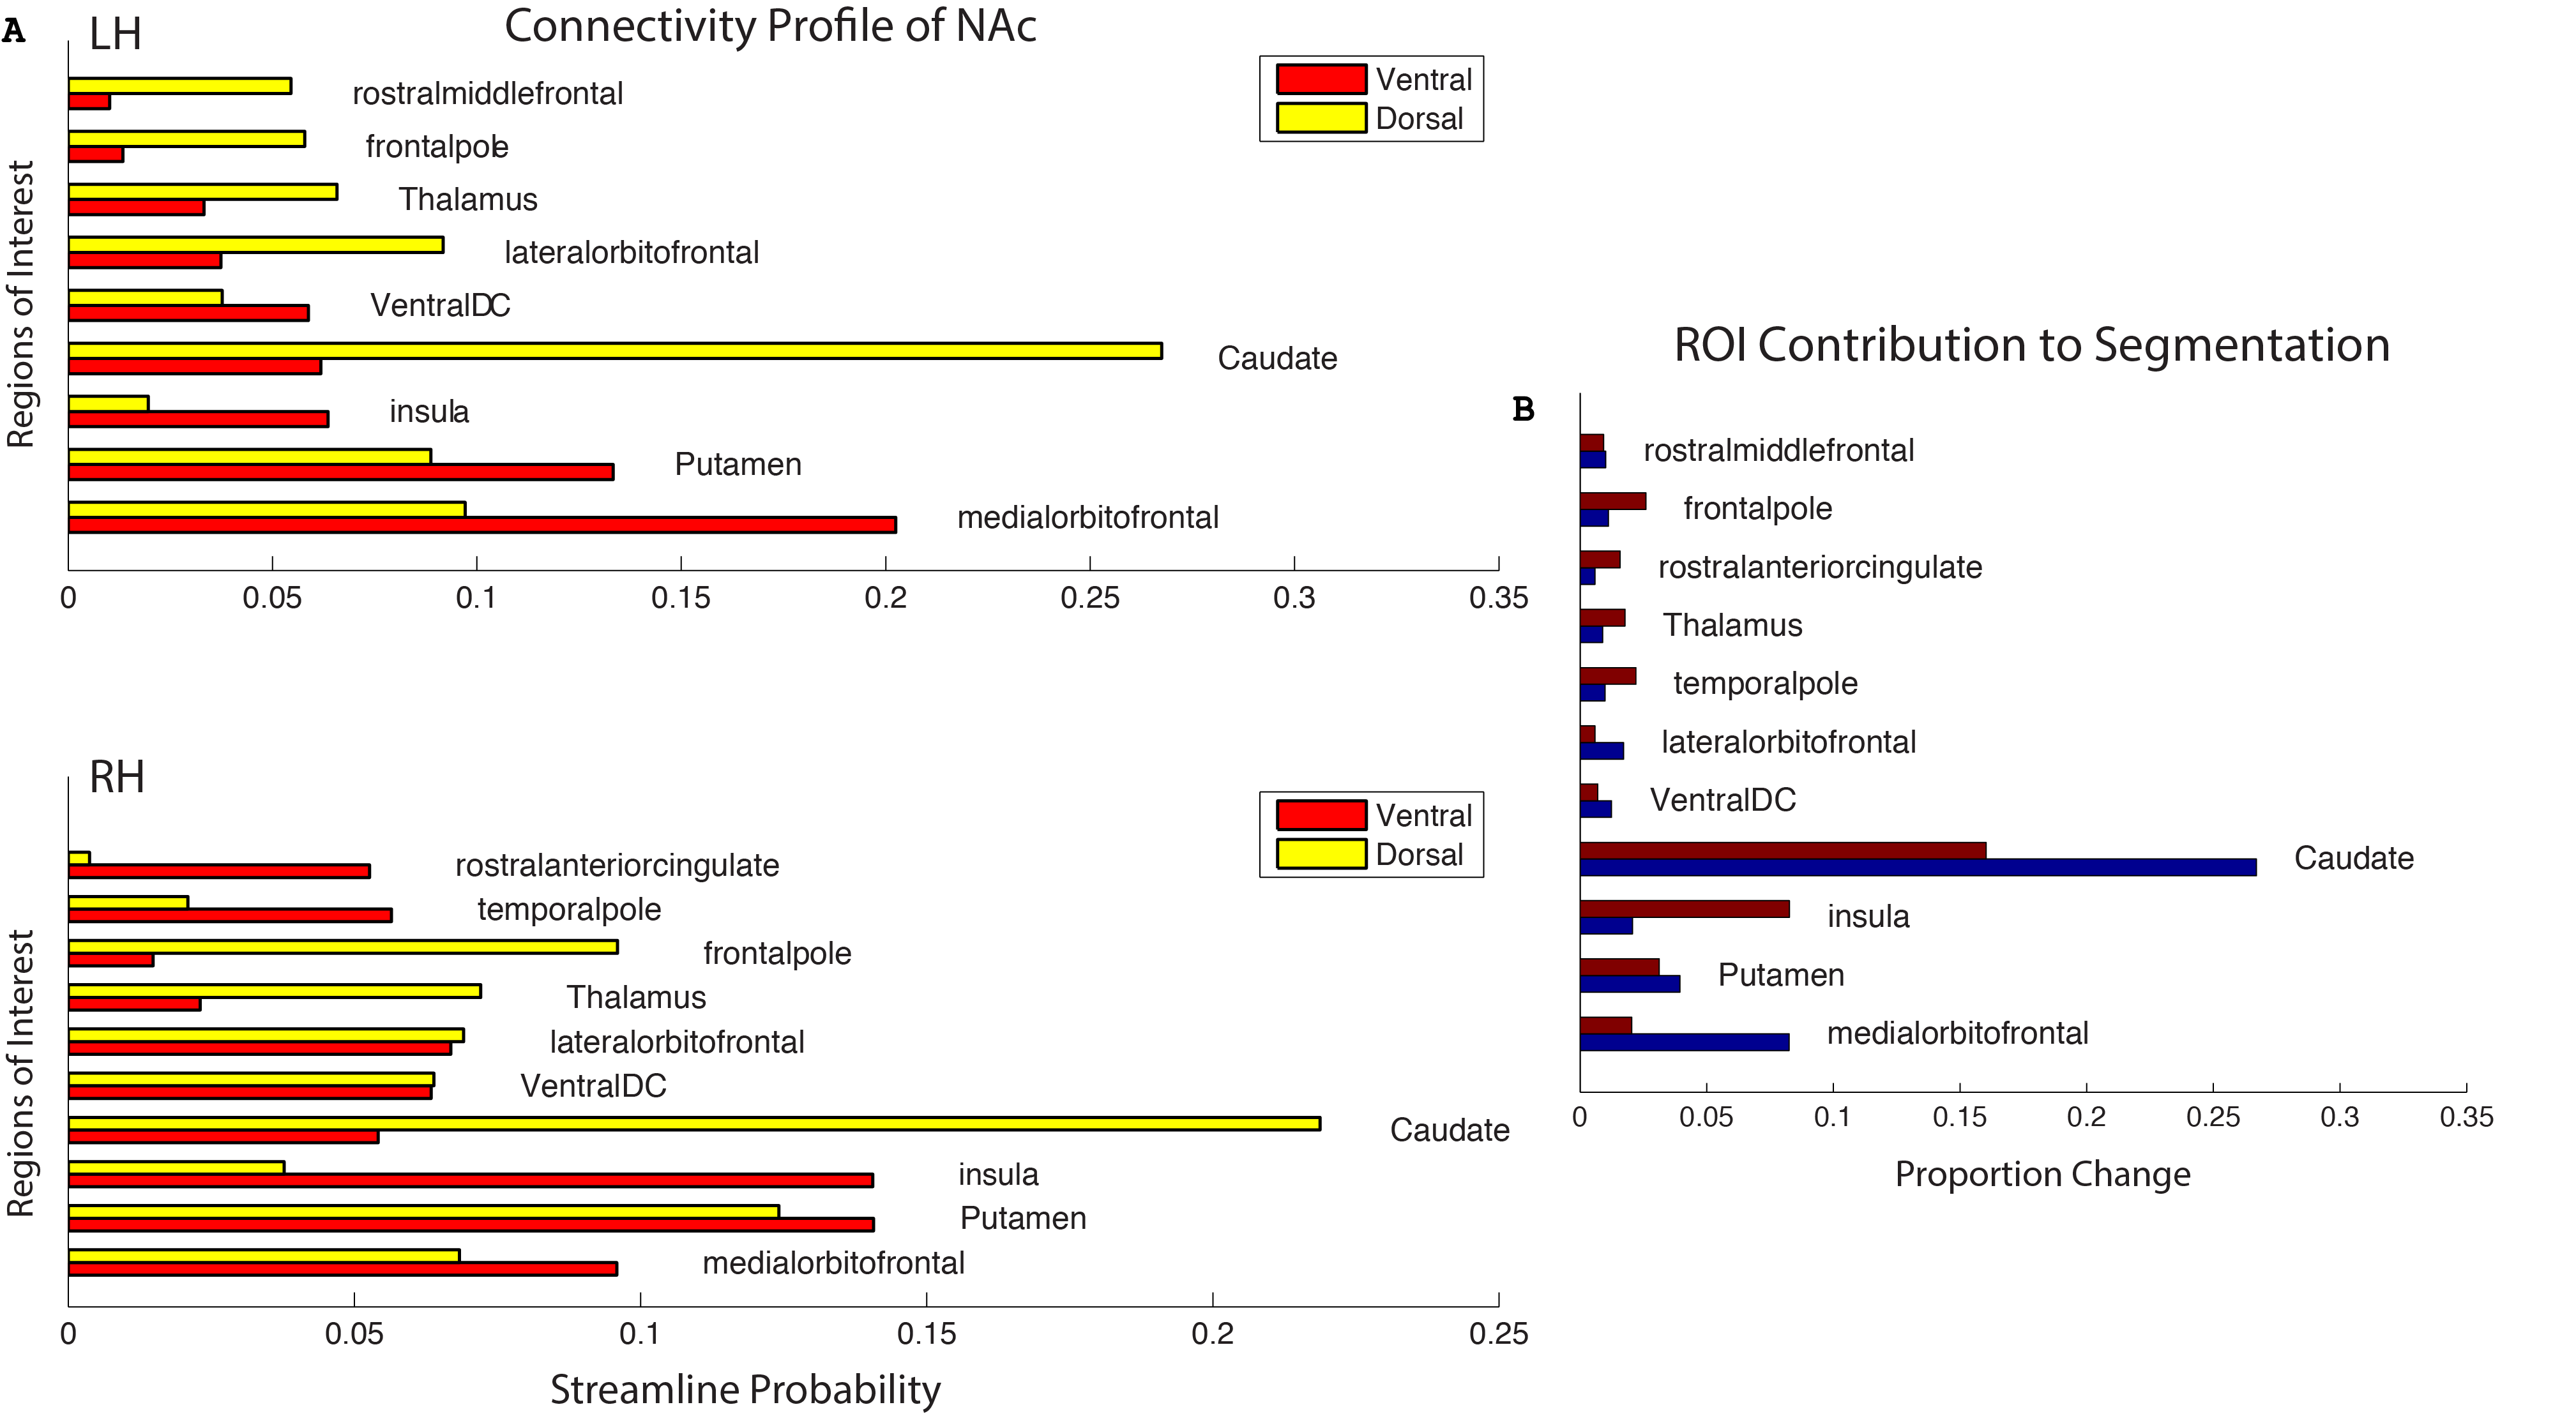
The output of the clustering procedure gave qualitatively consistent results across subjects, delineating a ventromedial cluster with connections to the putamen, medial orbitofrontal cortex, and insula, as well as a dorsolateral cluster with connections to the frontal pole, thalamus, and markedly biased connections to the caudate. A ventromedial/dorsolateral organization was also present when the same procedure was applied to a different, lower-quality diffusion dataset (Figure 3).
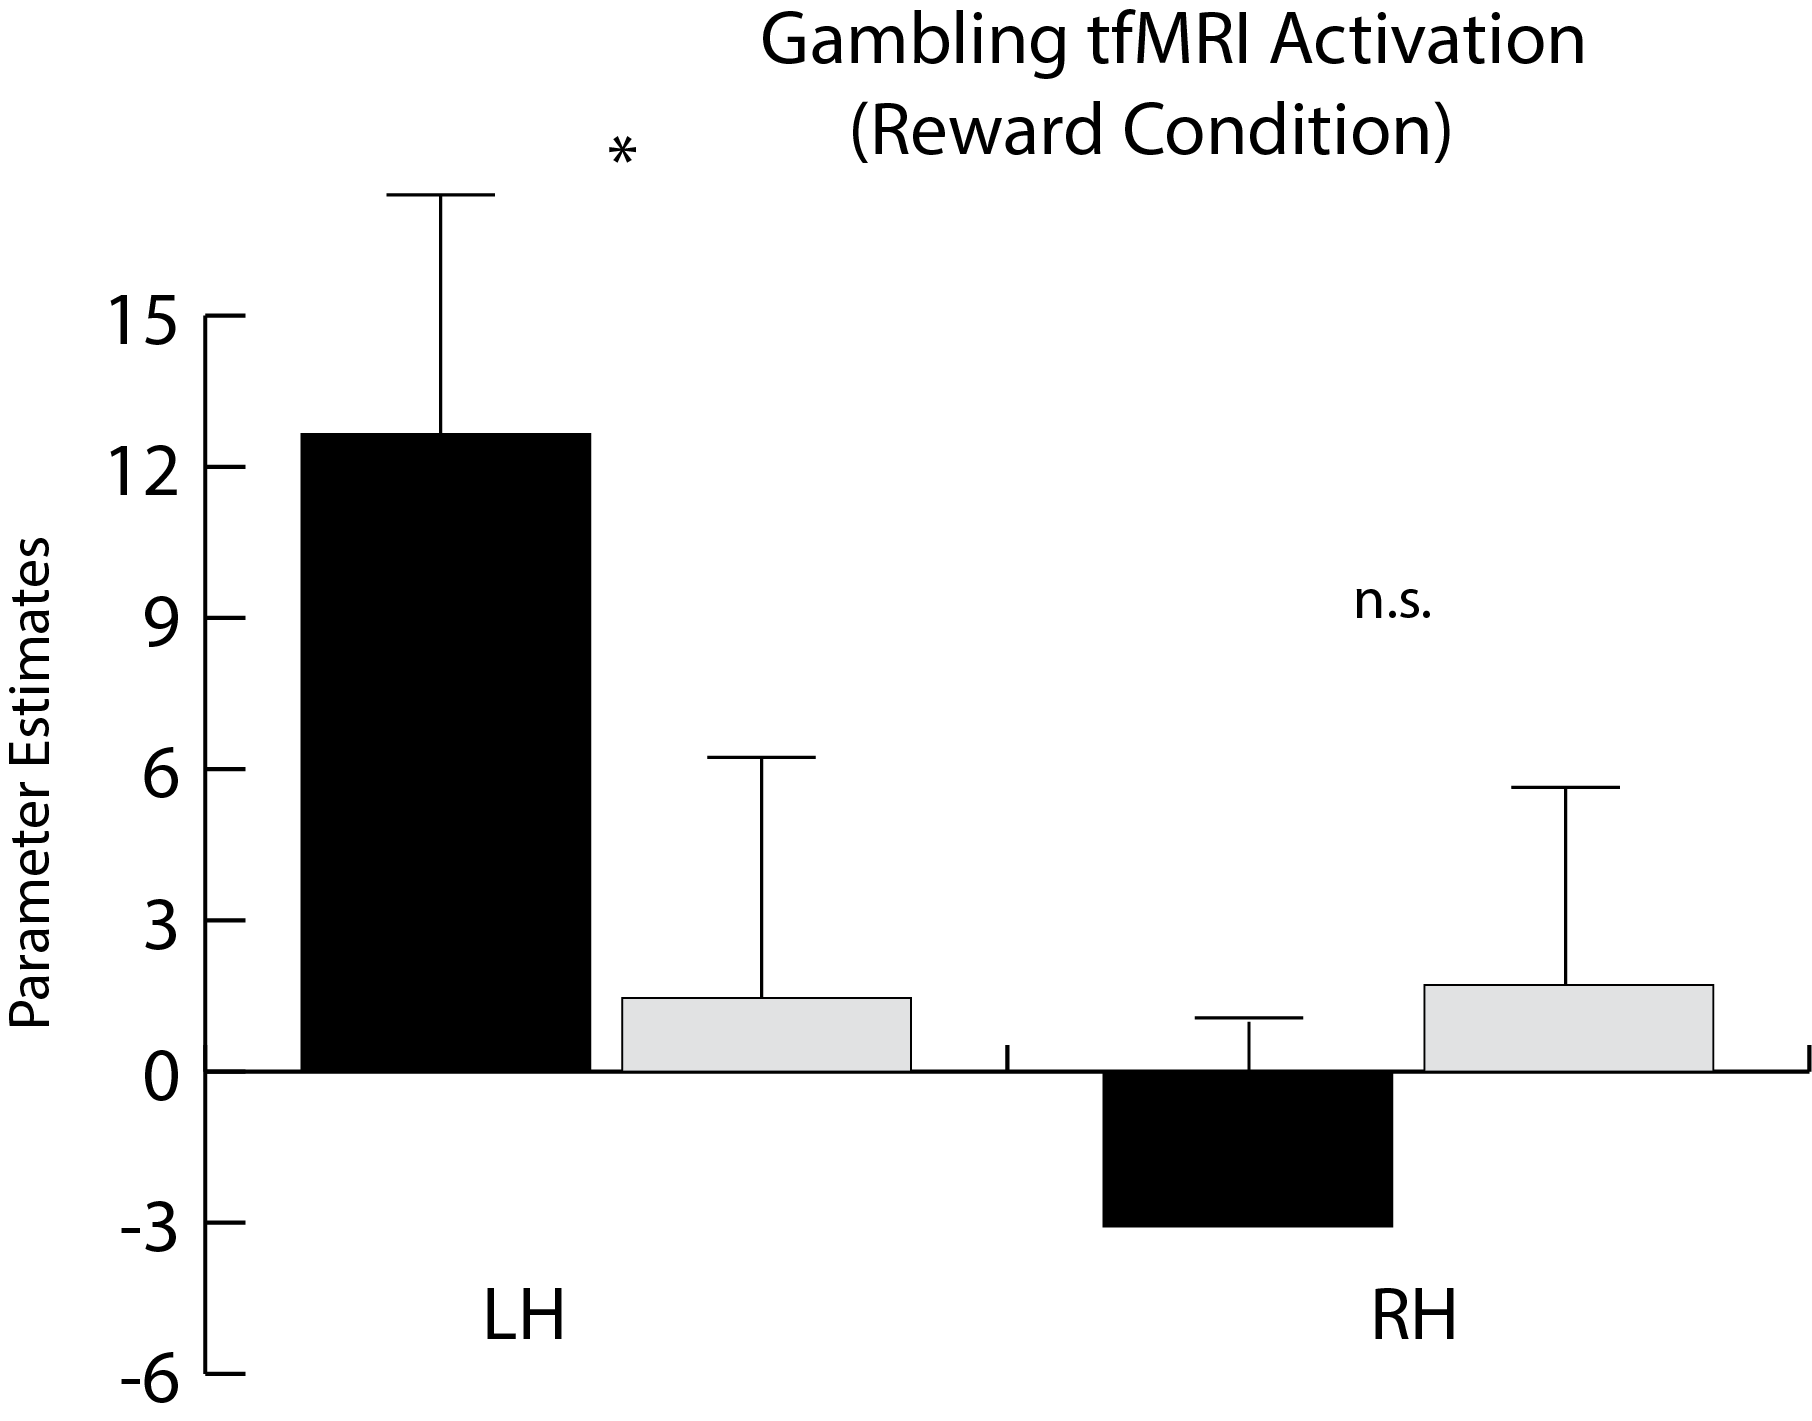
While there is much overlap between each hemisphere’s clustering results, some differences are present. In particular, while reward-related activity measured by task fMRI differed between clusters in the left NAc, no such relationship was observed on the right (Figure 4). In addition, the right NAc-insula connection is notable for its magnitude and degree of bias as compared to the left (Figure 5).
Discussion
Our tractography-based segmentation of the NAc demonstrates two distinct subregions that are consistent across subjects and datasets, and in agreement with prior histology and animal studies. The tractography-based segmentation also corresponds well to functional differences observed by task fMRI.
We also observe some heterogeneity between hemispheres in BOLD signal and structural connectivity profiles. This raises the possibility of subcortical lateralization of structural connections.
Conclusion
Tractography-based clustering of the NAc is a promising approach to discern its subregions, and thus improve the precision of interventions that target this structure, such as deep brain stimulation.Acknowledgements
This work was supported by NIH R01 NS095985, K12NS080223 and Stanford Medical Scholars Fellowship #11836.References
1. Zahm DS. Functional-anatomical Implications of the Nucleus Accumbens Core and Shell Subterritories. Annals of the New York Academy of Sciences. 1999;877(1):113-128.
2. Haber SN, Knutson B. The reward circuit: linking primate anatomy and human imaging. Neuropsychopharmacology : official publication of the American College of Neuropsychopharmacology. 2010;35(1):4-26.
3. Halpern CH, Tekriwal A, Santollo J, et al. Amelioration of binge eating by nucleus accumbens shell deep brain stimulation in mice involves D2 receptor modulation. The Journal of neuroscience : the official journal of the Society for Neuroscience. 2013;33(17):7122-7129.
4. Sturm V, Lenartz D, Koulousakis A, et al. The nucleus accumbens: a target for deep brain stimulation in obsessive–compulsive-and anxiety-disorders. Journal of chemical neuroanatomy. 2003;26(4):293-299.
5. Glasser MF, Sotiropoulos SN, Wilson JA, et al. The minimal preprocessing pipelines for the Human Connectome Project. NeuroImage. 2013;80:105-124.
6. Fischl B. FreeSurfer. NeuroImage. 2012;62(2):774-781.
7. Jenkinson M, Beckmann CF, Behrens TE, Woolrich MW, Smith SM. FSL. NeuroImage. 2012;62(2):782-790.
8. Daianu M, Jahanshad N, Dennis EL, et al. Left versus right hemisphere differences in brain connectivity: 4-Tesla HARDI tractography in 569 twins. Paper presented at: 2012 9th IEEE International Symposium on Biomedical Imaging (ISBI)2012.
9. Baliki MN, Mansour A, Baria AT, et al. Parceling human accumbens into putative core and shell dissociates encoding of values for reward and pain. The Journal of Neuroscience. 2013;33(41):16383-16393.
10. Rousseeuw PJ. Silhouettes: A graphical aid to the interpretation and validation of cluster analysis. Journal of Computational and Applied Mathematics. 1987;20:53-65.
11. Calinski T, Harabasz J. A dendrite method for cluster analysis. Communications in Statistics-theory and Methods. 1974;3(1):1-27.
12. Barch DM, Burgess GC, Harms MP, et al. Function in the human connectome: task-fMRI and individual differences in behavior. NeuroImage. 2013;80:169-189.
Figures