0697
Unfolded hippocampal coordinate system for quantitative mapping and subfield segmentation1Brain and Mind Institute, Western University, London, ON, Canada, 2Robarts Research Institute, Western University, London, ON, Canada
Synopsis
This work presents a novel computational technique for unfolding the hippocampus, providing a smooth and consistent mapping from native 3D space to a common coordinate system that is intrinsically defined by hippocampal anatomy. This coordinate system allows for laminar-based sampling of quantitative volumetric data and a means to pool data across subjects without additional registration or warping. We demonstrate the value of this technique with data from a set of healthy young participants scanned at 7T, taking advantage of high-resolution isotropic imaging for visualizing intra-hippocampal features, and employ a single surgical patient case with histology for validation.
Introduction
Imaging the subfields of the hippocampus has been of great interest, but is difficult because of it’s complex folded structural organization, and our current inability to distinguish subfield boundaries based on signal intensity. Manual and automated segmentation protocols for subfield segmentation are commonly used, but there are unique challenges in segmenting the anterior part (i.e. hippocampal head including uncus), where a more complex folding pattern and variability in digitations are present1. Unfolding techniques have been applied to the neocortex for some time now to provide flat maps for functional mapping. However, previous work on unfolding the mesial temporal lobe cortex has been limited2, and did not consider the complex anatomy in the hippocampal head. Here, we present a novel computational technique for unfolding the hippocampus, providing a smooth and consistent mapping from native 3D space to a common coordinate system that is intrinsically defined by hippocampal anatomy. This coordinate system allows for laminar-based sampling of quantitative volumetric data and a means to pool data across subjects without additional registration or warping. We demonstrate the value of this technique with data from a set of healthy young participants scanned at 7T, taking advantage of high-resolution isotropic imaging for visualizing intra-hippocampal features, and employ a single surgical patient case with histology for validation.Methods
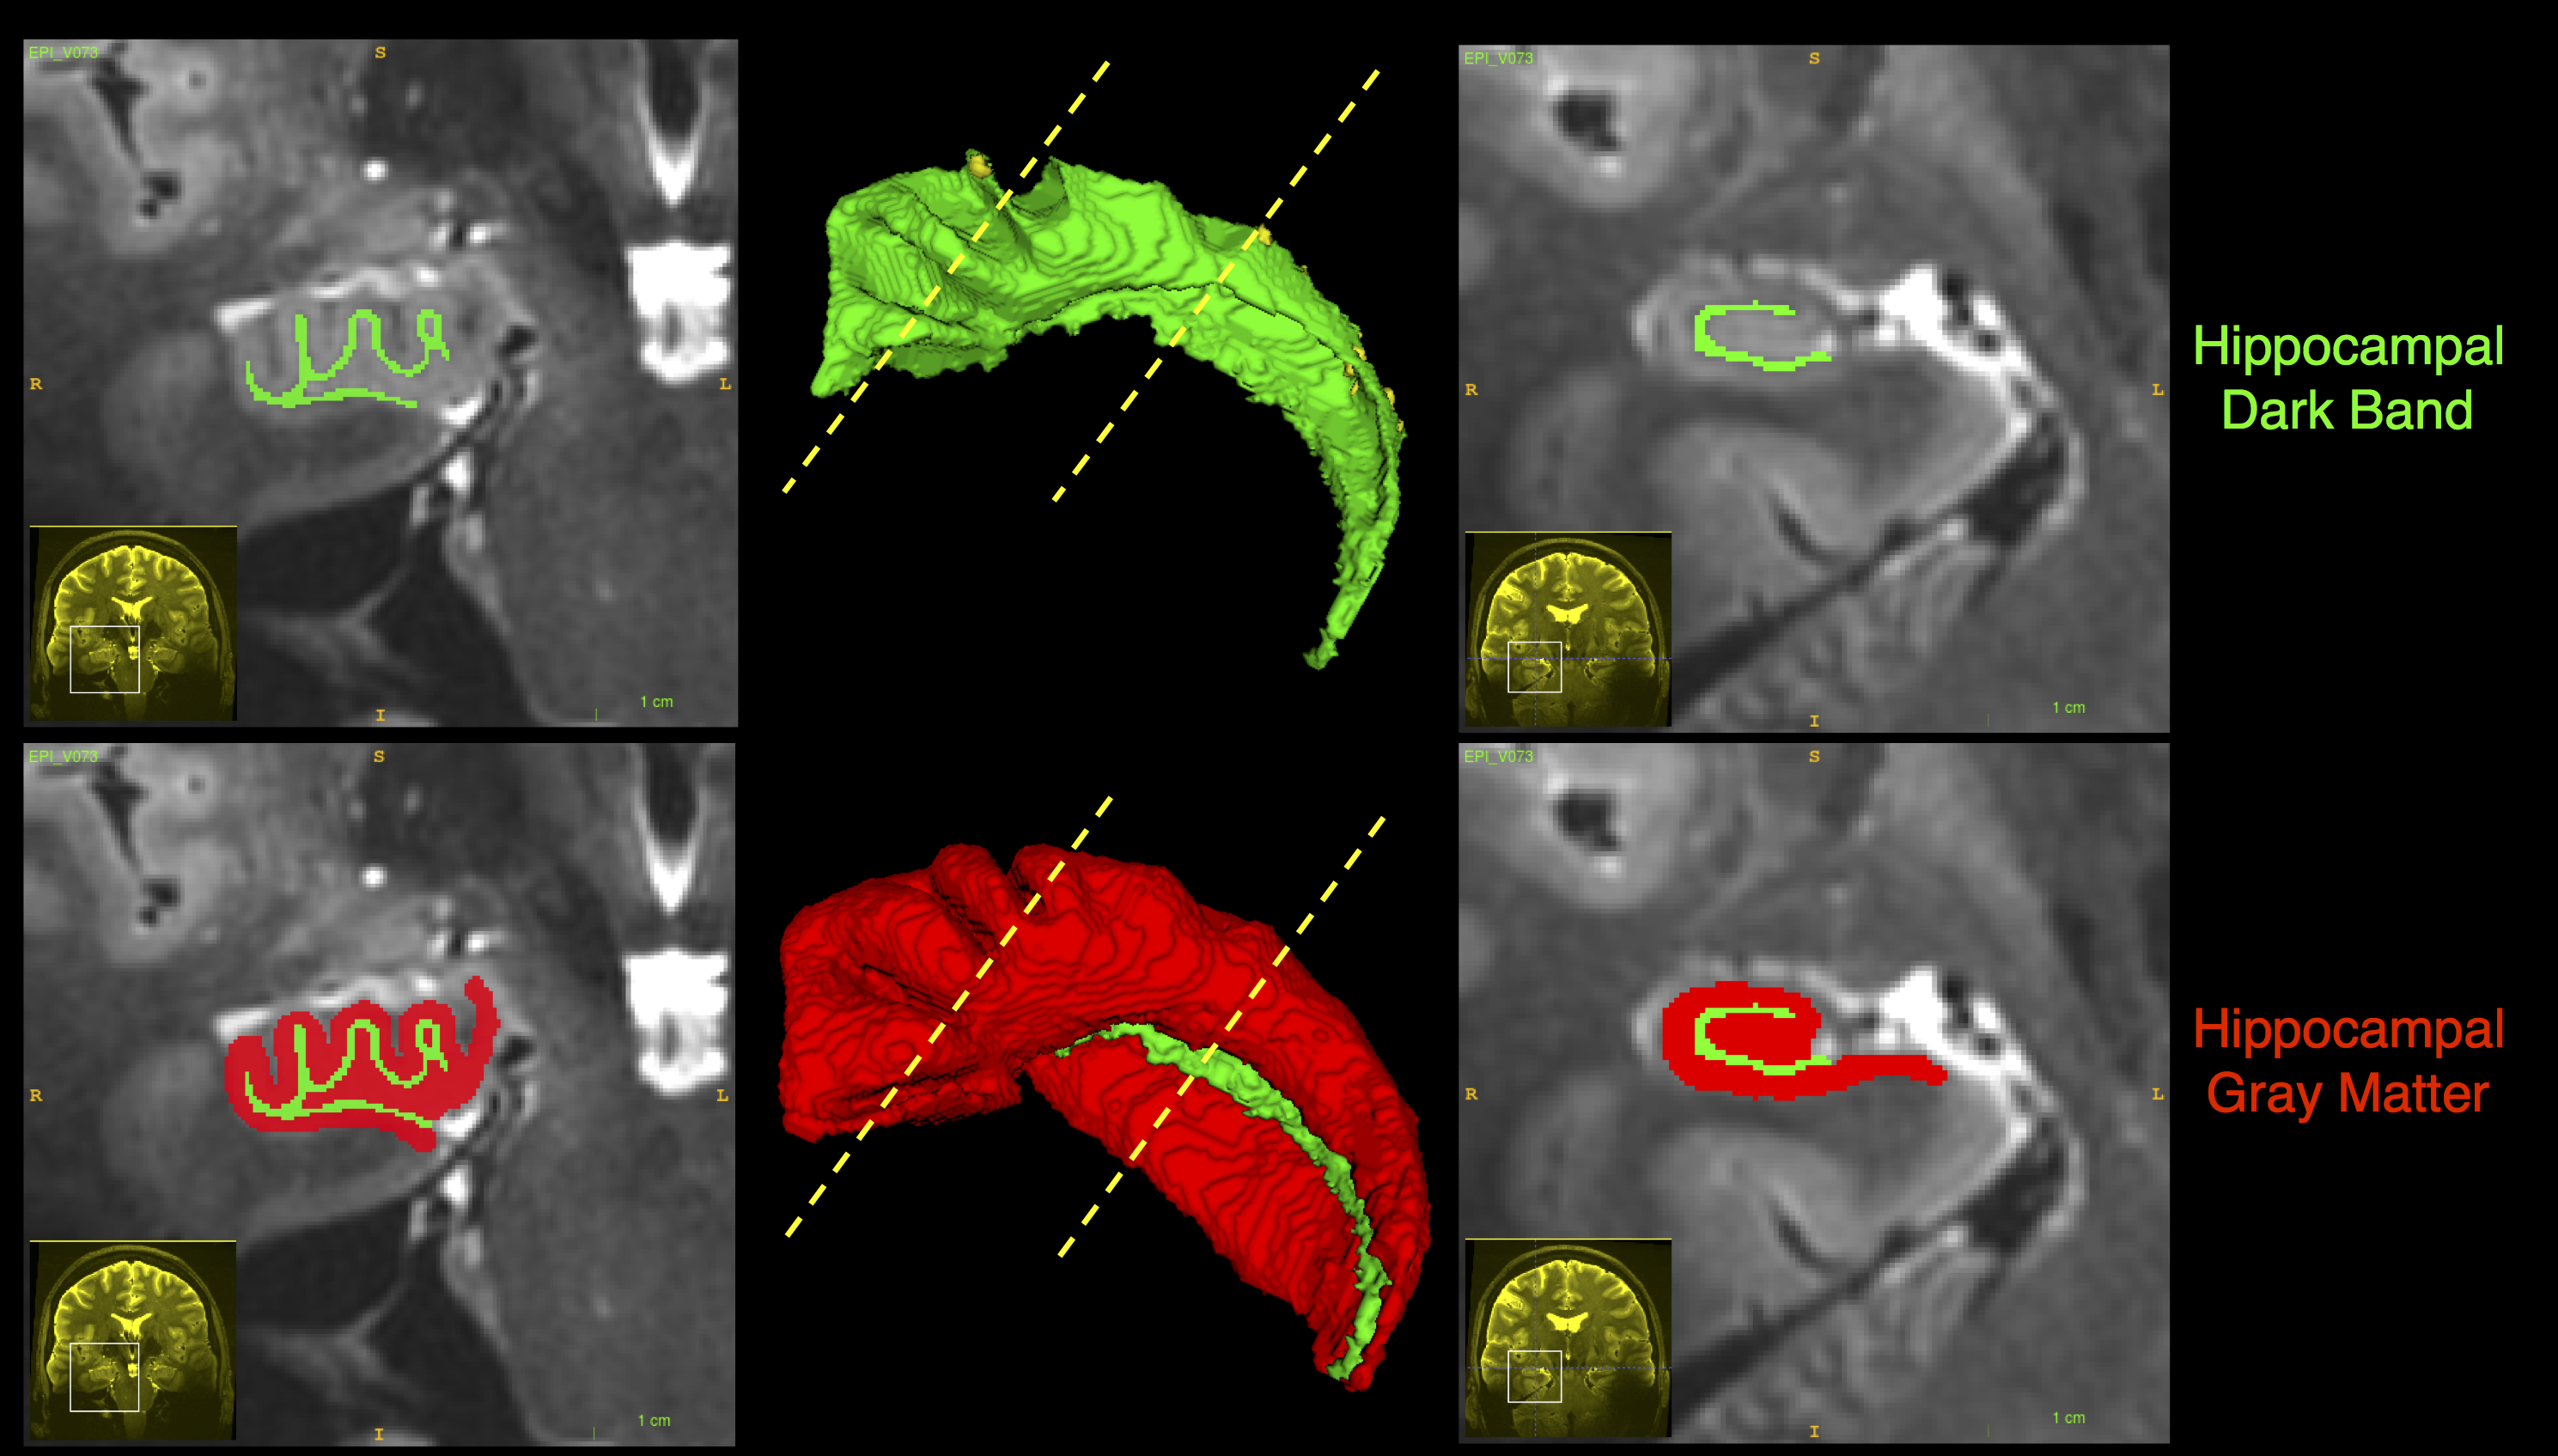
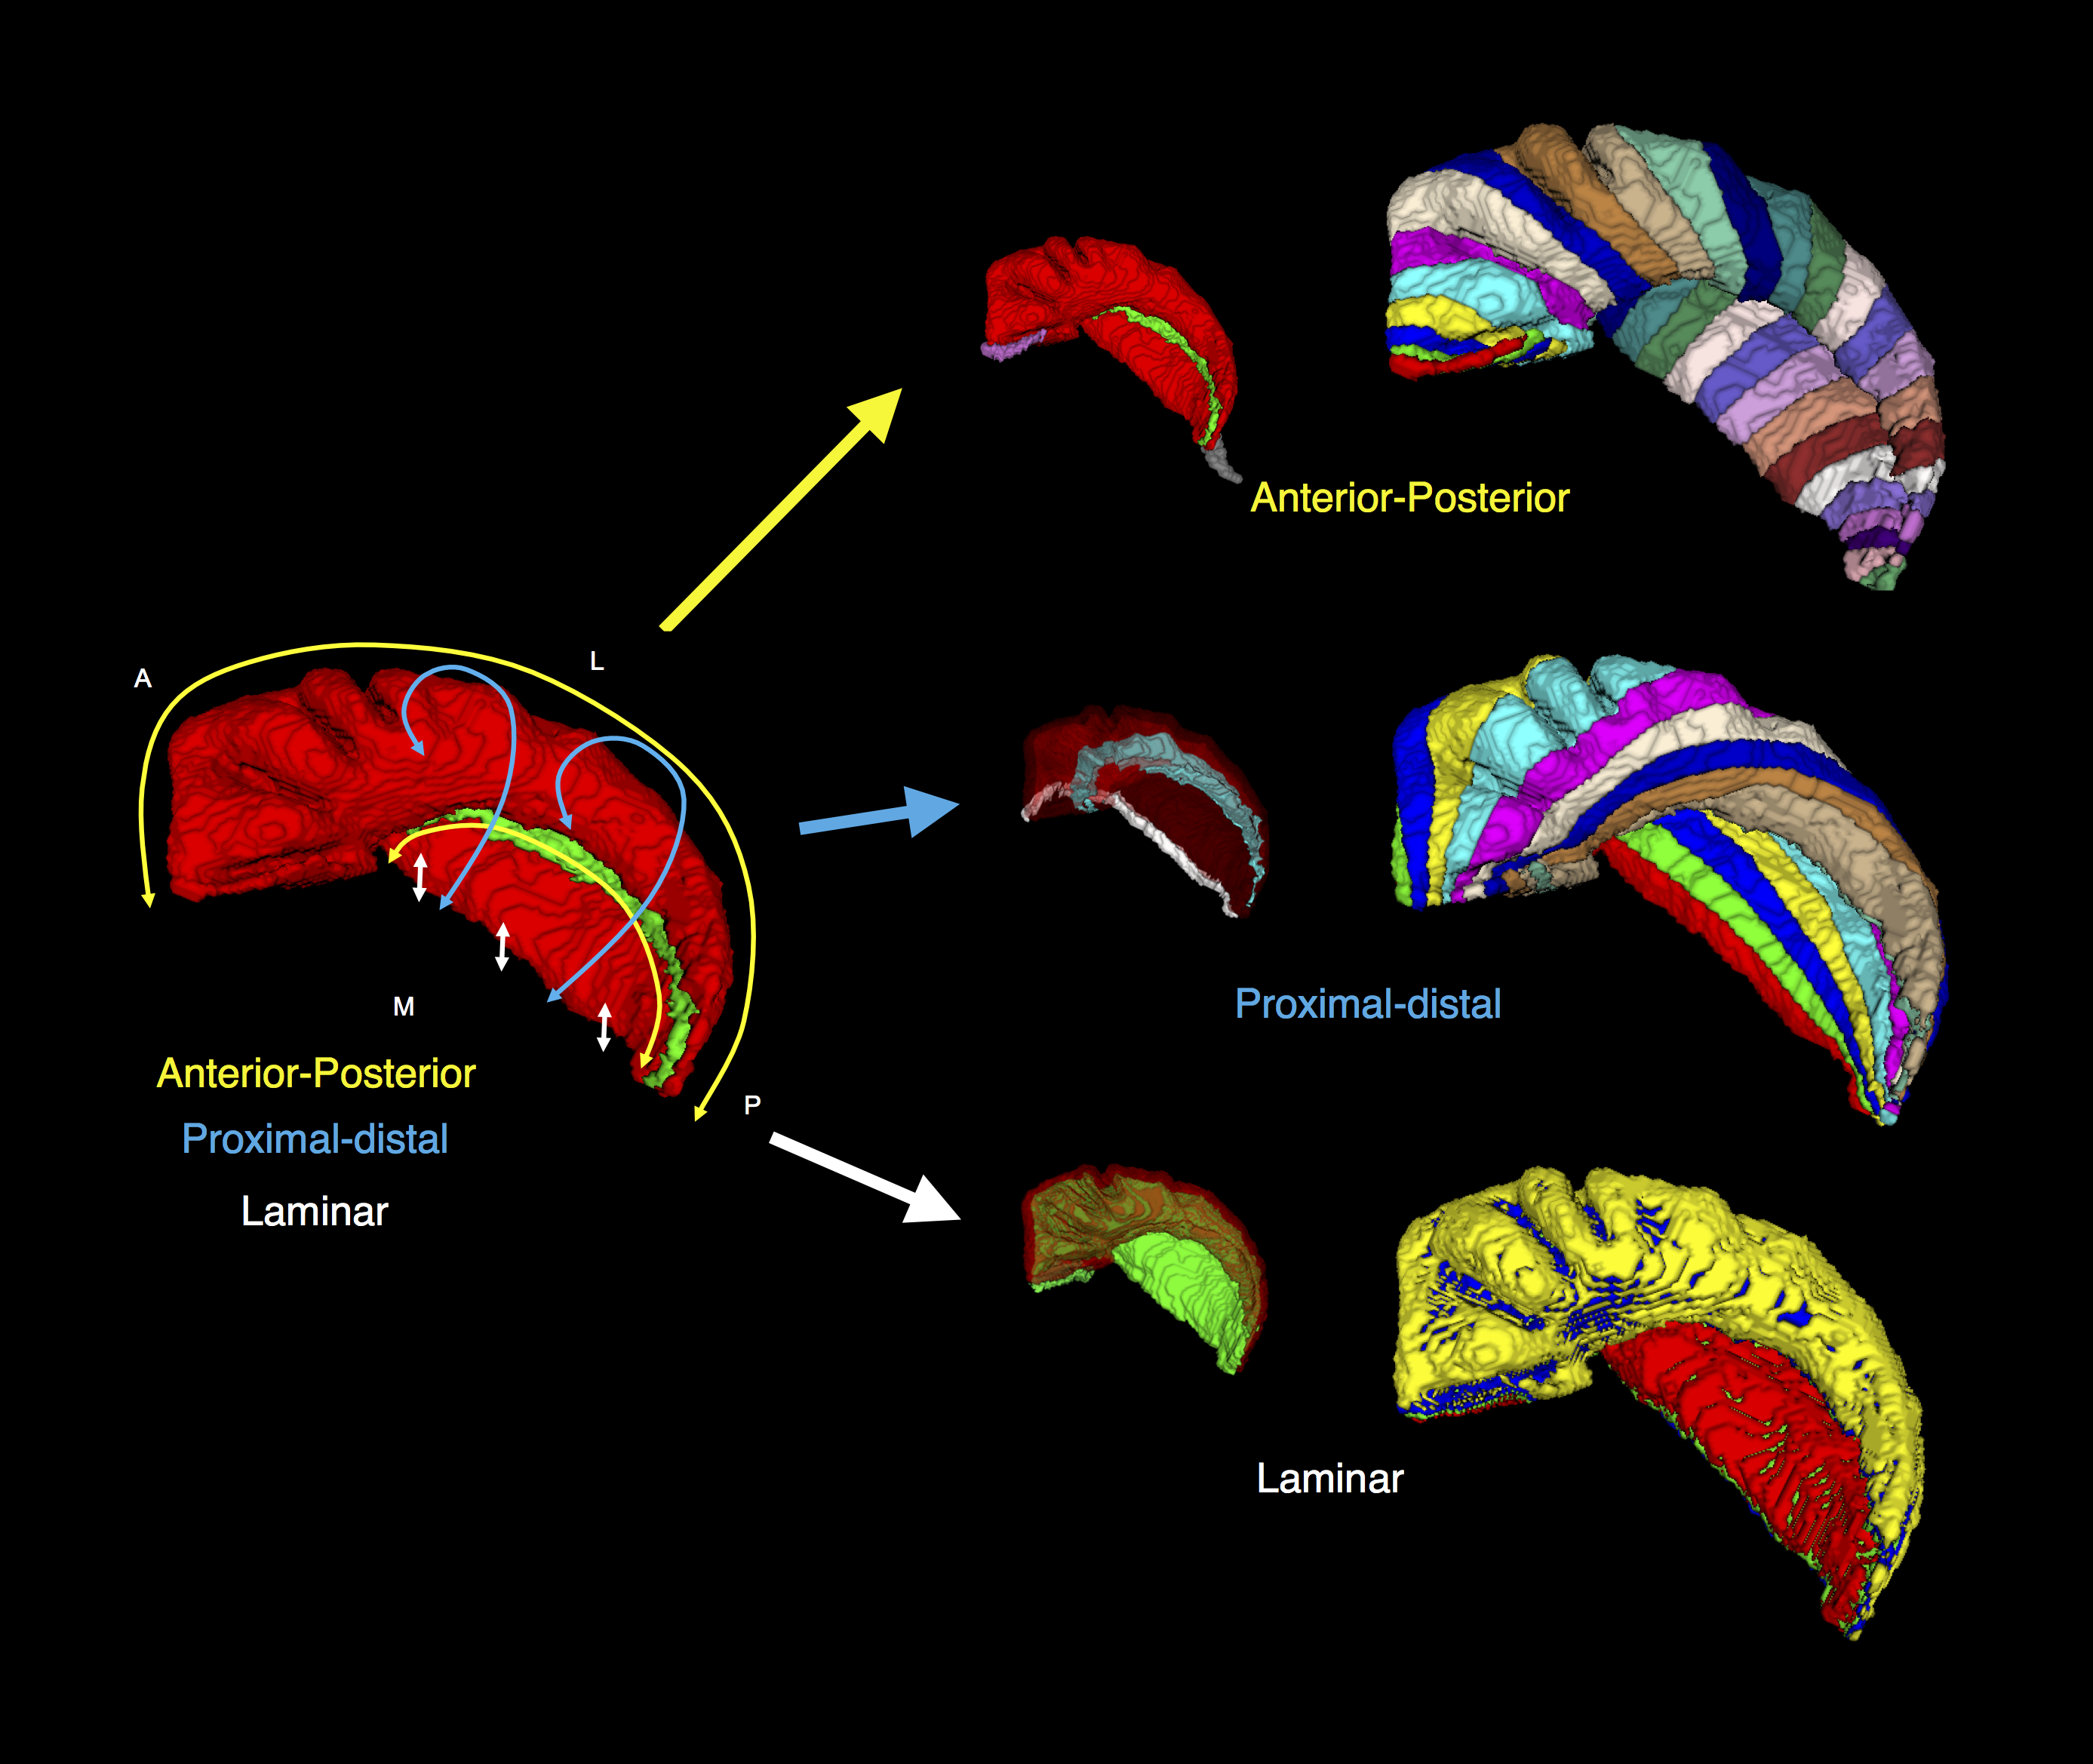
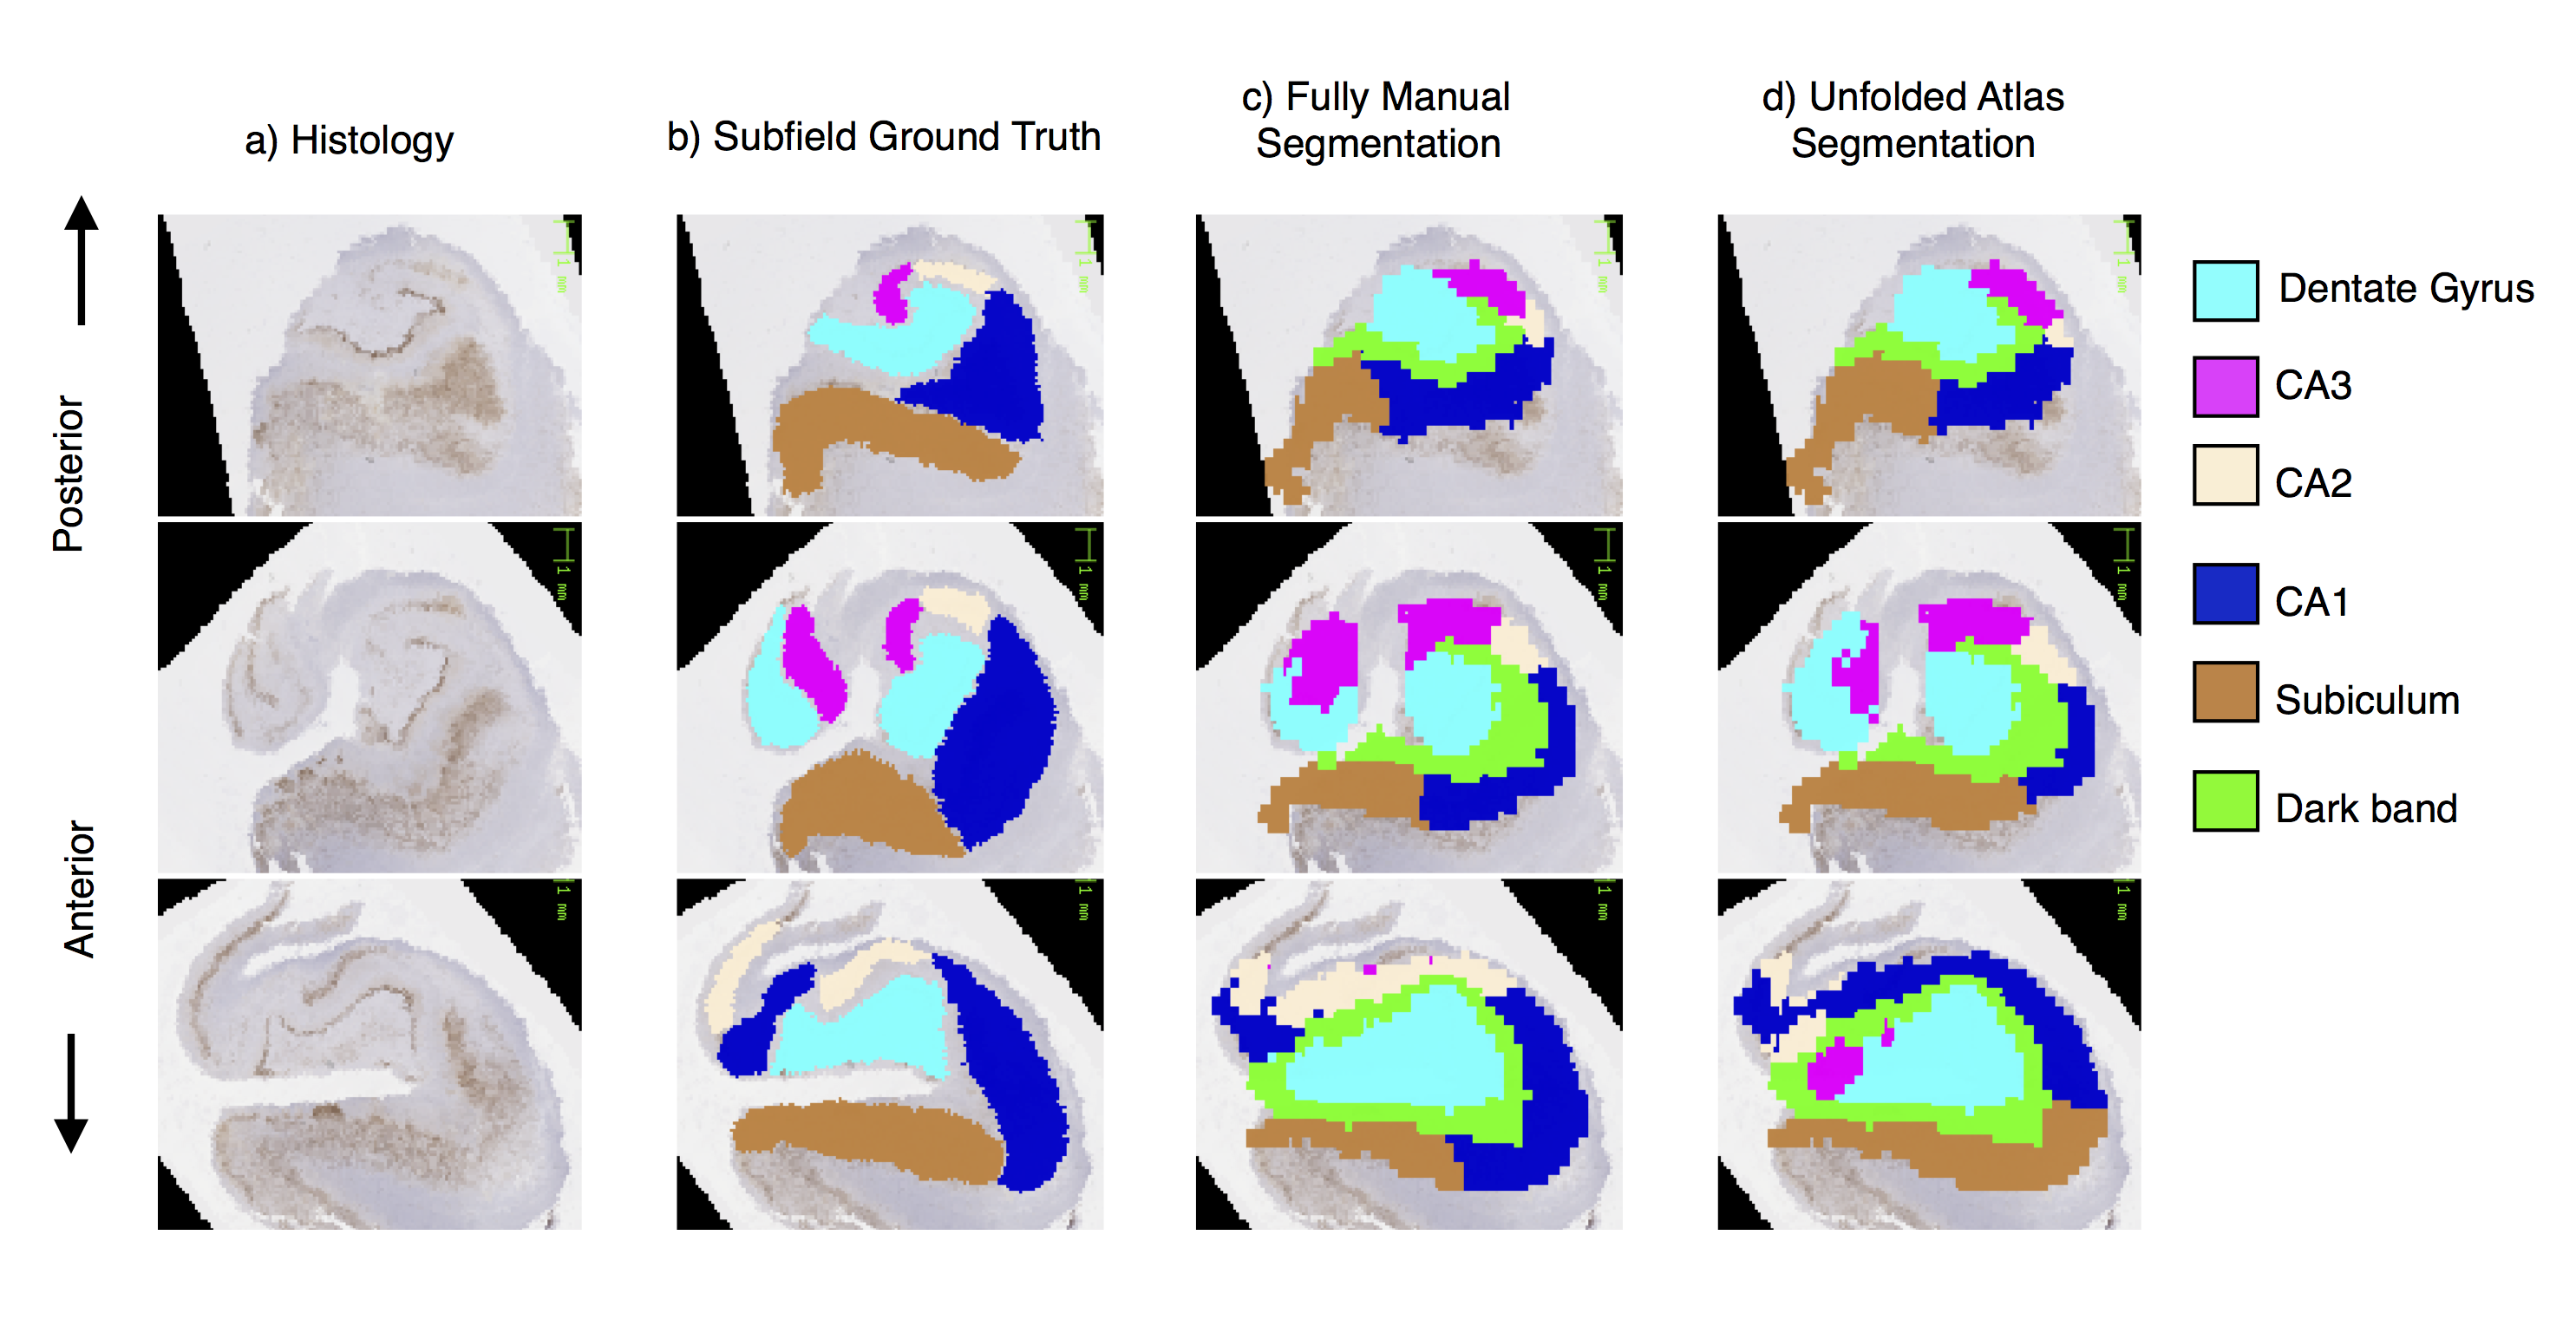
Healthy subjects were recruited from Western University, London, Canada (n = 12; 6 females; ages 20-35, mean age 27.6). Imaging was performed using a 7T neuroimaging optimized MRI scanner (Agilent/Siemens) using an in-house 23-channel transmit-receive head coil. T2-weighted TSE (3D sagittal, 260x366x266, 0.6mm isotropic, 4 averages) images, and a T1-weighted MPRAGE (3D sagittal, matrix: 256x512x230, 0.59x0.43x0.75mm) image were collected. Segmentation of the hippocampal gray matter was performed using an efficient protocol that employs a manual segmentation of the hippocampal ‘dark band’, followed by semi-automated dilation and manual correction. The unfolding technique makes use of Laplace’s equation in 3D (commonly used in cortical thickness analysis3), to decompose the hippocampal gray matter along its anterior-posterior, proximal-distal, and laminar axes. Laplace’s equation was solved iteratively, providing a smooth mapping in 3D along each axis, as well as streamlines for quantifying thickness in the laminar axis. Unfolded 2D maps were then generated at the laminar mid-point using the anterior-posterior and proximal-distal axes as horizontal and vertical axes respectively. We mapped quantitative estimates of myelin, from a ratio of T1-w and T2-w images4, in this common coordinate space, along with subfield labels from a fully-manual segmentation approach1, and pooled these across all subjects and left/right hippocampi to form an atlas.To validate accuracy of this approach for subfield labelling, we performed hippocampal segmentation and unfolding on the hippocampus from an epilepsy patient undergoing temporal lobectomy and scanned pre-surgically at 7T. An existing pipeline for MRI-histology registration5 was used to transform our 7T subfield labelling to histology slides for validation.Results
The hippocampal dark band was found to be the most prominent intra-hippocampal feature in our images, and was manually traced with a high degree of reliability (inter/intra rater Dice overlap 0.70, N=12), shown in Figure 1. Hippocampal unfolding was performed on all the cases, with an example shown in Figure 2. Unfolded maps for all subjects were pooled in the common coordinate space, and 2D atlases showing subfield label, myelin map, and thickness are presented in Figure 3. A high degree of correspondence was found across subjects in this intrinsic coordinate space, as evidenced by the concordance of subfield labels. Interestingly, the myelin map also reveals a pattern that seems to be constrained by subfield boundaries, with regions of higher intensity being CA3 and the subiculum, with lower intensity seen in CA1 and the dentate gyrus. These patterns suggest the T1w/T2w ratio may be sensitive to subject-specific micro-architectural features. Histology validation is shown in Figure 4, showing that both fully manual and the unfolded atlas subfield segmentation produce a labelling that is highly consistent with histological ground truth.Discussion & Conclusion
We have presented a technique for unfolding high-resolution isotropic structural images of the hippocampus that effectively deals with the complexity or the anterior head. This provides an intrinsic coordinate system for the hippocampus that we have shown to have high inter-subject correspondence of subfields as well as quantitative maps. Histological validation was shown for a single patient case and revealed that subfield labels propagated from the unfolded coordinate space correspond closely with ground truth subfield boundaries. Although our implementation employed manual segmentation of the hippocampal gray matter and dark band, it could be alternatively combined with more automated approaches in order to process larger datasets more efficiently.Acknowledgements
We acknowledge the support of NSERC, CIHR, and the Ontario Brain Institute EpLink Program. We would like to thank Terry Peters for providing access to the epilepsy histology data, and Joe Gati and Trevor Szekeres for assistance with 7T image acquisition.References
1. Ding, S. L., & Van Hoesen, G. W. (2015). Organization and detailed parcellation of human hippocampal head and body regions based on a combined analysis of Cyto-and chemoarchitecture. J. Comp. Neurol. 523(15), 2233-2253.
2. Zeineh MM, Engel SA, Bookheimer SY.Application of cortical unfolding techniques to functional MRI of the human hippocampal region. Neuroimage. 2000 Jun;11(6 Pt 1):668-83.
3. Jones SE, Buchbinder BR, Aharon I. Three-dimensional mapping of cortical thickness using Laplace's equation.Hum Brain Mapp. 2000 Sep;11(1):12-32.
4. Glasser MF, Van Essen DC. Mapping human cortical areas in vivo based on myelin content as revealed by T1- and T2-weighted MRI. J Neurosci. 2011 Aug 10;31(32):11597-616.
5. Goubran M, Currie C, de Ribaupierre S, Hammond RR, Burneo JG, Parrent AG, Peters TM, Khan AR. Registration of in-vivo to ex-vivo MRI of surgically resected specimens: a pipeline for histology to in-vivo registration. J. Neurosci. Methods, 2015 Feb 241(15):53–65
Figures