0695
Interhemispheric differences of the U-shape fibre system in the human brain1Dept of Neuroimaging, King's College London, London, United Kingdom, 2Dept of Forensic and Neurodevelopmental Sciences, King's College London, London, United Kingdom
Synopsis
The white matter of the human brain is mostly composed of myelinated axonal bundles connecting different brain regions. Within these tracts, U-shape fibres are short association connections that link adjacent gyri. Although they were first described by Meynert in the 19th century most of the mapping in the human brain has remained incomplete (Catani et al., 2012).
Purpose:
Using diffusion-MRI tractography and a novel method to extract U-fibres (O’Halloran et al., 2016), the main aim of this study was to generate an atlas of U-shape fibre connections and to evaluate whole-brain interhemispheric differences in these tracts.Methods:
Dataset and Processing: This study used a diffusion MRI dataset (1.25 mm isotropic voxels & bvalue=2000s/mm2) composed of 133 right-handed males, between 22-35 years, obtained from the S500 + MEG2 release of the Human Connectome project (https://www.humanconnectome.org). Spherical deconvolution tractography was performed using a damped Richardson-Lucy algorithm and applying the following tracking parameters: step size 1mm, angle threshold 60º, and absolute threshold of 0.015 (Dell'Acqua, 2013). U-shape fibre tractograms and density maps were obtained by combining a length filter (range of 20-60mm) and a geometrical constraint (O’Halloran, 2016). Finally, the tractograms of all the subjects were merged into a single dataset and normalized to MNI standard space (Dell’Acqua, 2015).
Asymmetry Analysis: Track density maps were non-linearly registered to a symmetric template to avoid anatomical biases due to differences in gyrification. Subsequently, for each subject a copy of the density map was L/R “flipped” to produce an image dataset with the reversed orientation. The flipped images were then compared against the original dataset using a single-group paired T-test. The statistical analysis was performed using threshold free cluster enhancement and nonparametric permutation methods, as implemented in FSL’s Randomise (Winkler et al. 2014).
Results:
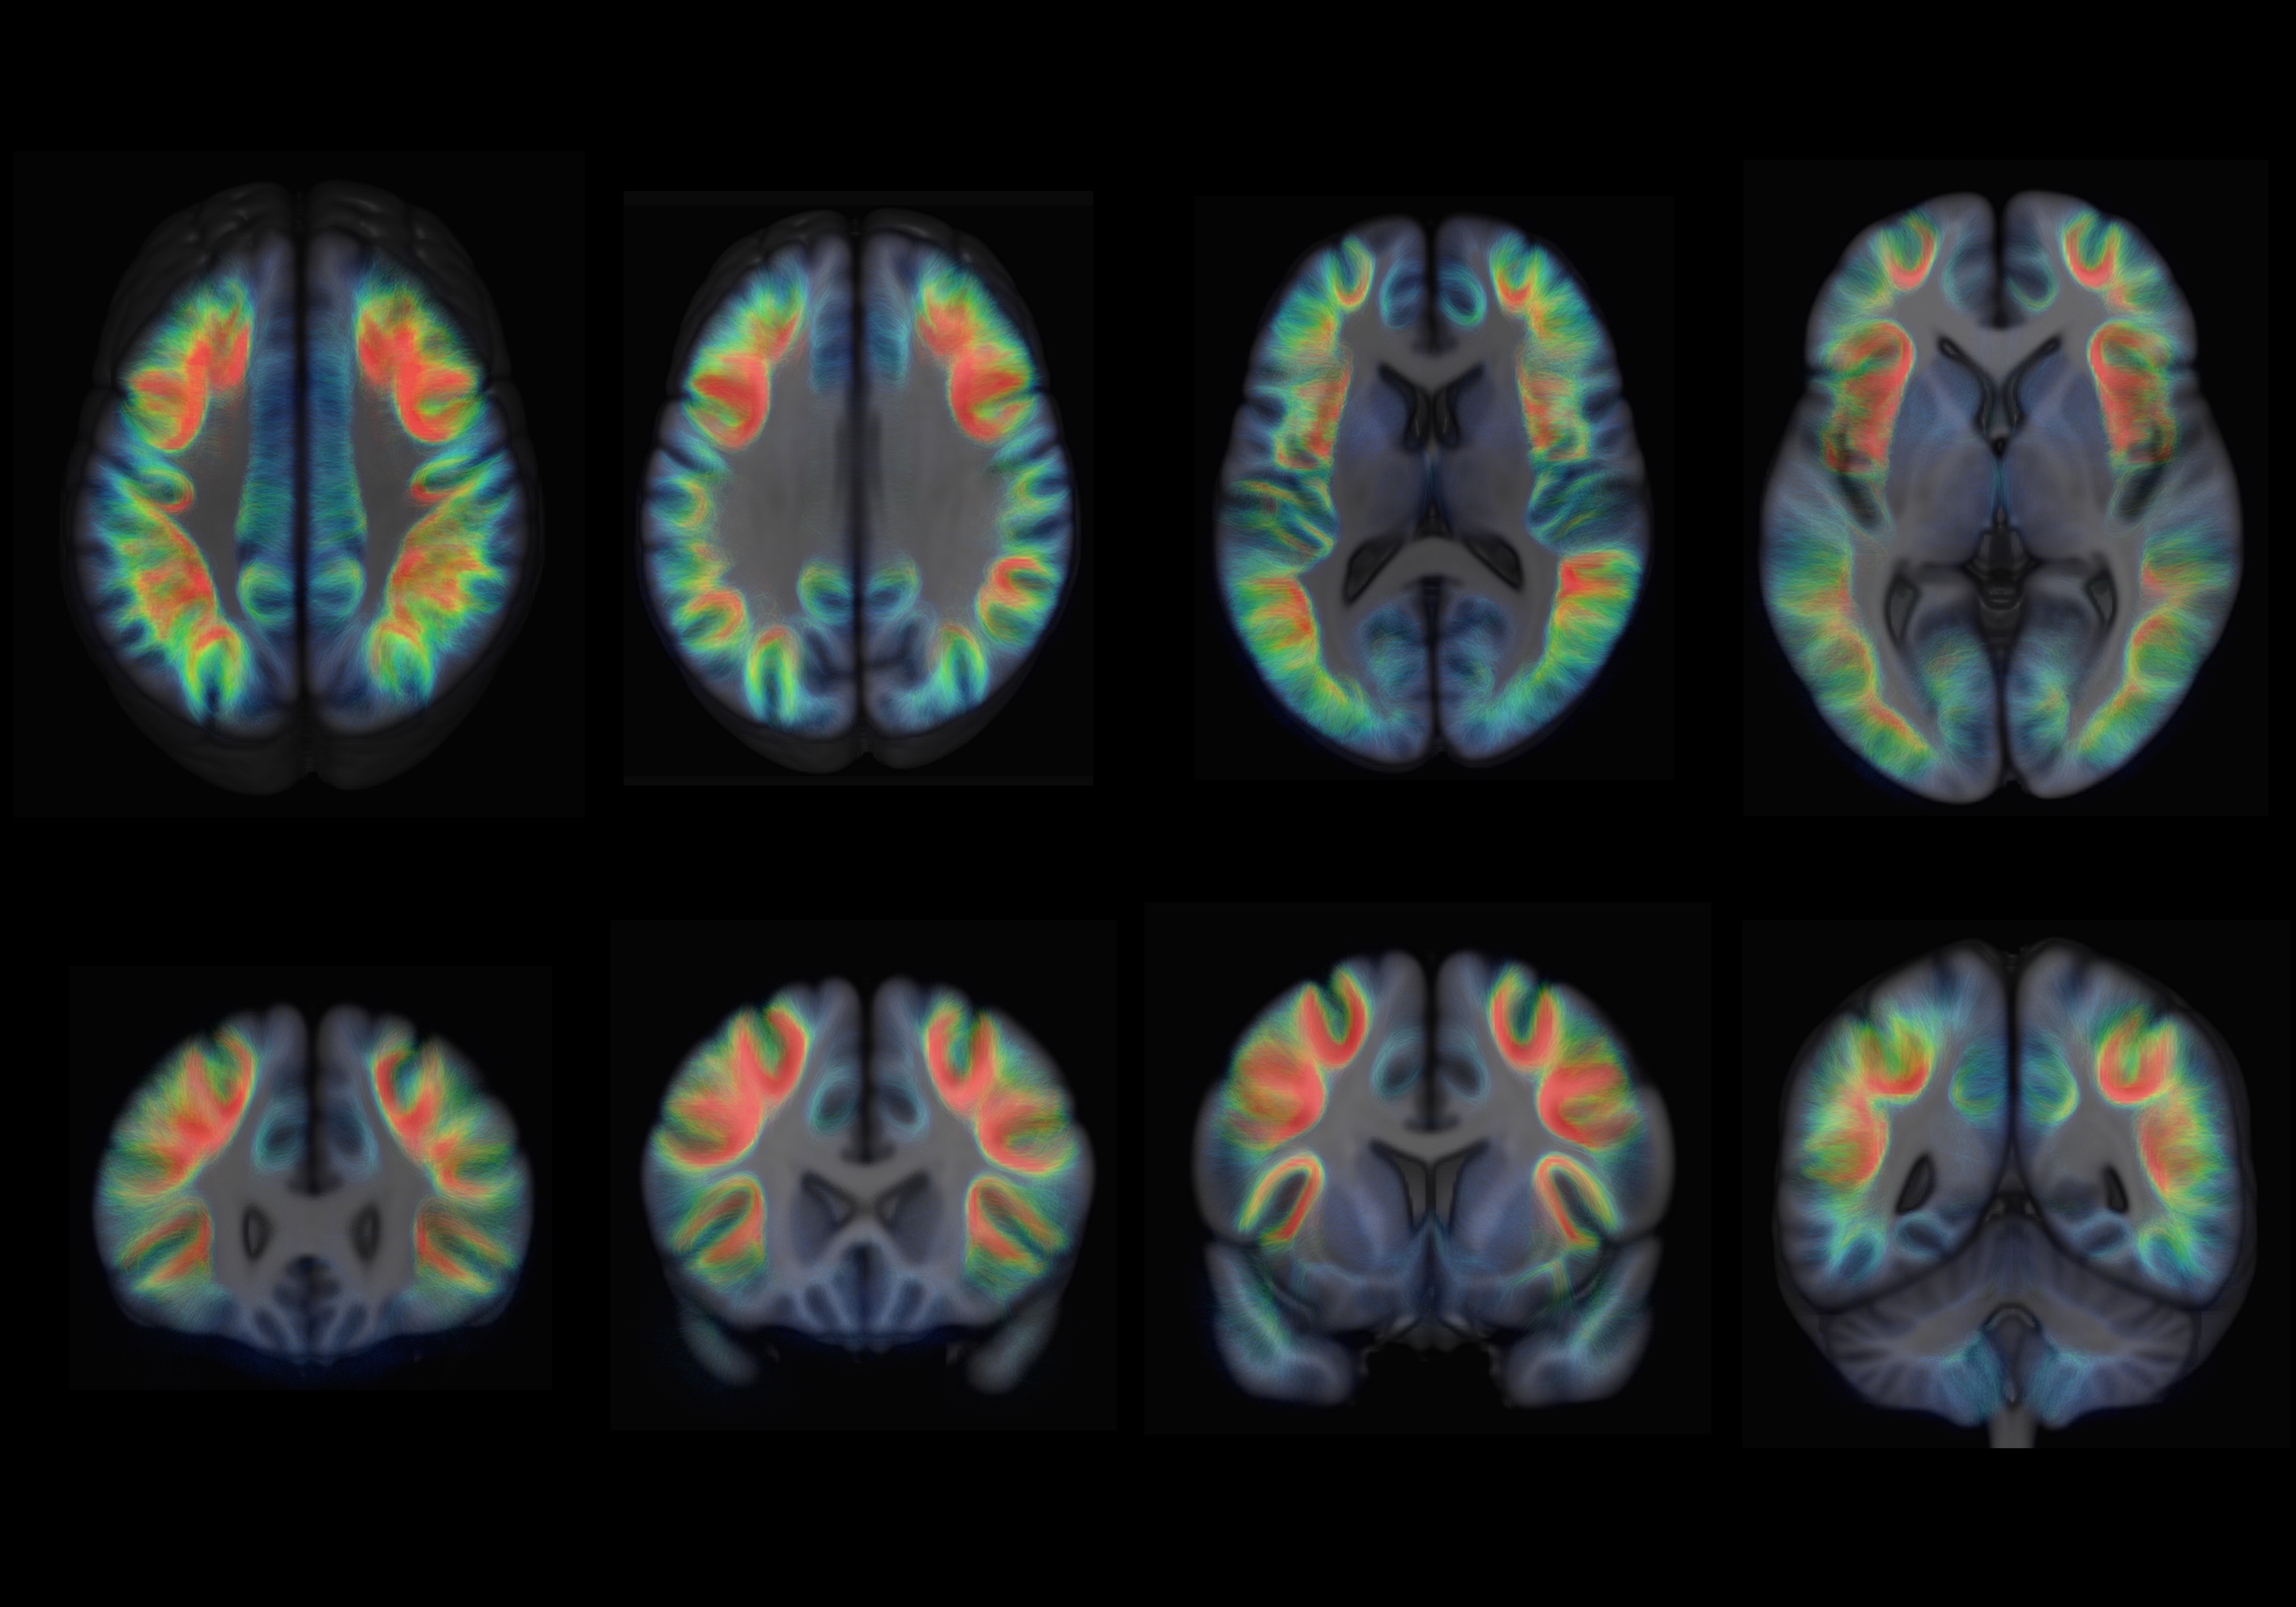
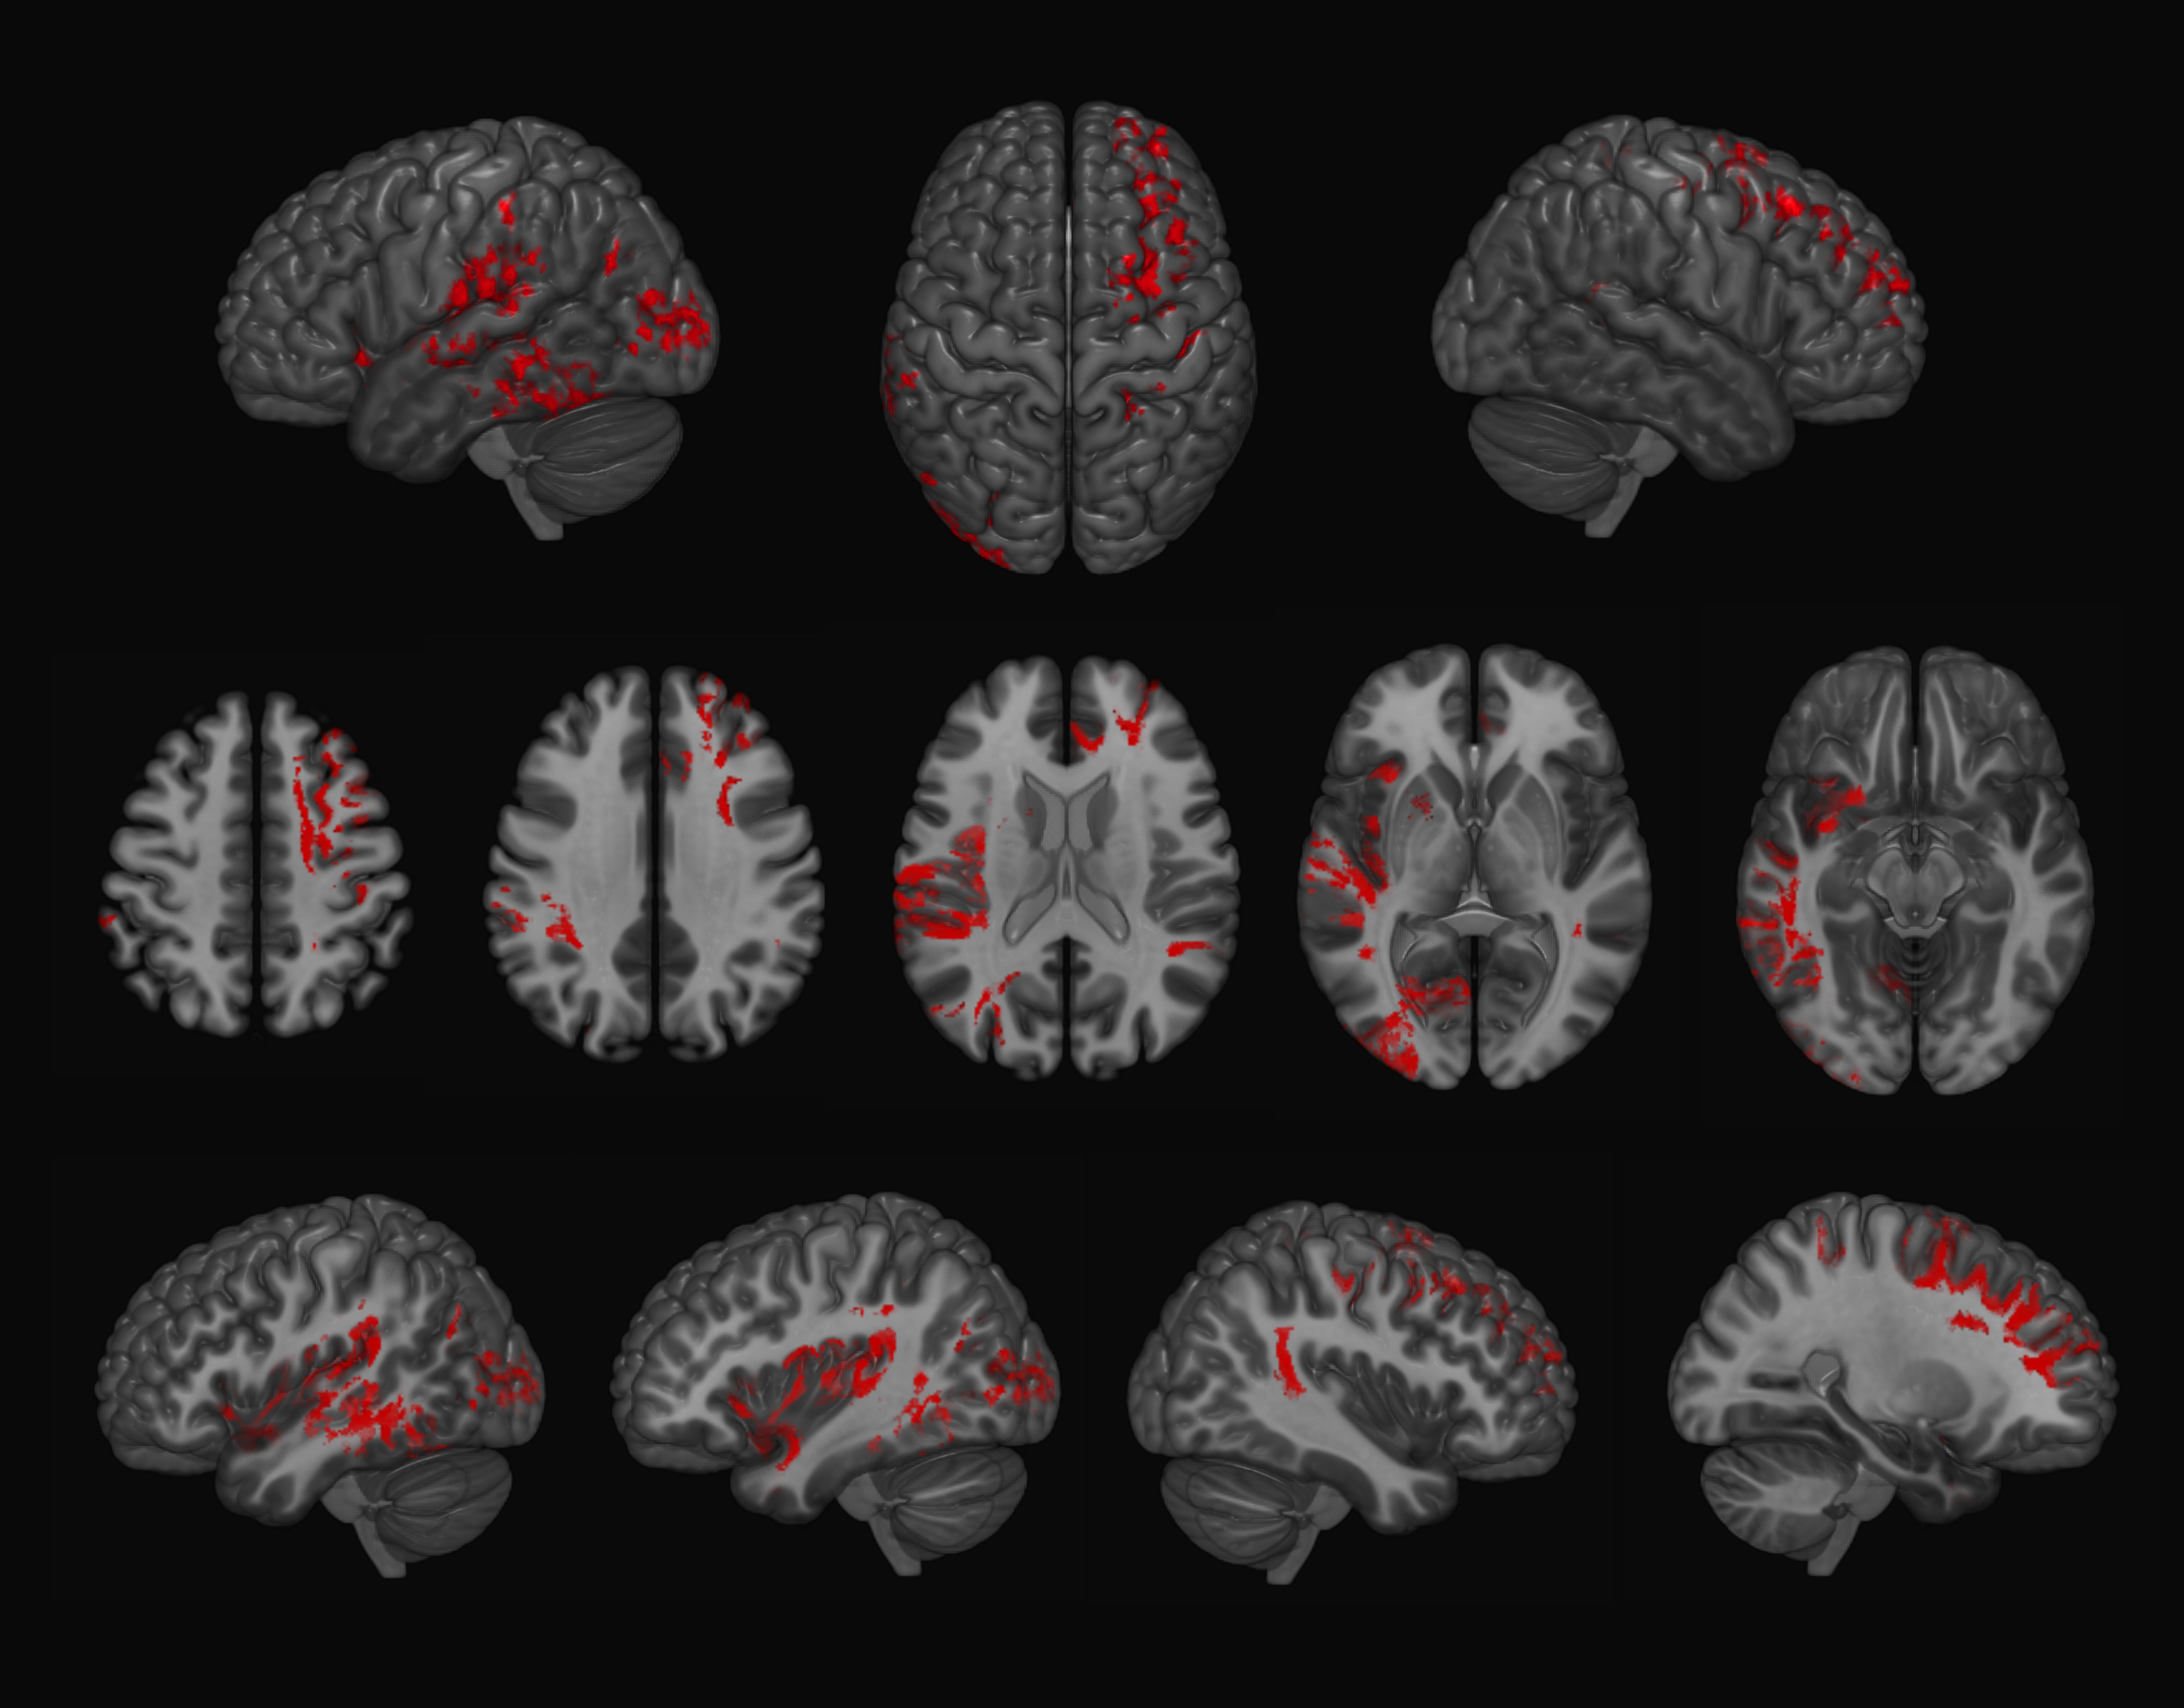
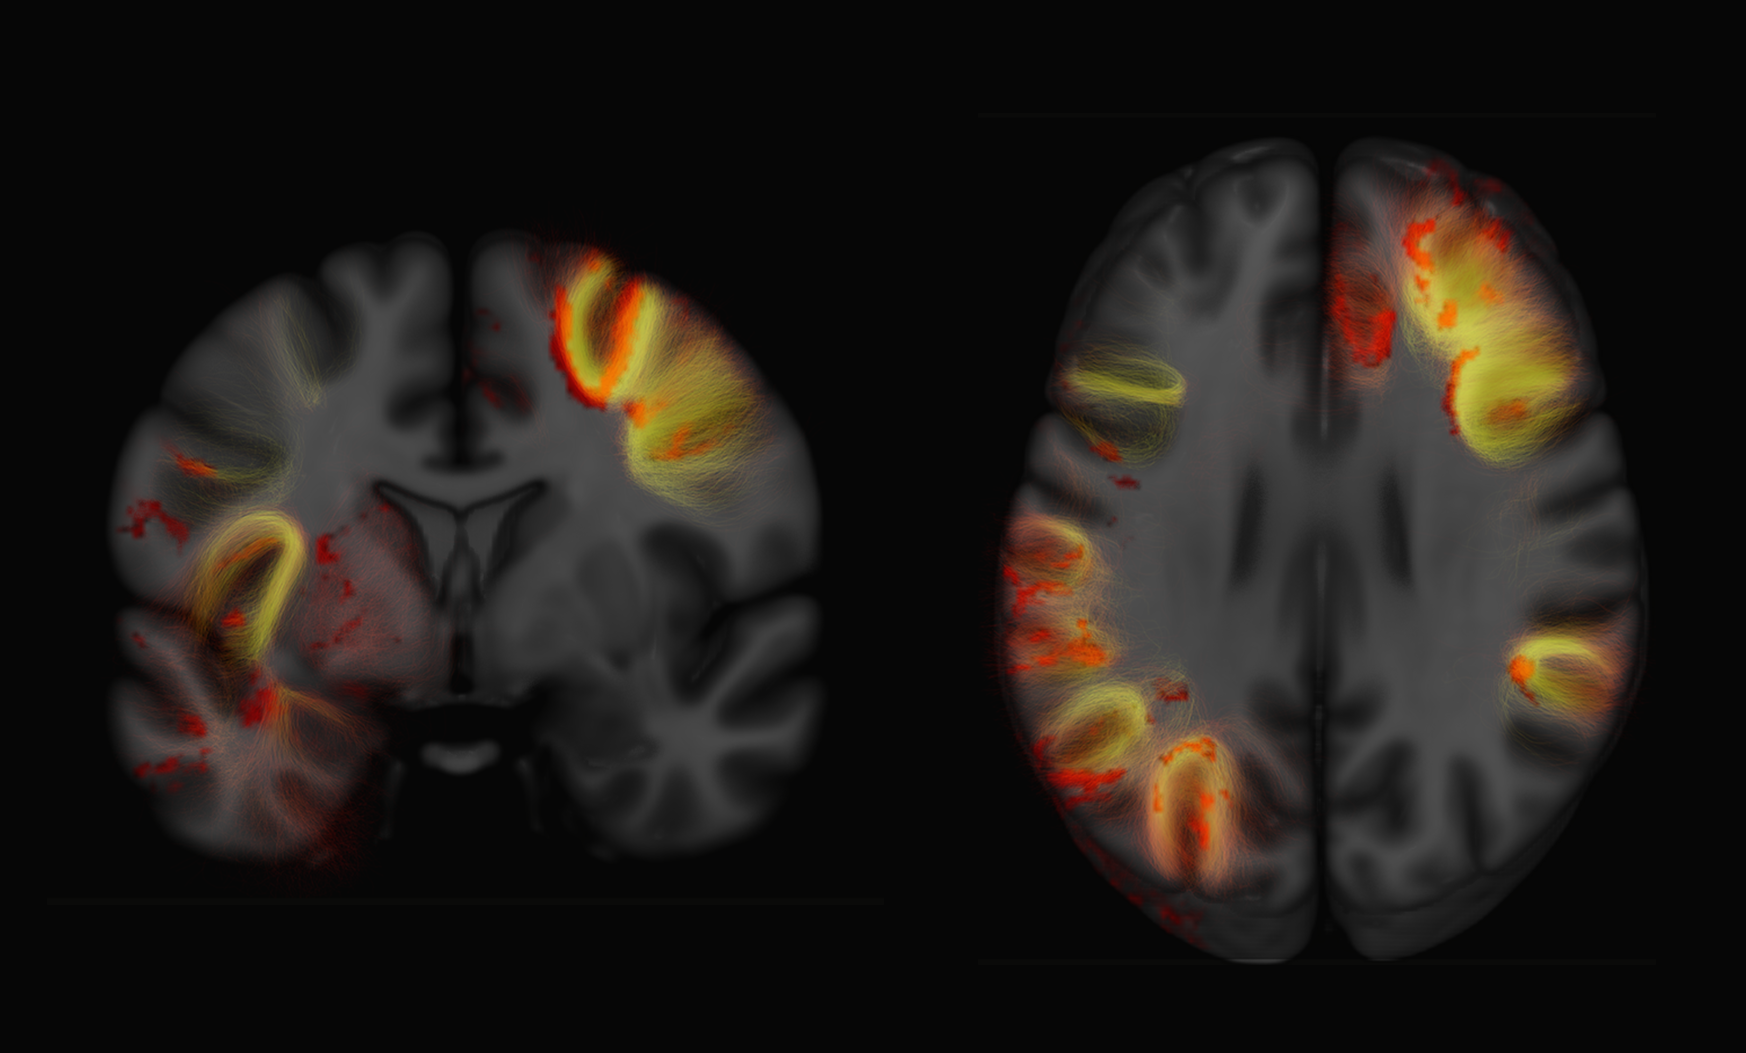
Examples of axial and coronal slices from the generated U-shape fibre atlas are provided in (Figure 1). The asymmetry analyses revealed several interhemispheric differences in the U-shaped fibres. In the right hemisphere, the majority of the significant voxels (FWE-corrected p < .001) were found within the dorsal frontal lobe. In the left hemisphere, significant voxels (FWE-corrected p < .001) were mostly found in the white matter adjacent to the insula, perisylvian regions, inferior temporal-occipital and lateral occipital cortex (Figure 2). By mapping the significant voxels onto the generated fibre atlas maps we were able to identify individually the asymmetric U-fibres (Figure 3).Discussion & Conclusion:
In this study we report the first comprehensive analysis of interhemispheric differences in the U-shape fibre system of the human brain. Overall, the left hemisphere shows a higher degree of short-distance connectivity mediated by U-shaped fibres as compared to the right hemisphere. The observed pattern of asymmetries in the left hemisphere suggests a significant crosstalk between the insula and adjacent frontal, temporal, and parietal regions, which may contribute to different aspects of language and social communication. On the other hand, clusters of right lateralized fibres, especially in the temporo-parietal regions may relate to visuospatial attention (Dronkers 1996; Bamiou et al. 2003; Catani et al., 2012; Thiebaut de Schotten et al. 2011). Future work combining functional and behavioural measurements will be required to unravel the cognitive role of the observed interhemispheric differences.Acknowledgements
This work was supported by the Mexican Council of Science and Technology (CONACYT).References
Bamiou, D.-E., Musiek, F.E. & Luxon, L.M., 2003. The insula (Island of Reil) and its role in auditory processing. Brain Research Reviews, 42(2), pp.143–154.
Catani, M., Dell’Acqua, F., Vergani, F., Malik, F., Hodge, H., Roy, P., Valabregue, R. & de Schotten, M.T., 2012. Short frontal lobe connections of the human brain. Cortex, 48(2), pp.273–291.
Catani, M., Dell’Acqua, F., Vergani, F., Malik, F., Hodge, H., Roy, P., Valabregue, R. & Thiebaut de Schotten, M., 2012. Short frontal lobe connections of the human brain. Cortex, 48(2), pp.273–291. Available at: http://www.ncbi.nlm.nih.gov/pubmed/22209688.
Dell’Acqua, F. et al., 2013. Can spherical deconvolution provide more information than fiber orientations? Hindrance modulated orientational anisotropy, a true tract specific index to characterize white matter diffusion. Hum Brain Mapp, pp.2464–2483. Available at: http://www.ncbi.nlm.nih.gov/pubmed/19781650.
Dell'Acqua, F. et al., 2015. Megatrack: A fast and effective strategy for group comparision and supervised analysis of large-scale tractography datasets. Proc. Intl. Soc. Mag. Reson. Med. 23
Dronkers, N.F., 1996. A new brain region for coordinating speech articulation. Nature, 384(6605), pp.159–161.
O'Halloran, R. et al., 2016. U-fiber Quantification in Non-Lesional Epilepsy. Proc. Intl. Soc. Mag. Reson. Med.
Thiebaut de Schotten, M. et al., 2011. A lateralized brain network for visuospatial attention. Nature Publishing Group, 14(10), pp.1245–1246. Available at: http://www.ncbi.nlm.nih.gov/pubmed/21926985.
Winkler, A.M. et al., 2014. Permutation inference for the general linear model. NeuroImage, 92(C), pp.381–397.
Figures