0693
Fracture Risk Assessment using Deep Learning and Hip Microarchitecture MRI1Department of Radiology, Center for Advanced Imaging Innovation and Research (CAI2R) and Bernard and Irene Schwartz Center for Biomedical Imaging, New York University School of Medicine, New York, NY, United States, 2The Sackler Institute of Graduate Biomedical Sciences, New York University School of Medicine, New York, NY, United States, 3Courant Institute of Mathematical Sciences & Centre for Data Science, New York University, New York, NY, United States, 4Osteoporosis Center, Hospital for Joint Diseases, NYU Langone Medical Center, New York, NY, United States, 5Department of Orthopaedic Surgery, Hospital for Joint Diseases, NYU Langone Medical Center, New York, NY, United States, 6Department of Radiology, Center for Musculoskeletal Care, New York University Langone Medical Center, New York, NY, United States
Synopsis
The identification of subjects with high risk of developing osteoporosis-related fracture remains challenging. In this project, we developed supervised convolutional neural networks for hip fracture risk identification using proximal femur MR microarchitecture images and patients’ history of fragility fractures. We found that the proposed fracture risk assessment method provides superior discrimination of fragility fracture patients from controls compared to the current standard of care, DXA.
Purpose
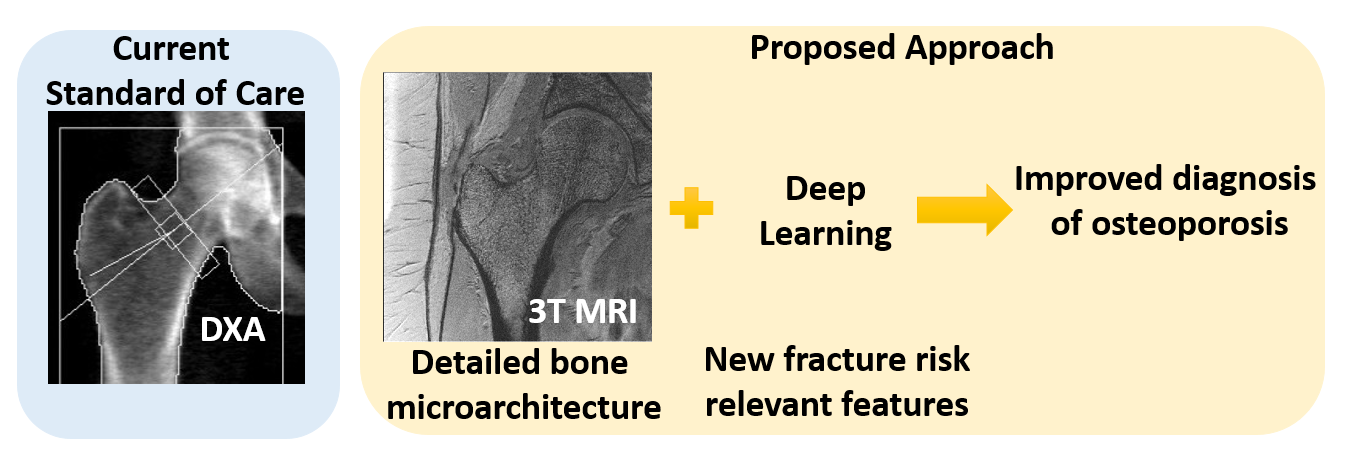
Accurate fracture risk assessment using high resolution MR images requires using image analysis methods to extract microarchitectural information from trabecular bone, such as the topology and orientation of trabecular networks1–3, or using finite element modeling to estimate metrics of bone strength4–6. These methods focus mainly on particular features that are previously defined for characterizing fracture risk and neglect possible interactions on a constellation of features that still need to be discovered. In this work, we propose to develop a deep learning based automatic feature extraction algorithm for determining and understanding fracture risk (Figure 1). High spatial resolution images combined with and automatic fracture risk assessment system may provide improved detection of high fracture risk patients and unveil the key combination of features that contribute to bone fragility.Methods
This study had institutional review board approval and written informed consent was obtained from all subjects. We use proximal femur microarchitecture MR images obtained at clinical 3T MRI scanner (Skyra, Siemens, Erlangen) using commercial arrays (18-element Siemens flexible array and 8-elements from the Siemens spine array). Images were obtained using 3D FLASH sequence with following parameters: TR/TE = 31/4.92 ms; flip angle, 25; in-plane voxel size, 0.234 x 0.234 mm; section thickness, 1.5 mm; number of coronal sections, 60; acquisition time, 25 minutes 30 seconds; bandwidth, 200 Hz/pixel. The study included 56 postmenopausal volunteers. All subjects had standard clinical DXA (Hologic, Waltham, MA) of the same hip within two months of the MRI examination.
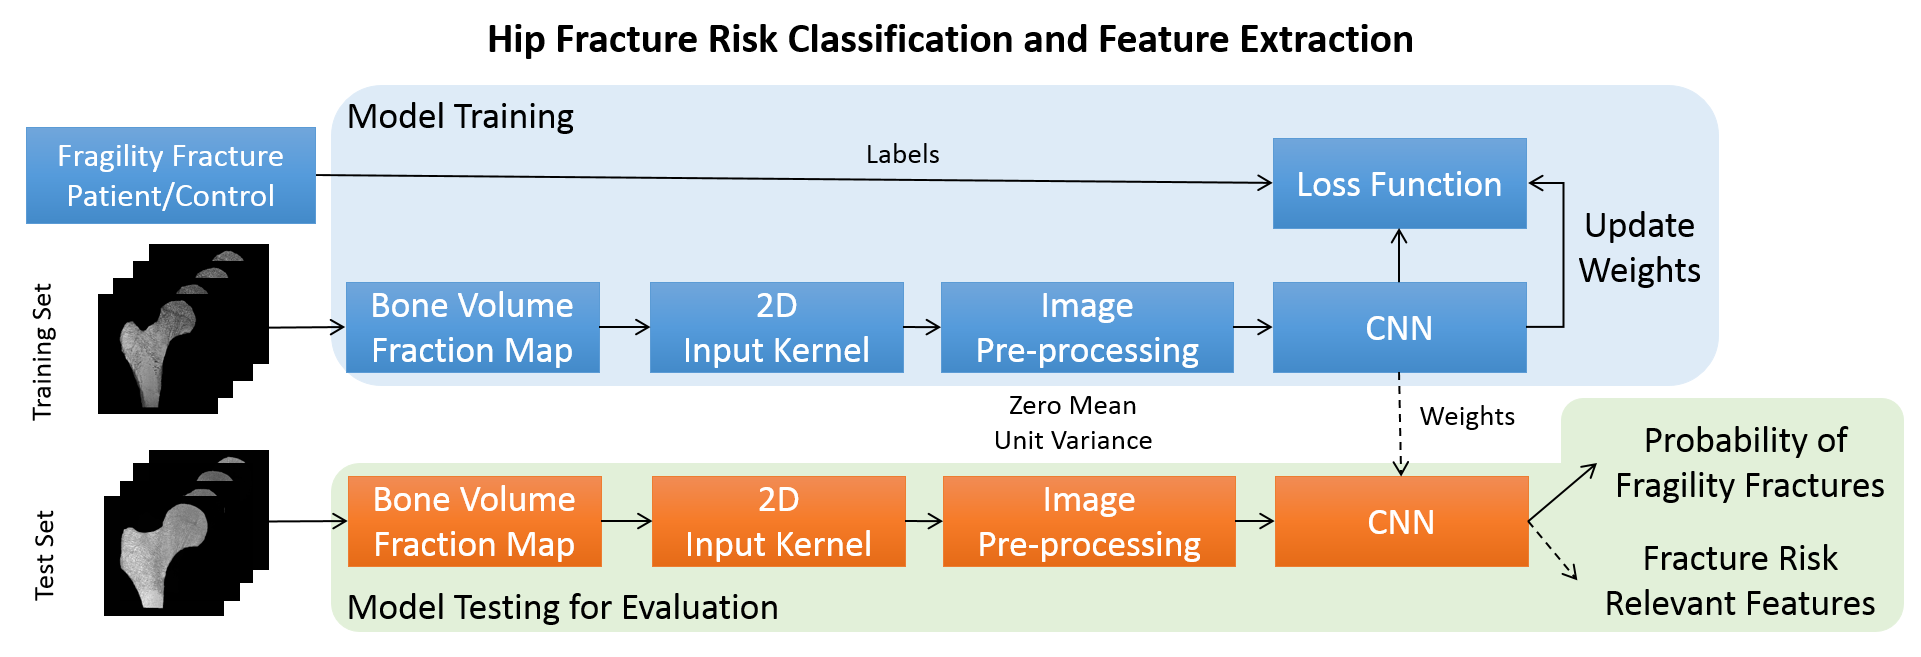
We used supervised deep convolutional networks (CNN) for automatic fracture risk assessment. We performed model training on randomly selected n=44 subjects (22 fragility fracture patients and 22 controls) and tested the generalization accuracy of the model on n=12 subjects (6 fragility fracture patients and 6 controls). Figure 2 illustrates our proposed classification algorithm with an end product of fracture risk relevant features and probability of fragility fractures.
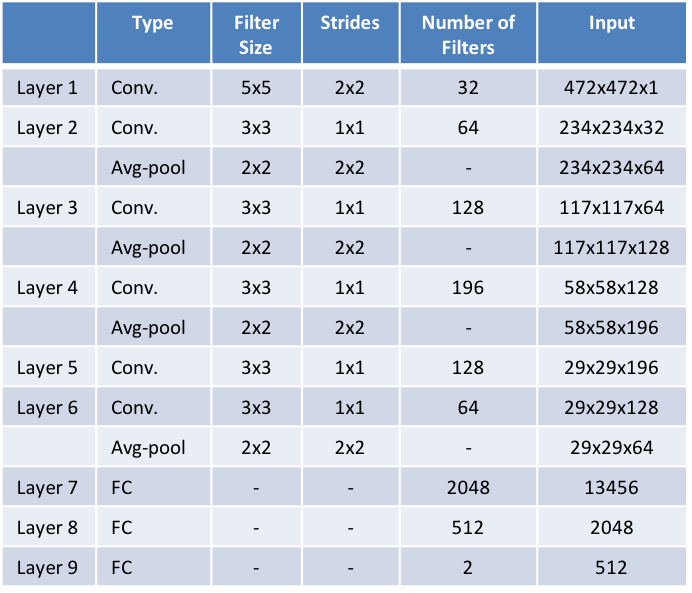
Figure 3 represents the CNN architecture that is used in this study. Kernel weight were initialized by the method proposed by Glorot and Bengio7. For non-linearly transforming the data during modelling, rectifier linear units (ReLU)8 were used. Dropout9 between fully connected hidden layers and L2 regularization on kernel weights were utilized to reduce overfitting for better generalization. Patients’ history of osteoporosis was used as a learning criteria for labeling the binary classification problem (0: patient with osteoporosis, 1: control subject) using a logistic loss function. Osteoporosis was defined as the presence of a fragility fracture that was radiographically confirmed rather than confirmed by using the DXA criterion, because DXA has low sensitivity and specificity for the detection of bone fragility in patients at risk for fracture10–12. MR images were fed into CNN by extracting 11 slices (covering 16.5 mm of the proximal femur center) from hand segmented proximal femur images and assigning patients history of fractures as a label to each slice. We used 2D convolutional kernels on the network and Tensorflow13 software library for machine learning.
Results
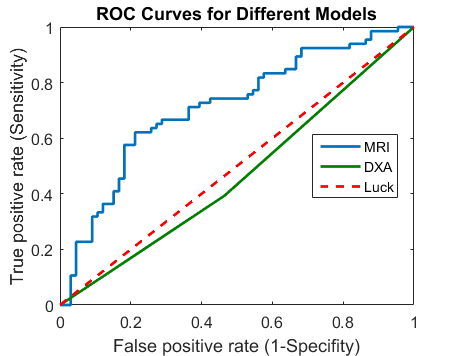
ROC analysis of the modelled network on test data and DXA measurements of all subjects is shown in Figure 4. Our results suggest that fracture risk determination using deep learning has better discriminative power between groups than DXA derived hip BMD T-scores (area under the curve (AUC) = 0.71 vs 0.46). The accuracy, sensitivity and specificity of the proposed model / DXA derived parameters were 0.46 / 0.69, 0.45 / 0.74, and 0.47 / 0.66.
Discussion and Conclusions
We presented an automatic fracture risk assessment method using deep learning and high resolution hip microarchitecture MR images. Our preliminary results indicate that there is a potential for using convolutional networks for assessment of fracture risk by extracting an ensemble of features directly from MR images. This combination of features is expected to represent information that is not captured by the current parameters obtained from standard of care, DXA, and, could potentially be included into future fracture risk assessment studies and into clinical practice.
In the future studies, we expect the AUC value of the MRI data derived parameters will improve using cross-validation with hyper parameter optimization14. We are planning to understand underlying learning behavior of CNN using visualization tools15–17, this will allow us to determine where extracted features have emerged and how they are related.
Acknowledgements
This work was supported in part by NIH R01 AR066008 and was performed under the rubric of the Center for Advanced Imaging Innovation and Research (CAI2R, www.cai2r.net), a NIBIB Biomedical Technology Resource Center (NIH P41 EB017183).References
1. Hildebrand, T., Laib, A., Müller, R., Dequeker, J. & Rüegsegger, P. Direct Three-Dimensional Morphometric Analysis of Human Cancellous Bone: Microstructural Data from Spine, Femur, Iliac Crest, and Calcaneus. J. Bone Miner. Res. 14, 1167–1174 (1999).
2. Ladinsky, G. A. et al. Trabecular structure quantified with the MRI-based virtual bone biopsy in postmenopausal women contributes to vertebral deformity burden independent of areal vertebral BMD. J. Bone Miner. Res. 23, 64–74 (2008).
3. Gomberg, B. R., Saha, P. K., Hee Kwon Song, Hwang, S. N. & Wehrli, F. W. Topological analysis of trabecular bone MR images. IEEE Trans. Med. Imaging 19, 166–174 (2000).
4. Rajapakse, C. S. et al. Micro-MR imaging-based computational biomechanics demonstrates reduction in cortical and trabecular bone strength after renal transplantation. Radiology 262, 912–920 (2012).
5. MacNeil, J. A. & Boyd, S. K. Bone strength at the distal radius can be estimated from high-resolution peripheral quantitative computed tomography and the finite element method. Bone 42, 1203–1213 (2008).
6. Cody, D. D. et al. Femoral strength is better predicted by finite element models than QCT and DXA. J. Biomech. 32, 1013–1020 (1999).
7. Glorot, X. & Bengio, Y. Understanding the difficulty of training deep feedforward neural networks. Aistats 9, 249–256 (2010).
8. Nair, V. & Hinton, G. E. Rectified Linear Units Improve Restricted Boltzmann Machines. Proc. 27th Int. Conf. Mach. Learn. 807–814 (2010). doi:10.1.1.165.6419
9. Srivastava, N., Hinton, G. E., Krizhevsky, A., Sutskever, I. & Salakhutdinov, R. Dropout?: A Simple Way to Prevent Neural Networks from Overfitting. J. Mach. Learn. Res. 15, 1929–1958 (2014).
10. Stone, K. L. et al. BMD at multiple sites and risk of fracture of multiple types: long-term results from the Study of Osteoporotic Fractures. J. Bone Miner. Res. 18, 1947–54 (2003).
11. Schuit, S. C. E. et al. Fracture incidence and association with bone mineral density in elderly men and women: The Rotterdam Study. Bone 34, 195–202 (2004).
12. Cummings, S. R. Are patients with hip fractures more osteoporotic? Review of the evidence. Am J Med 78, 487–494 (1985).
13. Abadi, M. et al. TensorFlow: Large-Scale Machine Learning on Heterogeneous Distributed Systems. arXiv:1603.04467v2 (2016). at <http://arxiv.org/abs/1603.04467>
14. Snoek, J., Larochelle, H. & Adams, R. P. Practical Bayesian Optimization of Machine Learning Algorithms. Adv. Neural Inf. Process. Syst. 25 1–9 (2012). doi:2012arXiv1206.2944S
15. Yosinski, J., Clune, J., Nguyen, A., Fuchs, T. & Lipson, H. Understanding Neural Networks Through Deep Visualization. Int. Conf. Mach. Learn. - Deep Learn. Work. 2015 12 (2015). at <http://arxiv.org/abs/1506.06579>
16. Nguyen, A., Yosinski, J. & Clune, J. Multifaceted Feature Visualization: Uncovering the Different Types of Features Learned By Each Neuron in Deep Neural Networks. arXiv: 1602.03616 23 (2016). at <http://arxiv.org/abs/1602.03616>
17. Zeiler, M. & Fergus, R. Visualizing and understanding convolutional networks. Comput. Vision–ECCV 2014 8689, 818–833 (2014).
18. Bone Density Testing (DEXA Scan). at <http://www.ycadvancedimaging.com/dexa.htm>
19. Kanis, J. A. Assessment of osteoporosis at the primary health care level. World Health 339 (2007). at <http://www.shef.ac.uk/FRAX/pdfs/WHO_Technical_Report.pdf>
20. Kanis, J. A., Johnell, O., Oden, A., Johansson, H. & McCloskey, E. FRAXTM and the assessment of fracture probability in men and women from the UK. Osteoporos. Int. 19, 385–397 (2008).
Figures