0685
Prediction of breathing related B0-field fluctuations via artificial neural networks trained on magnetic field monitoring data1Department of Radiology - Medical Physics, Medical Center – University of Freiburg, Freiburg, Germany, 2Siemens Healthcare AB, Malmö, Sweden, 3German Cancer Research Center, Heidelberg, Germany
Synopsis
The presented approach utilizes artificial neural networks trained on magnetic field monitoring data in order to predict respiration induced B0-field fluctuations in the brain under the condition of normal breathing. From the predicted B0-field fluctuations it is possible to distinguish the respiration induced resonance offset from the resonance offsets induced by other sources during the course of the experiment. This allows for the quantification of breathing related B0-field fluctuations in the brain of normally breathing healthy volunteers. Furthermore it was observed that the B0-field fluctuations resulting from normal respiration show individual spatial dynamics for every volunteer.
Purpose
Respiration induced image artifacts have been reported in numerous studies. 1 Although many methods exist to reduce the respiration induced signal variation (gating, temporal filtering, independent component analysis, …), only limited experimental data about the actual influence of natural respiration (e.g. without exaggerated deep breathing or breath-holds) on the B0-field in the brain are available in the literature. 2-5 Magnetic Field Monitoring (MFM) allows to measure magnetic field evolution using miniature field probes. 6 However, all temporal-spatial magnetic field changes are measured and their sources cannot be separated without an accurate model of the source coupling. In this work the focus is on quantification of the respiration-induced B0-field fluctuations in the brain at 3 Tesla from MFM data. In order to quantify the fluctuations of naturally breathing volunteers, we investigate if it is feasible to build a general model to describe the coupling of respiration induced B0-field fluctuations in the brain using machine learning methods.Methods
Experiments were performed using a 3 T MAGNETOM Prisma with a 64-channel Head/Neck coil (Siemens, Erlangen, Germany) and prototype sequences. A dynamic field camera (Skope LLC, Zürich, Switzerland) was used for external field sensing, consisting of 5 fluorine based transmit/receive field probes and a stand-alone spectrometer. The field probes were integrated into the head coil to be as close as possible to the volunteers’ head. For all experiments the subjects were instructed to remain still and breath normally (4 healthy MRI compliant male, age 30±3, body mass index = 22.6±2.3). The volunteer breathing patterns were recorded with the scanner respiration belt. The field probe signals were acquired after each slice with an echo planar sequence (TR = 6.42 s, TE = 32 ms, 37 slices, 45 repetitions, TA = 8:08 min). Magnetic field estimation and data analysis were performed with MATLAB (The MathWorks, Natick, MA, USA). The first 4 (0, X, Y, Z) and the 7th (Z2) term of the real-valued spherical harmonic expansion were chosen to describe the magnetic field spatial distribution. The time coefficients [c0(t), cX(t), cY(t), cZ(t), cZ2(t)] of the magnetic field spatial components were calculated from the field probe data, and were normalized to the maximum phase value within a sphere of 9 cm radius. In order to predict the influence of respiration on the different B0-field components, a model for each volunteer was created by training an Artificial Neural Network (ANN). For the ANN training a six-layer feed-forward neural network with 10 sigmoid hidden neurons each and linear output neurons was used in combination with a Levenberg-Marquardt backpropagation algorithm. ANN allow to model nonlinear coupling effects. The data division was set to random. The training was conducted with data from the first 750 samples of each experiment. Subsequent testing was performed on the remaining data.Results and Discussion
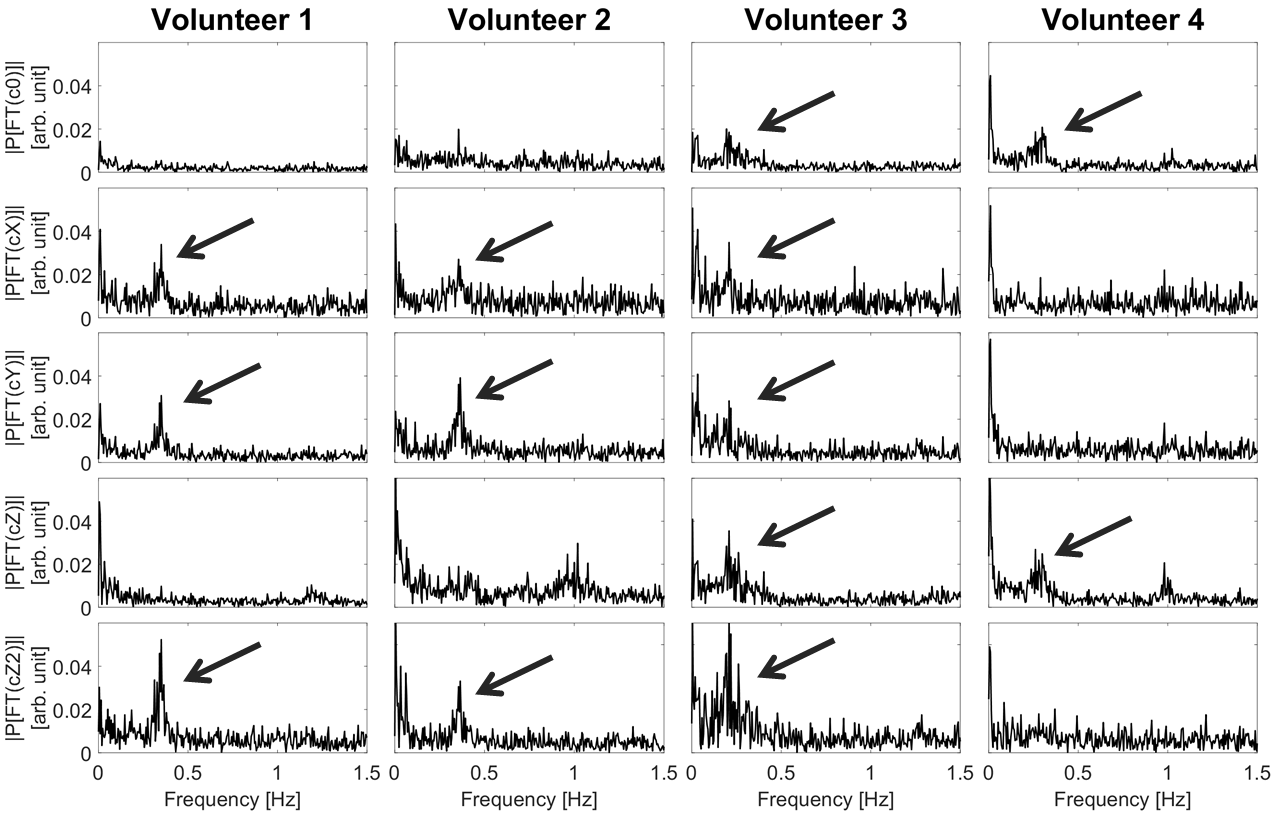
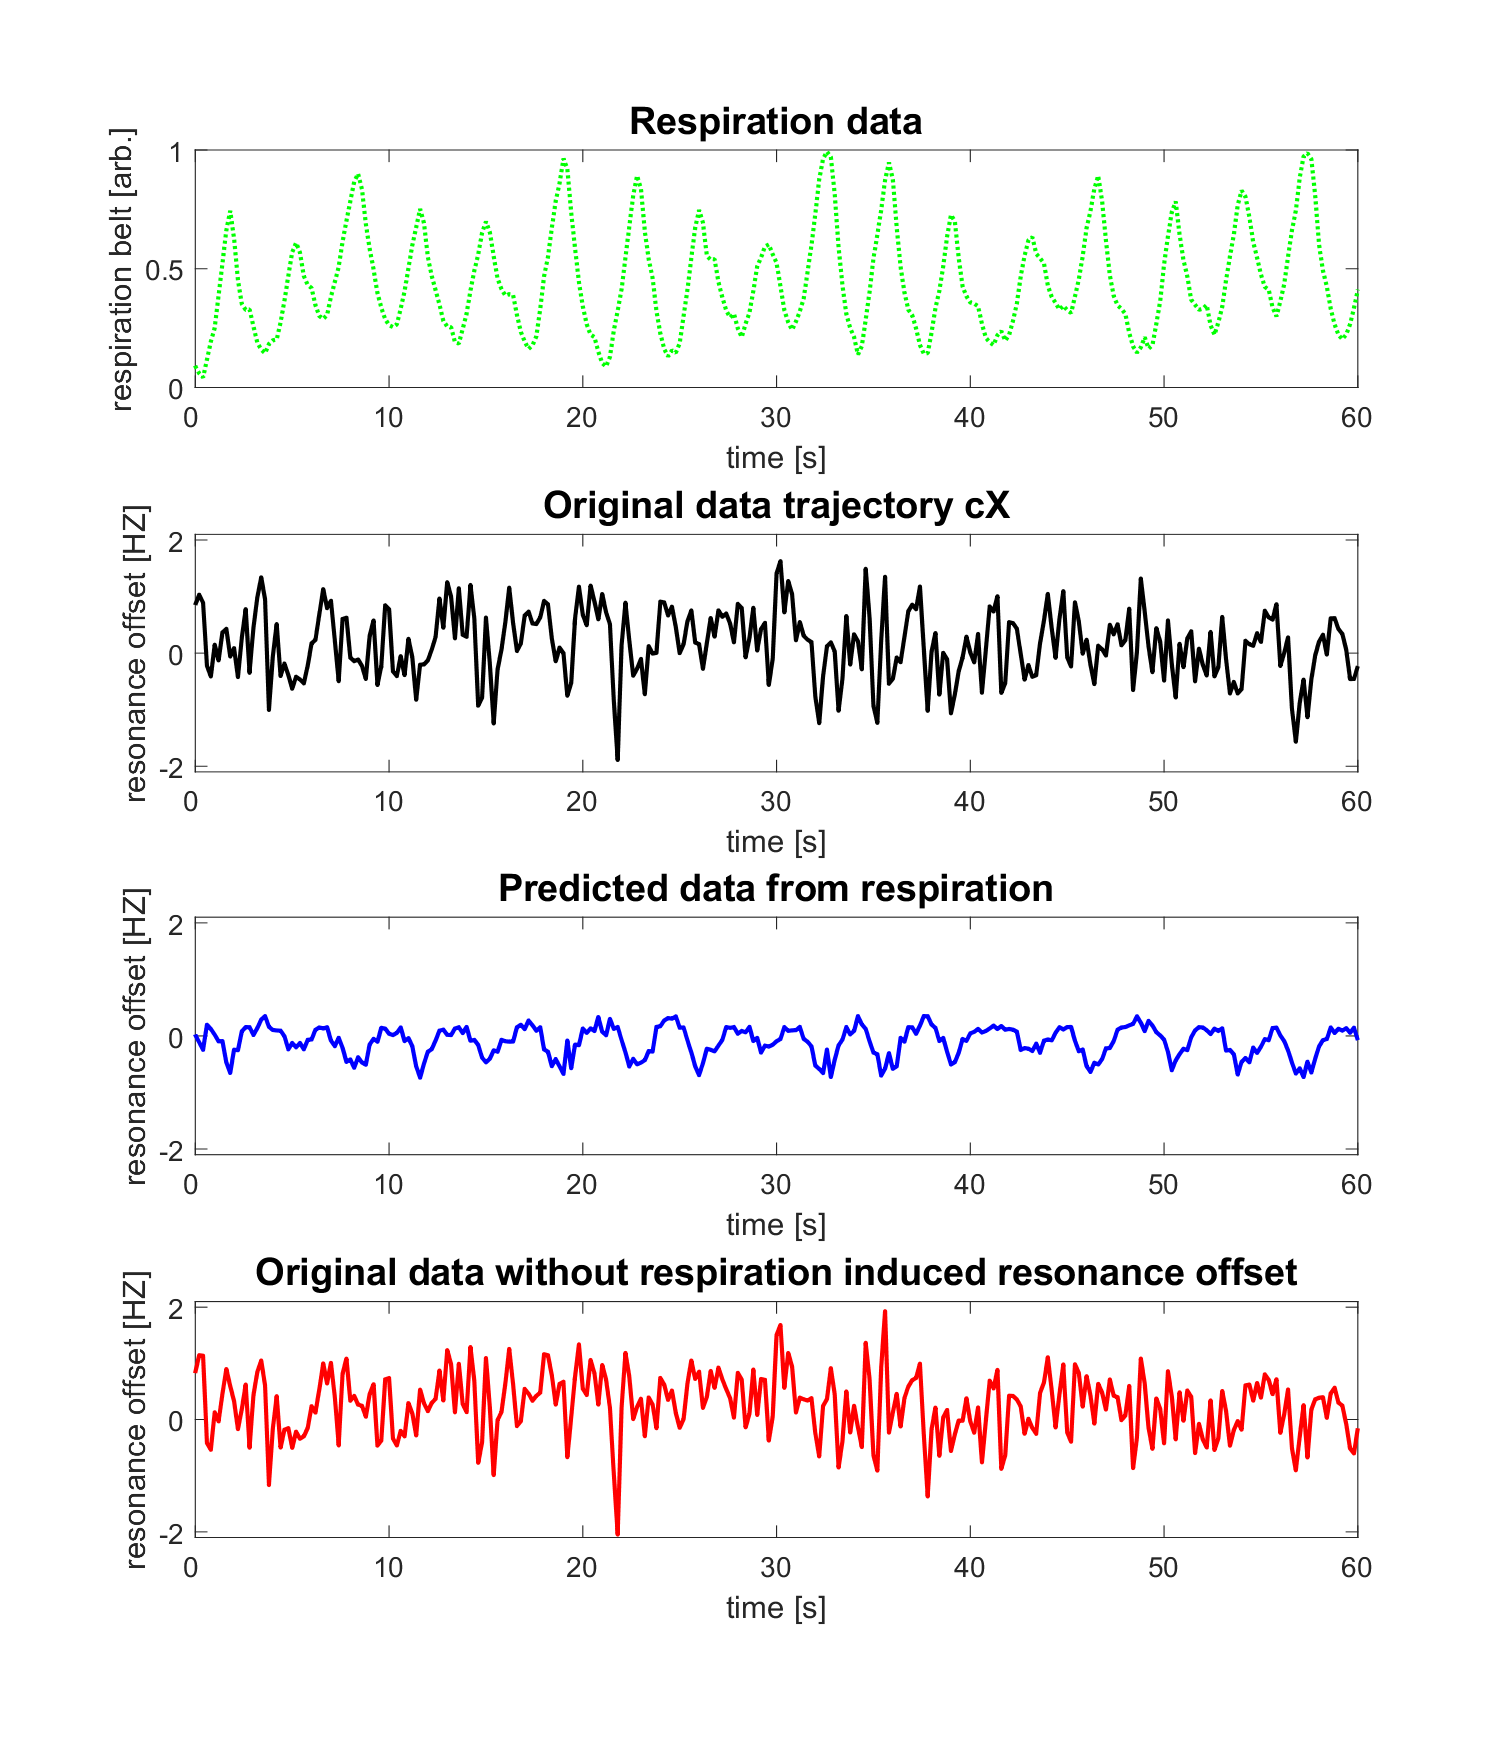
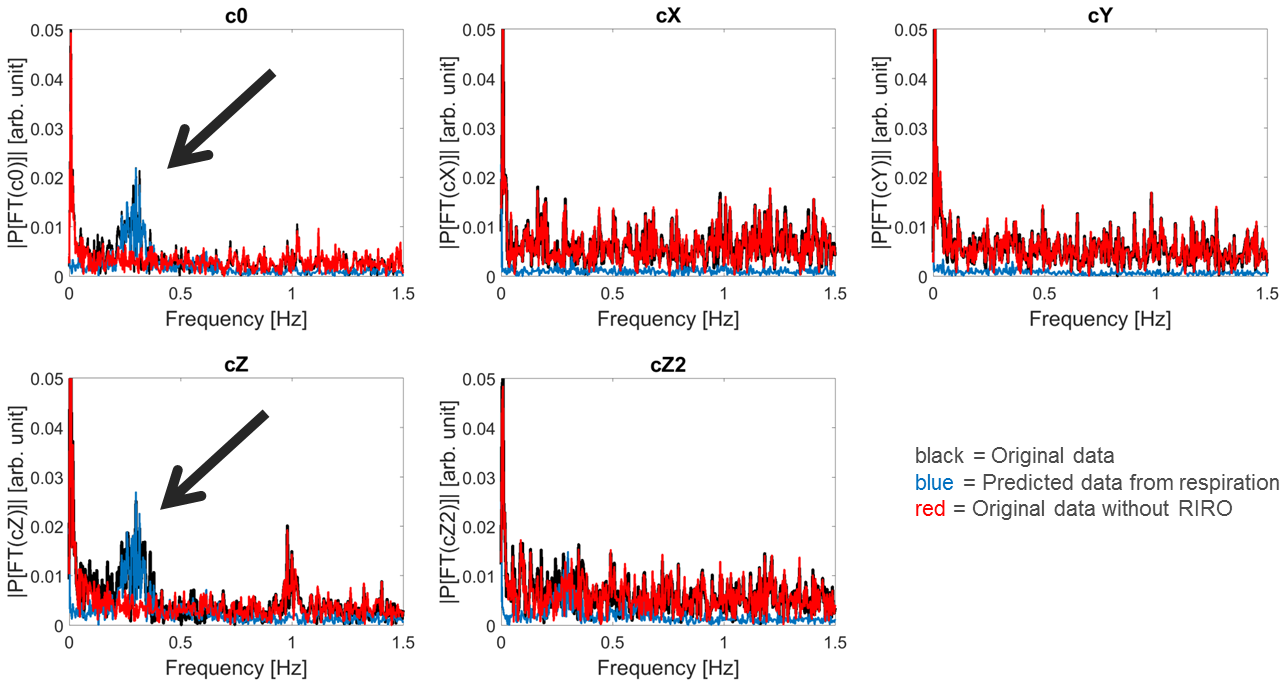
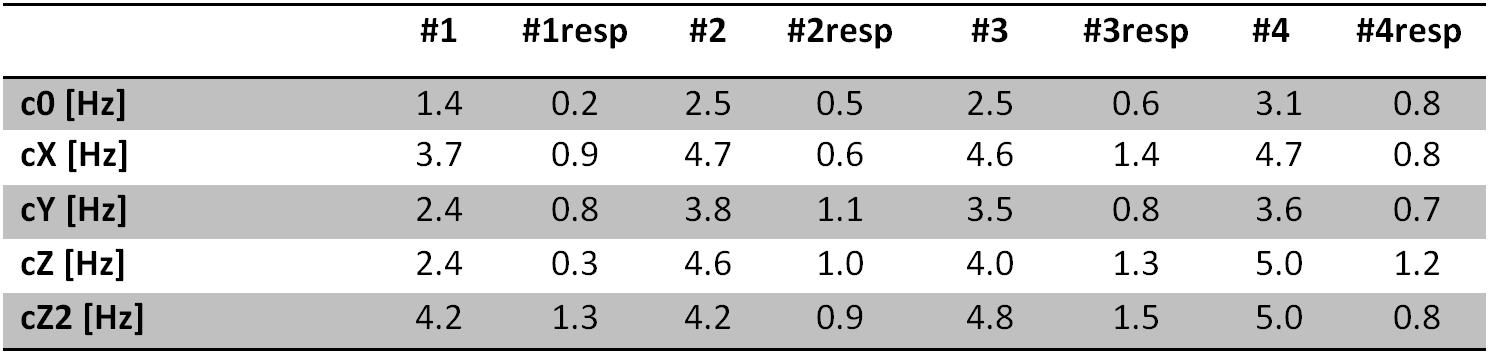
The Fourier Transform (FT) of the different components of the B0-field fluctuations were analyzed over the experiments’ course. The power spectra depicted in Figure 1 suggest that B0-field fluctuations resulting from normal respiration are very volunteer-specific and exhibit individual spatial dynamics. This can be seen from the peaks that correlate with respiration (between 0.25 and 0.4 Hz) appearing in different terms of the spherical harmonic basis function. An example data set describing the resonance offset, the respiration-induced resonance offset (RIRO) and the resonance offset without the RIRO from the cX term of volunteer 1 is depicted in Figure 2. In order to verify the model, the power spectrum of the resonance offset from all 5 terms was calculated. An example set of power spectra is depicted in Figure 3. The respiration-dependent peaks in c0 and cZ were reduced to noise, which indicates that the individual model could successfully model the RIRO. The maximum measured and simulated resonance offsets for all 5 terms of the 4 volunteers are listed in Table 1. The estimated RIRO agrees with results from 3.Conclusion
For the conditions of normal breathing a trained ANN allowed for the prediction of respiration-induced B0-field variations for the c0, cX, cY, cZ, cZ2 terms. The observed respiration-induced B0-field variation in the brain reached maximum values of approximately 1.5 Hz for all 4 volunteers at 3 Tesla. Furthermore it was observed that the B0-field fluctuations resulting from normal respiration highly depend on the volunteer and show individual spatial dynamics. The results presented demonstrate that it is possible to model the influence of respiration by ANN with a volunteer-specific model. However the individual characteristic of the effects suggest that it will be difficult to build one general model for all subjects.Acknowledgements
This work was funded in part through the NIH grant 2R01DA021146 and in part through cooperation with Siemens. The authors acknowledge Dr. Gudrun Ruyters and Matthias Gebhardt for valuable discussions.References
1. Brooks J et al., Physiological noise in brainstem fMRI. Doi: 10.3389/fnhum.2013.00623
2. Ray D et al., A model for susceptibility artefacts from respiration in functional echo-planar magnetic resonance imaging. Phys Med Biol 2000;45:3809-3820
3. Zahneisen B et al., Quantification and Correction of Respiration Induced Dynamic Field Map Changes in fMRI Using 3D Single Shot Techniques. Mag Reson Med 2014;71:1093-1102
4. Andersen M et al., Measuring Motion-Induced B0-Fluctuations in the Brain Using Field Probes Magn Reson Med 2016;75:2020-2030
5. Duerst Y et al. Real-Time Feedback for Spatiotemporal Field Stabilization in MR Systems Magn Reson Med 2015;73:884-893
6. Barmet et al. Spatiotemporal magnetic field monitoring for MR. Magn Reson Med 2008;60:187–197.
Figures