0682
Automated Quality Evaluation Index for 2D ASL CBF Maps1Department of Radiology, University of Pennsylvania, Philadelphia, PA, United States, 2Department of Neurology, University of Pennsylvania, Philadelphia, PA, United States
Synopsis
We propose an automated Quality Evaluation Index (QEI) for evaluating the quality of cerebral blood flow (CBF) maps obtained using arterial spin labeling (ASL). Agreement between the proposed QEI and human ratings was comparable to that between human ratings. Poor quality CBF maps as assessed by QEI significantly correlated with lower test-retest reliability of mean CBF in different regions of interest for elderly control subjects. The proposed QEI can potentially be used in large-scale studies to automatically identify and discard degraded data from analysis, thereby reducing human effort and potential user bias.
Introduction
Cerebral blood flow (CBF) maps derived from Arterial Spin Labeling (ASL)1, 2 are susceptible to artifacts due to low signal to noise ratio and sensitivity to motion. ASL quality control is typically performed through visual inspection of the CBF maps, which is subjective, has the potential for bias, and may be challenging to perform in large sample size. We propose a quality evaluation index (QEI) for automated objective quality evaluation of CBF maps.Materials and Methods
Two experienced neuroradiologists (R.L.W. and S.A.N) visually rated 100 CBF maps in a scale between 1 and 4, corresponding to unacceptable (1), poor (2), average (3) and excellent (4) quality respectively. The CBF maps were obtained using 2D Pulsed ASL (PASL) or 2D pseudo continuous ASL (PCASL) from young and elderly controls, patients with Mild Cognitive Impairment (MCI), Alzheimer’s disease, Parkinson’s Disease, and traumatic brain injury. These ratings were used to analyze the characteristics of the CBF maps, develop and validate the QEI.
Proposed Quality Evaluation Index (QEI)
The QEI is designed to be a numerical value between 0 and 1 with higher number implying higher quality CBF map. The factors considered are as follows.
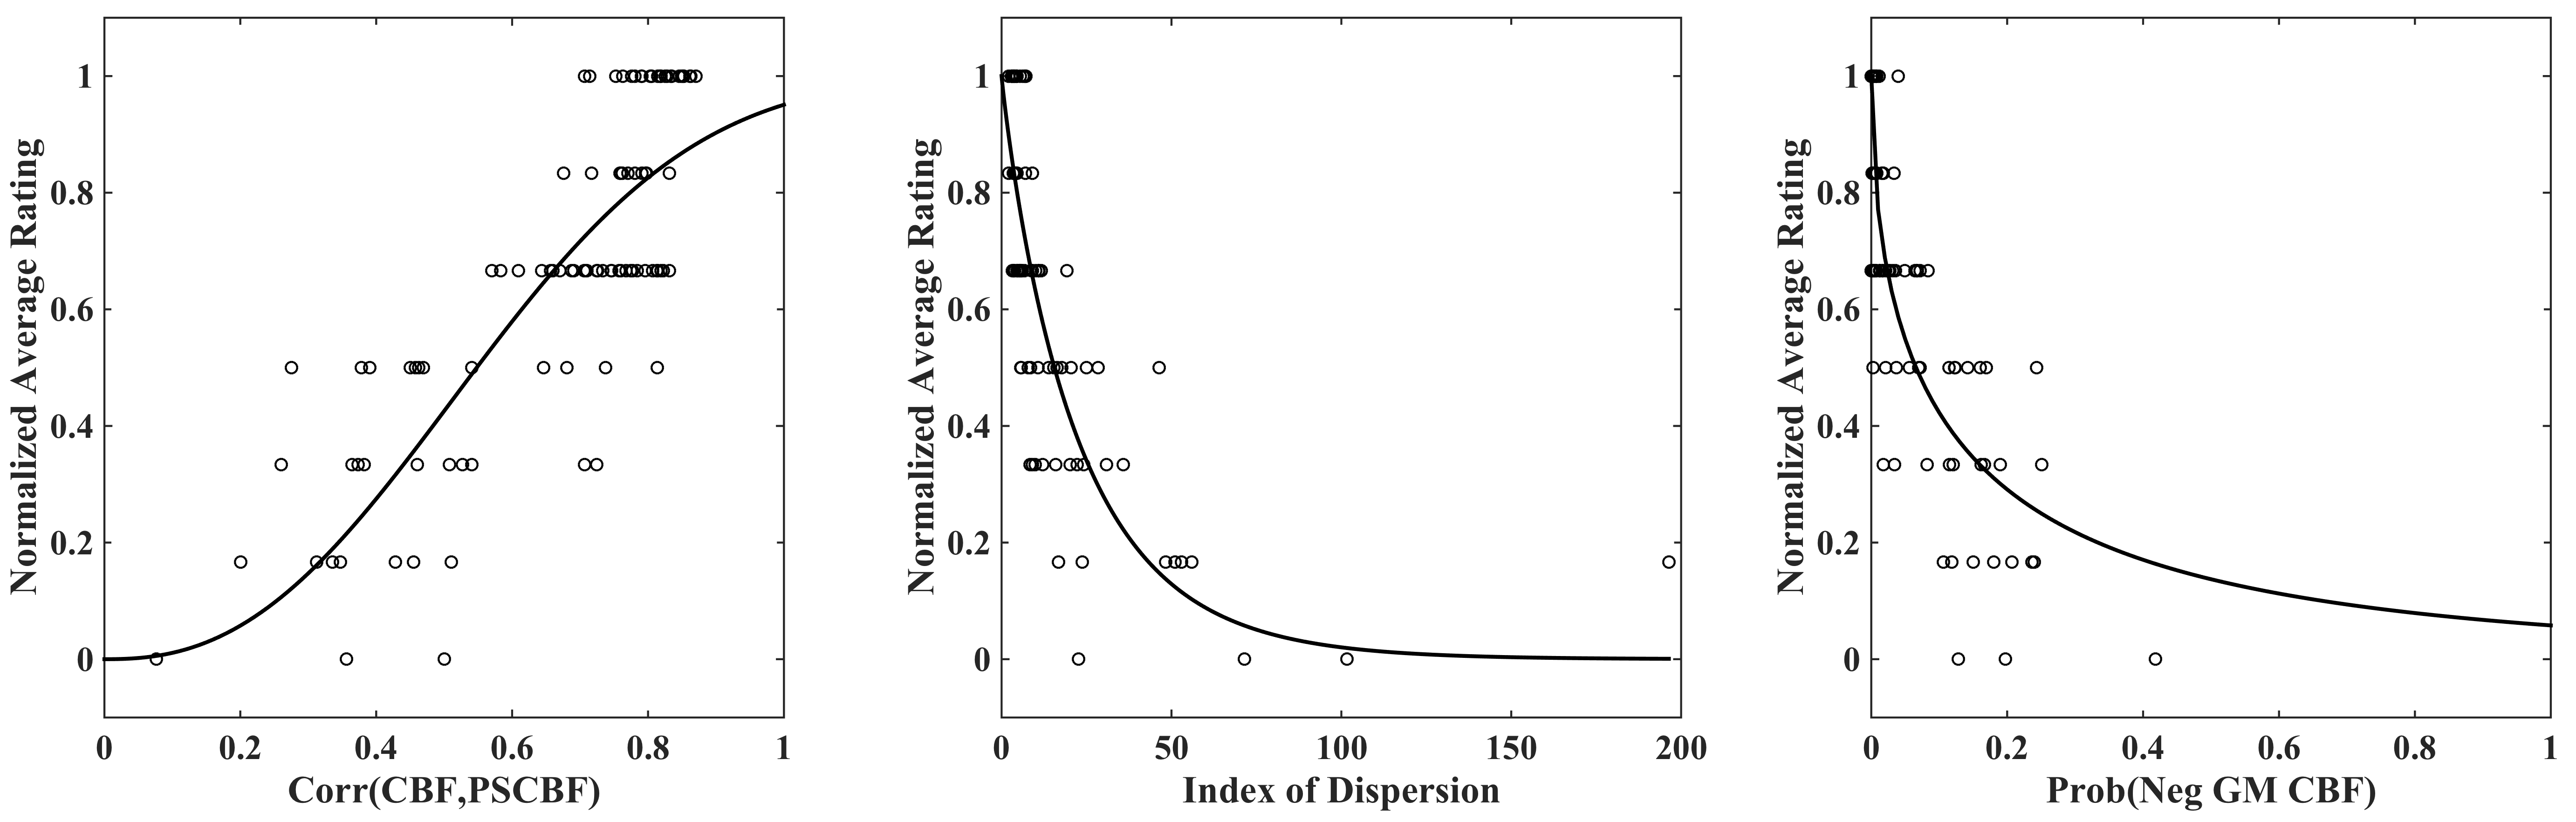
Structural Similarity: Structural images were segmented into grey matter (GM), white matter (WM) and cerebro-spinal fluid (CSF) tissue probability maps (TPMs). ''Pseudo structural CBF''(PSCBF) maps were constructed for each subject by 50GMTPM+20WMTPM, assuming mean CBF in GM and WM to be 50 and 20 respectively. Pearson’s correlation coefficient between PSCBF and actual CBF map for each subject was considered one metric.
Spatial Variability: ASL CBF maps can have abnormally large spatial variability because of extremely large or small values resulting from motion artifacts. Use of a post labeling delay significantly shorter than the arterial transit time can also lead to such artifacts due to apparent hypoperfusion in certain regions of the brain, as well as large signals due to retained label in arteries. We considered the pooled variance of GM, WM and CSF CBF and normalized by the mean GM CBF (obtaining a measure of Index of dispersion = variance/mean).
Negative GM CBF: Percentage of voxels in GM with negative CBF was a final metric.
Figure 1 shows the scatter plots between the metrics and the average ratings (R) from the two raters, where the ratings were normalized in [0,1] range. The ratings approximately follow a $$$(1-\exp(-\alpha x^\beta))$$$ relationship with structural similarity and a $$$\exp(-\alpha x^\beta)$$$ relationship with the other two metrics, where $$$x$$$ stands for the different metrics. Consequently, we fitted models of these forms to the data to compute $$$\alpha$$$’s and $$$\beta$$$’s for each criterion, and the final QEI was computed as the geometric mean of the terms.
Validation of the QEI
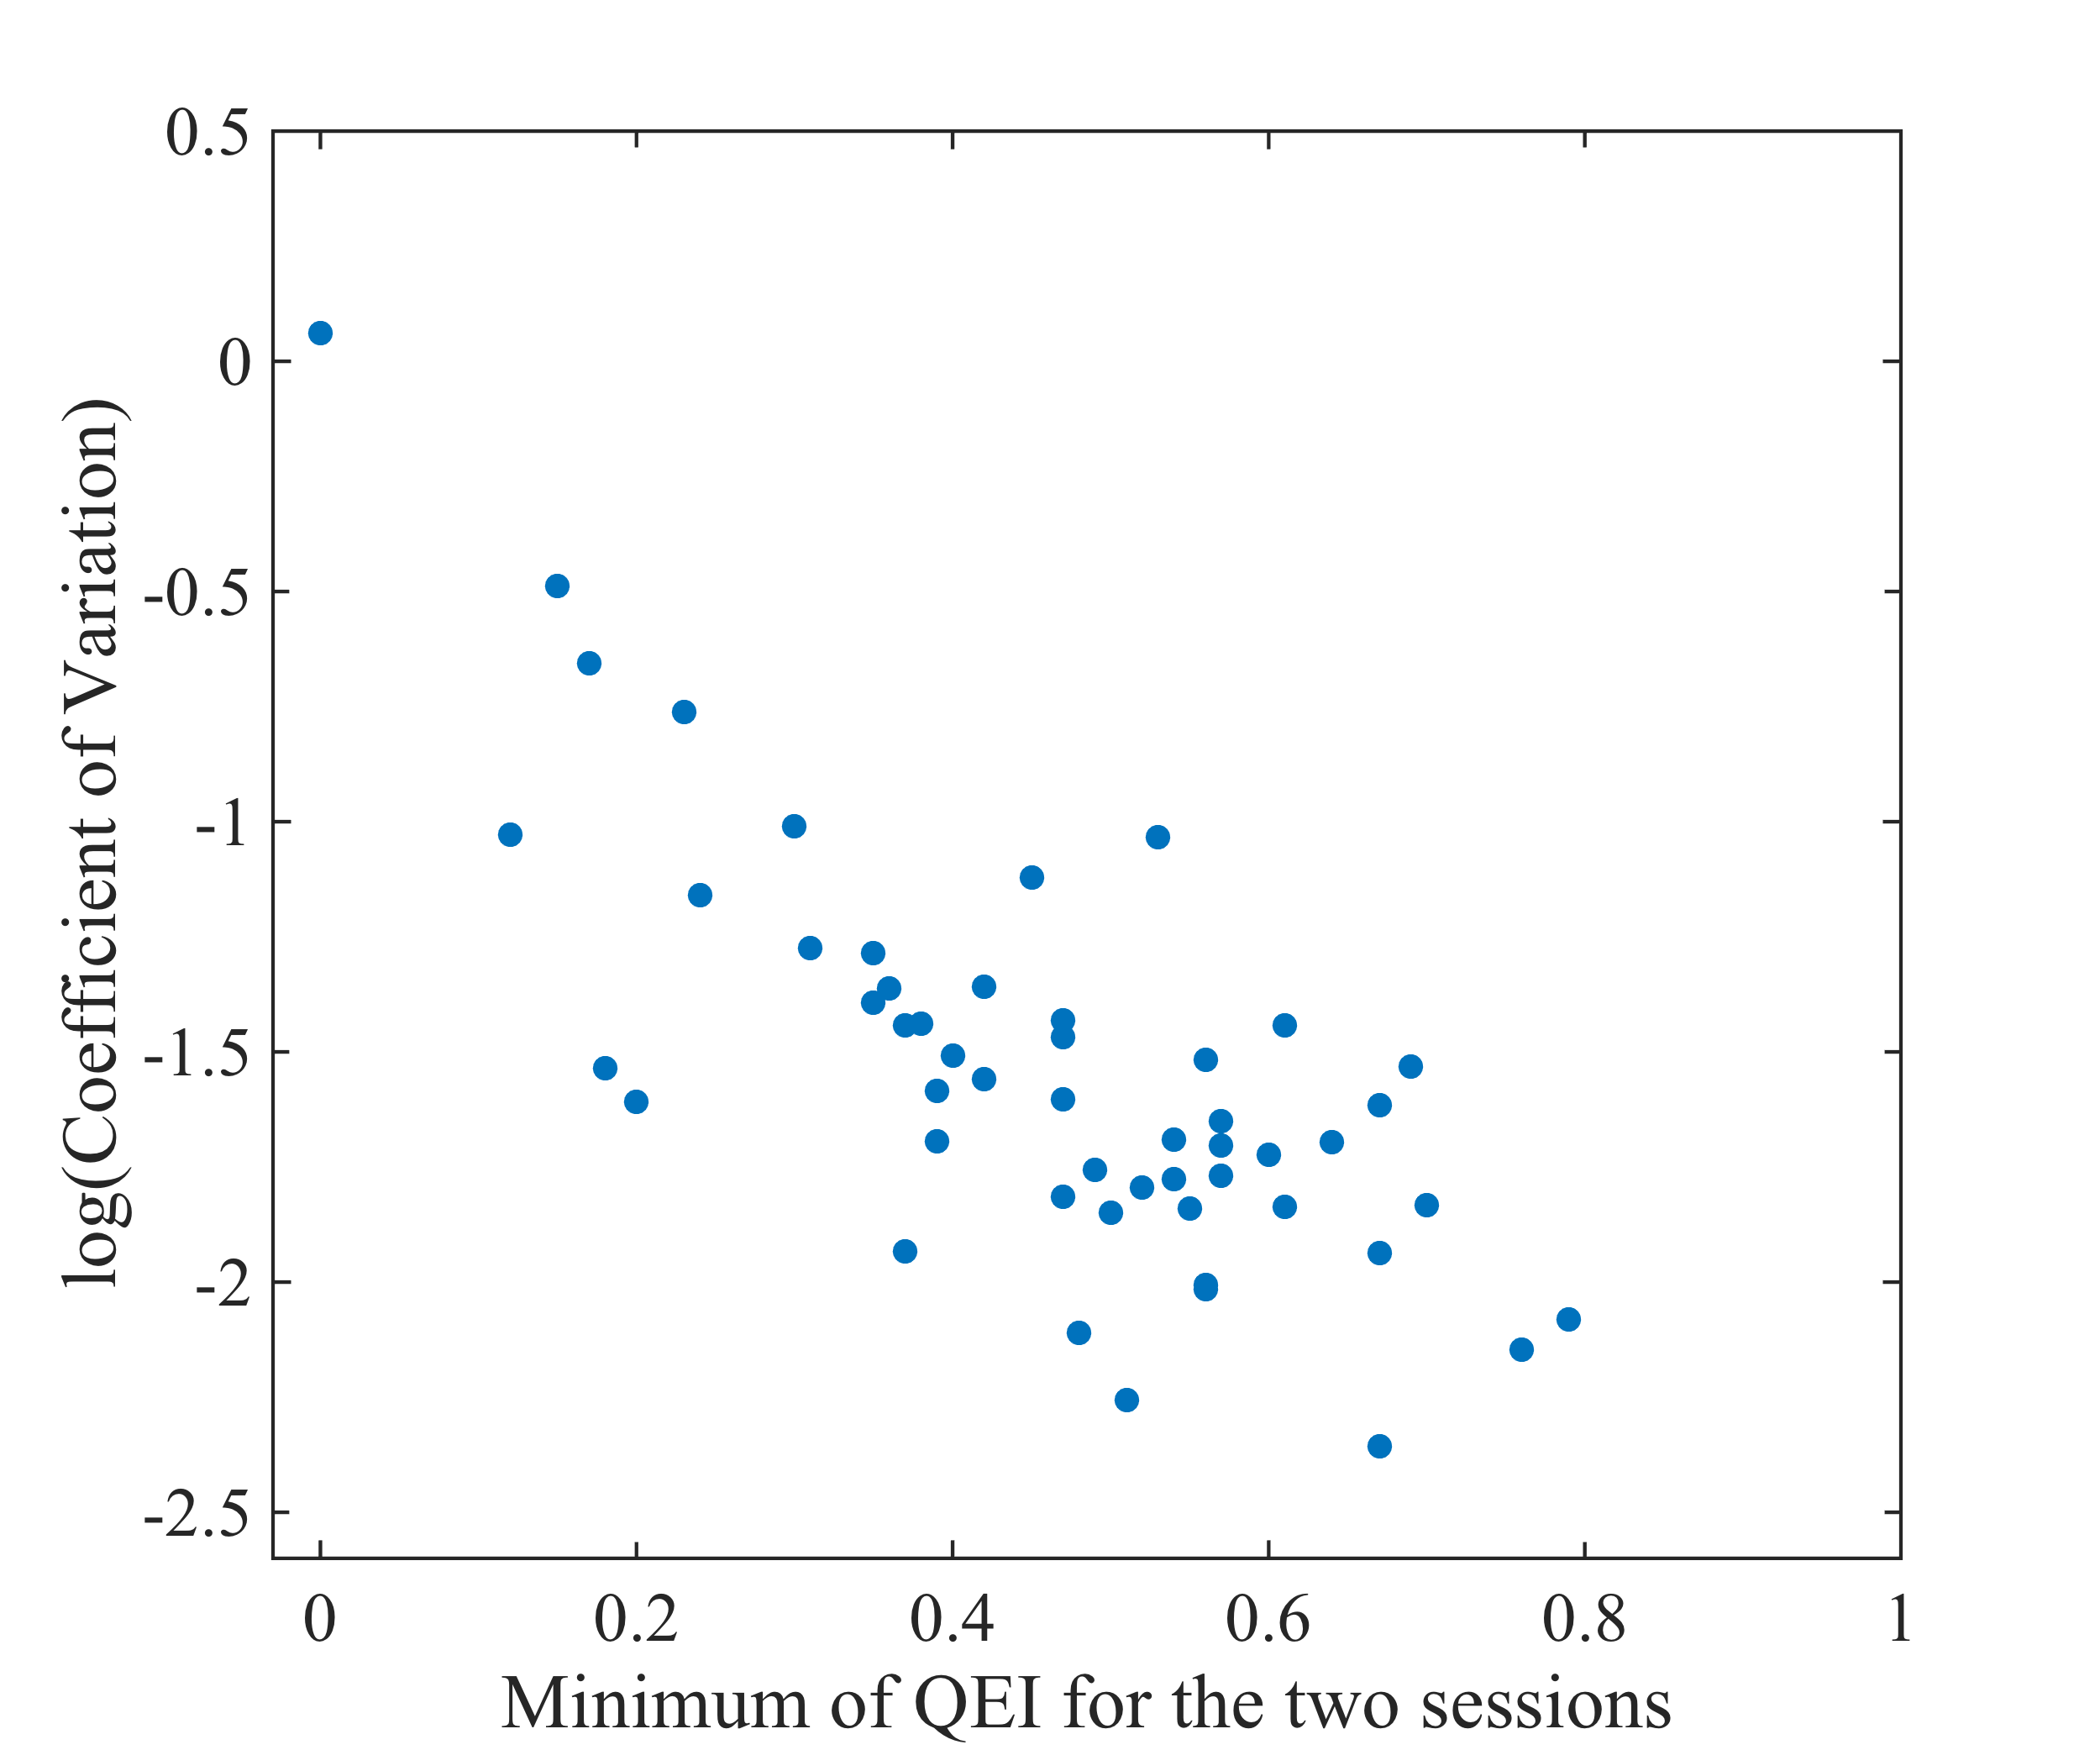
In order to validate the QEI, a leave-one-out cross validation procedure was implemented, and the correlation between QEIs of the remaining CBF maps with the visual ratings in each case was computed. Next, the unacceptable and poor maps judged by either of the raters were separated from the rest and the area under the receiver operating characteristic (ROC) curve of this classification was computed. For further validation of the QEI, we considered ASL data of 53 control subjects from Alzheimer’s Disease Neuroimaging Initiative (ADNI) study.3 Mean CBF values in all the ROIs from the AAL atlas were extracted from ASL data acquired 3 months apart. Their degree of agreement, assessed by coefficient of variation (CV; higher inter-session agreement implies lower CV)4 was analyzed as a function of the poorer QEI between the two sessions for each subject with the hypothesis that lower minimum QEI will lead to lower agreement. The QEI for this data was computed with the $$$\alpha$$$’s and $$$\beta$$$’ estimated from the previous data set.
Results and Discussion
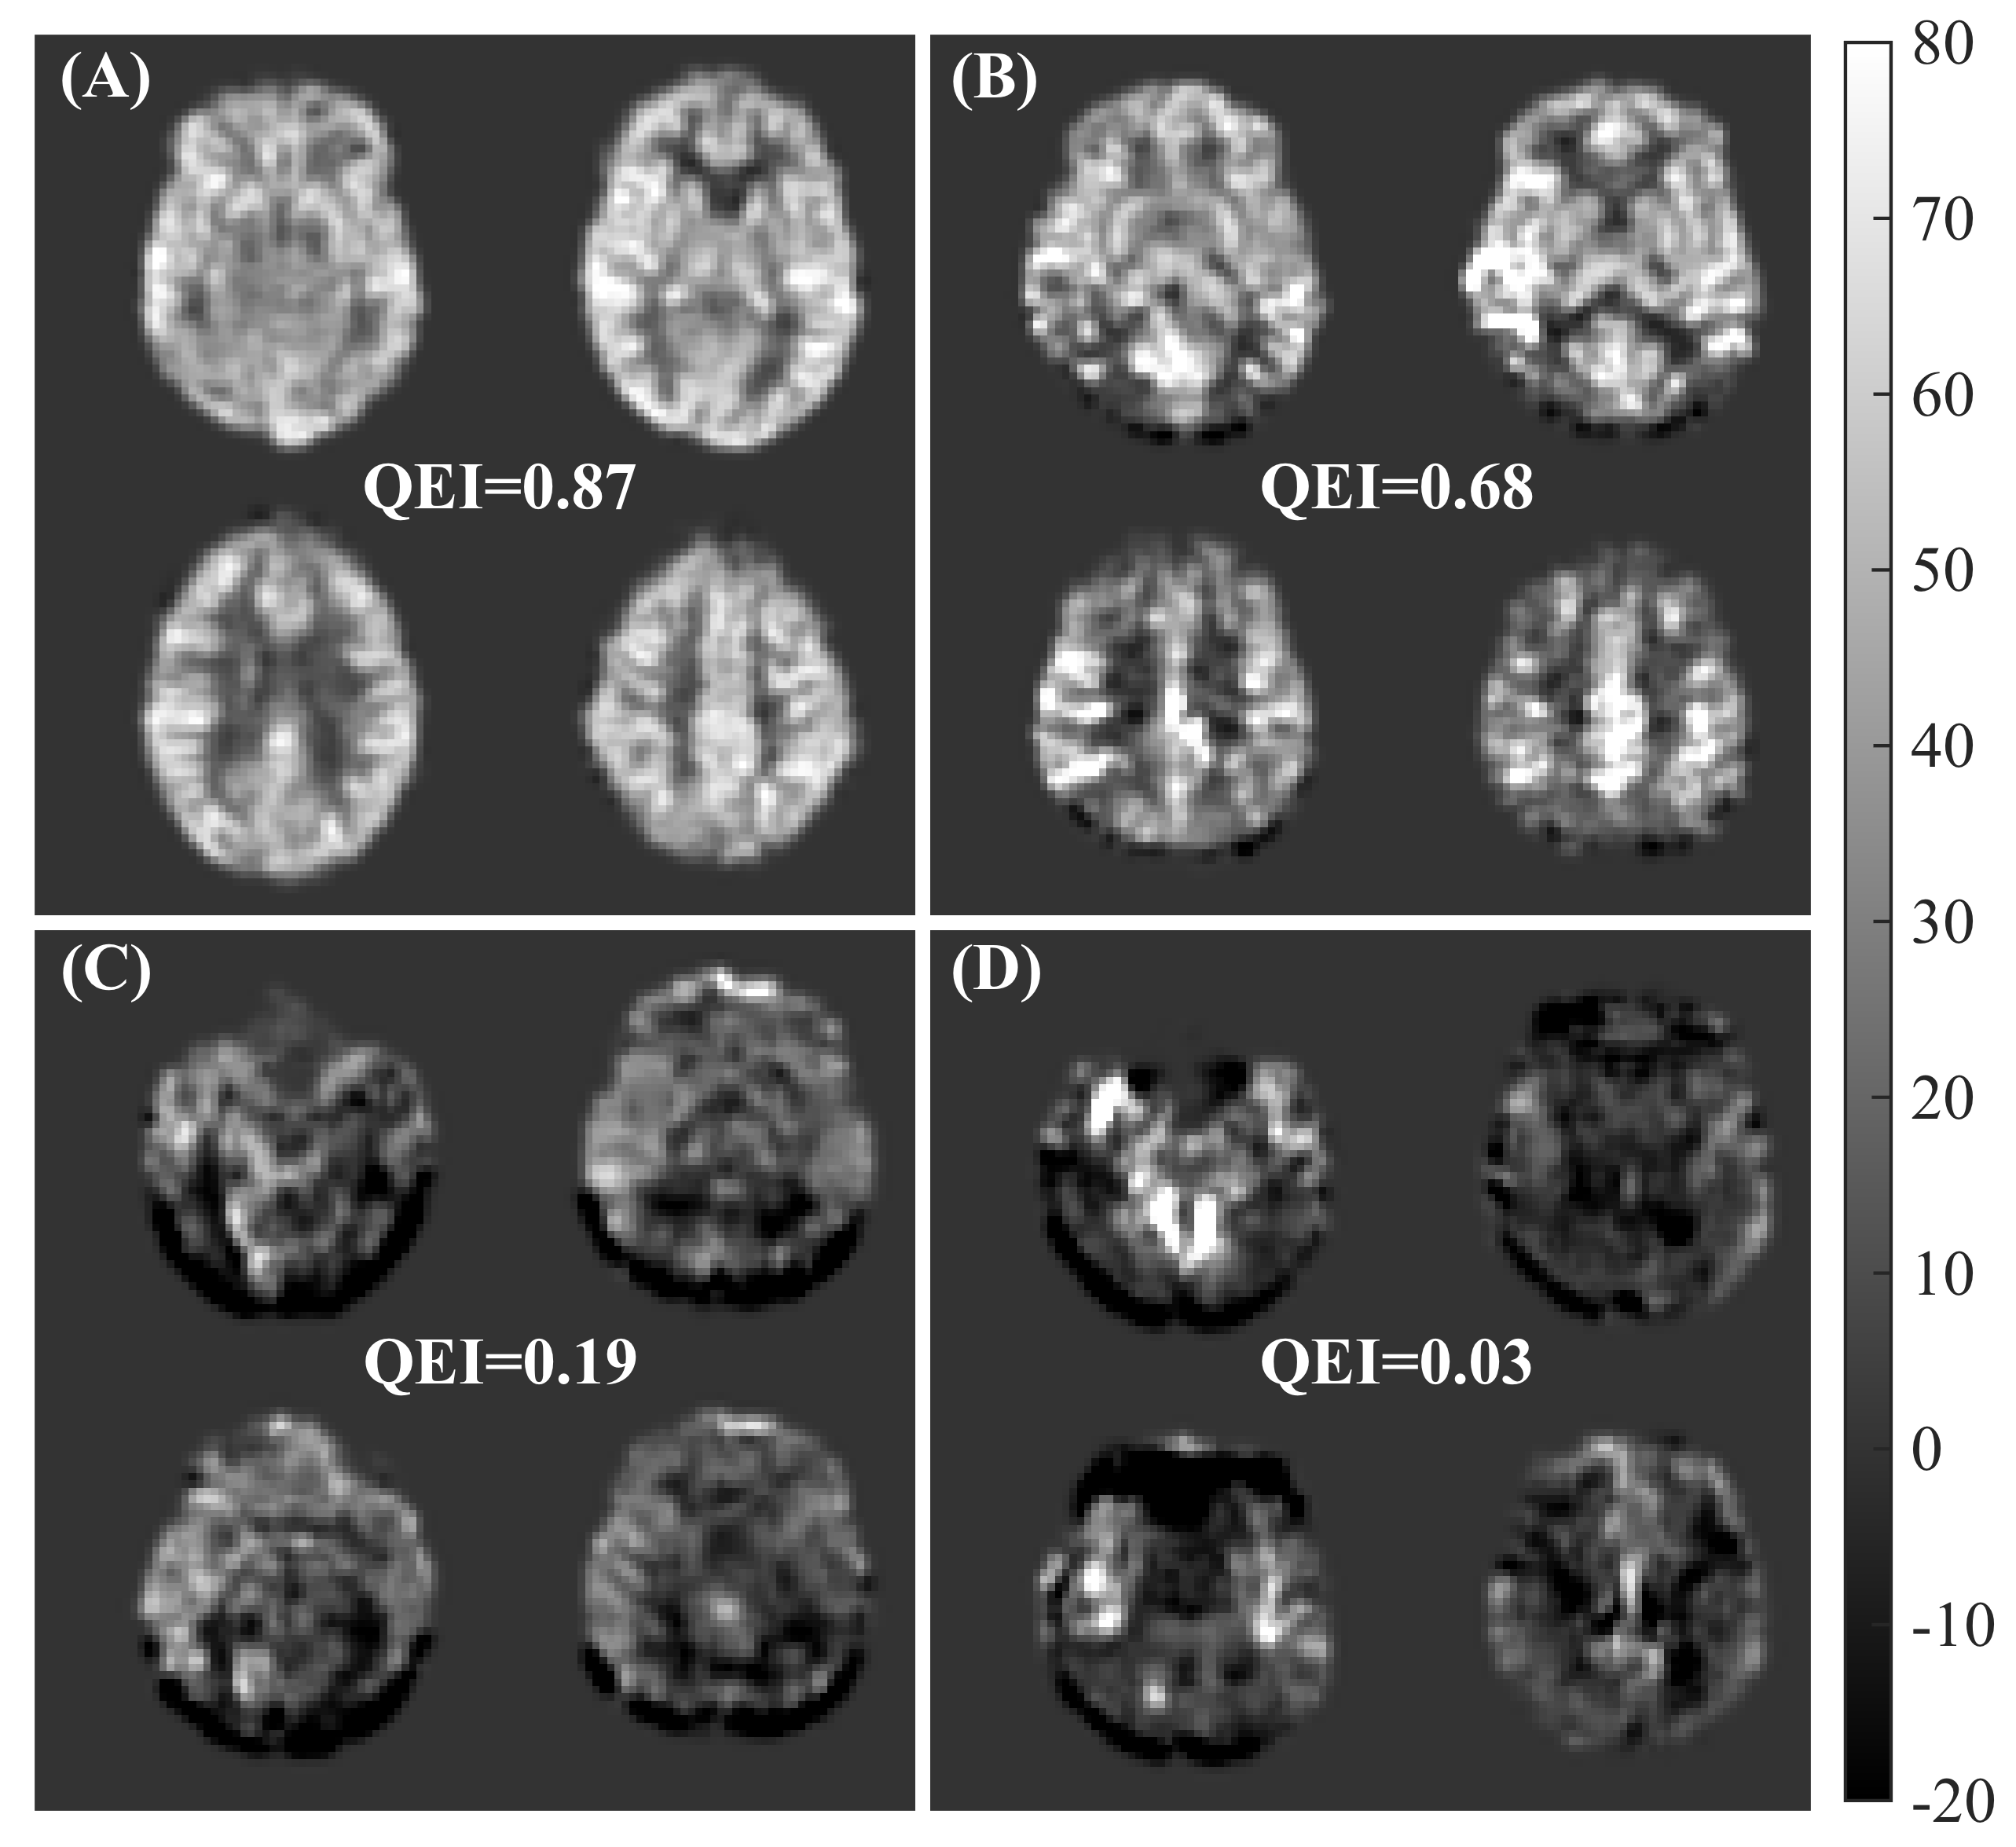
The correlation between the two sets of human ratings was 0.81 (p<0.0001) and between the automated QEI and the mean of the two sets of ratings was 0.83 (p<0.0001) in the leave-one-out cross-validation test. Hence agreement between automated and average of human ratings was comparable to that between human ratings. The variabilities in $$$\alpha$$$’s and $$$\beta$$$’s were less than 3% of their mean values. Figure 2 shows representative cases. Accuracy was high in distinguishing unacceptable and poor CBF maps from the rest with area under the ROC curve 0.96. Finally, from figure 3, it can be seen that the CV improved when the QEI was high for both the sessions. The correlation between the lower QEI and log(CV) was -0.74 (p<0.0001). Future work will assess the applicability of the proposed QEI to background-suppressed 3D ASL MRI data.Acknowledgements
NIH grants R01 MH080729 and P41 EB015893 and Alzheimer’s Disease Neuroimaging Initiative (ADNI) study.References
1. Detre JA, Leigh JS, Williams DS, Koretsky AP. Perfusion imaging. Magnetic resonance in medicine. 1992; 23: 37-45.
2. Alsop DC, Detre JA, Golay X, et al. Recommended implementation of arterial spin-labeled perfusion MRI for clinical applications: A consensus of the ISMRM perfusion study group and the European consortium for ASL in dementia. Magnetic resonance in medicine. 2015;73:102-116.
3. http://adni.loni.usc.edu.
4. Dolui S, Wang Z, Shinohara RT, Wolk DA, Detre JA. Structural Correlation-based Outlier Rejection (SCORE) algorithm for arterial spin labeling time series. Journal of magnetic resonance imaging. 2016; doi: 10.1002/jmri.25436.
Figures