0681
A Calibrated Perfusion Phantom for Quality Assurance of Quantitative Arterial Spin Labelling.1Gold Standard Phantoms Limited, London, United Kingdom, 2Medical Physics and Biomedical Engineering, UCLH NHS Trust, London, United Kingdom, 3Institute of Neurology, University College London, London, United Kingdom, 4Lysolm Department of Neuroradiology, National Hospital for Neurology and Neurosurgery, London, United Kingdom
Synopsis
Arterial Spin Labelling shows great promise for perfusion measurements, however its clinical adoption is precluded by the lack of a standardised phantom to validate such measurements. A perfusion phantom specially designed and built for optimal use with clinical ASL sequences is presented, alongside characterisation results. Measurements of perfusion rate and arterial transit time were made using a multi-TI FAIR PASL sequence. Results indicate the phantom has good stability, high SNR and exhibits perfusion rates and arterial transit times that are comparable with human physiology.
Introduction
Recent European1 and International2 efforts to provide consensus and standardisation of Arterial Spin Labelling (ASL) have resulted in recommended implementations for data acquisition and analysis3. However, its introduction as a clinical diagnostic tool is hampered by the scarcity of a standardised phantom to validate such measurements. We present the development and initial characterisation of a perfusion phantom fulfilling the requirements needed to become a standard for ASL perfusion imaging.Materials and Methods
A perfusion phantom system*, depicted in figure 1.a, was constructed in-house for the purposes of this study. The perfusion exchange unit, shown in figure 1.b consists of two acrylic vessels; a labelling chamber, and a perfusion chamber. Flowing perfusate (Distilled Water Glycerine Mix, 22.85% v/v) enters the labelling chamber into a 6mm ID tube located centrally, surrounded by a large quantity of distilled water, maximising B0 homogeneity. It then flows into the perfusion chamber, where flow is diverted to sixty 1mm diameter ‘arterioles’ that feed a six 4.75mm layer stack of porous UHMW polyethylene (32% porosity, mean pore size 7um, Vyon M, Porvair Filtration Group Ltd, UK), chosen to simulate the capillary bed. Computational Fluid Dynamics simulations optimised the design so that arterial transit times (ATT) and perfusion rates (CBF) are physiologically representative.
Perfusate is pumped around the system using two piezoelectrically operated diaphragm pumps (BPH-414D, Nitto Kohki Europe LTD, UK), driven by a custom PCB with on-board microcontroller, piezo drive amplifier, flow sensing circuitry. A UKAS calibrated flowmeter (FT2, Titan Enterprises Ltd, UK) continuously measures the flow rate and a PID algorithm runs on the microcontroller to control flow rate (setpoint 350ml/min). All are housed in a custom RF shielded aluminium enclosure. The measured flow rate is continuously transmitted by Bluetooth to a data logging computer. A reservoir consisting of an 8m coil of 8mm ID tubing ensures that the perfusate does not recirculate for at least 30s after labelling. All components are mounted to a PVC base plate, which can be split to isolate the perfusion exchange chamber from mechanical vibrations induced by gradient eddy currents in the aluminium pump enclosure.
The perfusion phantom was evaluated on a 3T Siemens Prisma (Siemens Healthcare, Erlangen, Germany), running syngo MR E11, using the product ASL package; Multi TI (350-2600ms, interval 250ms), Background Suppressed FAIR PASL with 3D GRASE readout: 3-averages, 4-shot segmented acquisition, 32 partitions, 3mm slice thickness, FOV 170x170mm, 64x62x32 imaging matrix, TR=4000ms, TE/DeltaTE=14.12ms, BW=2298Hz/pixel. T1 of the perfusate was calculated from the control images of the FAIR PASL acquired with successive TR values (2, 3, 4, 6 and 8s). A mono-exponential saturation recovery curve was fitted to the data via the least-squares method on a voxel-wise basis. The measured value for the T1 of the pure perfusate was used for CBF quantification. ΔM images were fitted to the General Kinetic Model4 using FSL’s5 BASIL package6 to obtain CBF and ATT images. ROIs corresponding to four quadrants were generated (figure 2.b) and used for calculating ΔM signal curves, and statistics of CBF and ATT values.
*Patent pending
Results
Throughout MRI scanning the measured flow rate was 350.0±1.1 ml/min (1 S.D.). Measured T1 values were 3017±61ms. ΔM images for a single slice over the range of TI values are shown in figure 2.a. Figure 2.c shows the expected PASL inflow kinetics for the four quadrant ROIs.
CBF maps for all slices within the porous material stack are shown in figure 3.a. ATT maps are shown in figure 3.b. Values for the mean CBF and ATT for each quadrant ROI and slice are shown in table 1.
Discussion
Flow rate fluctuations were maintained by the pump controller to within 2% of the setpoint value.
Despite only acquiring three averages, the SNR of the ASL measurements is high because only the perfusate contributes to the measured signal.
Measured CBF ranged up to 455 ml/100g/min, encompassing expected values in healthy volunteers for perfusion in most of the body, including the brain and renal perfusion.
Measured ATT values are within the expected range for cerebral perfusion. As such single-subtraction CBF quantification is possible using unmodified protocols.
Conclusion
We presented a calibrated perfusion phantom for ASL which exhibits stable flow, physiologically representative CBF and ATT values, and is compatible with state-of-the-art ASL measurement techniques. Further work in validating the phantom is essential, however it shows great promise as a future standard for quantitative ASL measurement validation, sequence development, and quality assurance.Acknowledgements
This work was commissioned and funded by the SBRI Healthcare programme. SBRI Healthcare is an NHS England initiative, championed by the Academic Health Science Networks (AHSNs). The views expressed in the publication are those of the author(s) and not necessarily those of the SBRI Healthcare programme or its stakeholders.
References
1. European Consortium ASL In Dementia (funded through European Union COST Action BM1103). www.aslindementia.org.
2. ASL Network. www.asl-network.org
3. Alsop DC, Detre JA, Golay X, Guenther M, et al. Recommended Implementation of Arterial Spin-Labeled Perfusion MRI for Clinical Applications: A Consensus of the ISMRM Perfusion Study Group and the European Consortium for ASL in Dementia. Magnetic Resonance in Medicine 2015; 73: 102-116.
4. Buxton R, et al. A general kinetic model for quantitative perfusion imaging with arterial spin labelling. Magnetic Resonance in Medicine. 1998; 40: 383-396.
5. Smith SM, et al. Advances in functional and structural MR image analysis and implementation as FSL. NeuroImage 2004; 23(S1): 208-19.
6. Chappel MA, et al. Variational Bayesian inference for a non-linear forward model. IEEE Transactions on Signal Processing 2009; 57(1): 223-236.
Figures
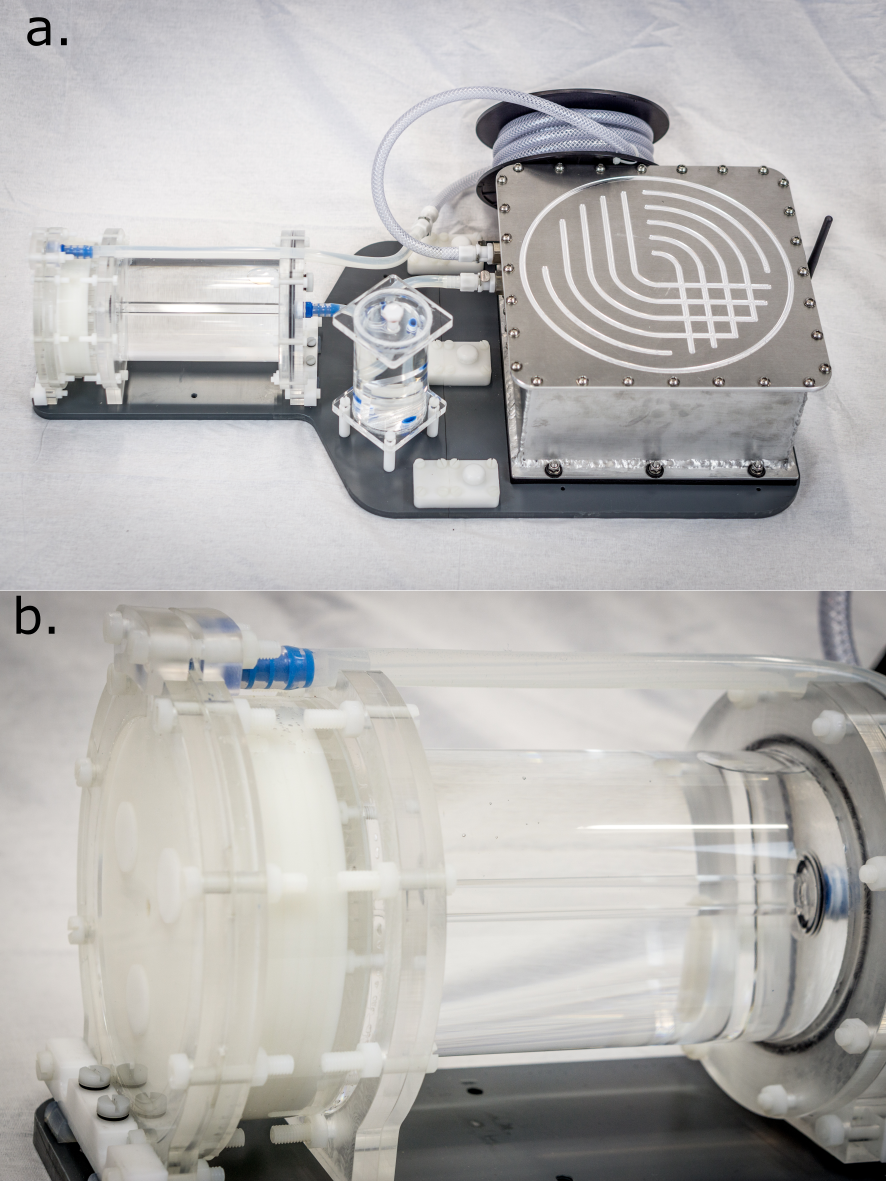
Figure 1:
a. Photo of the entire phantom prototype. From right to left: pump (inside shielded aluminium enclosure), reservoir coil, bubble trap, perfusion exchange unit.
b. Close up of the perfusion exchange unit, consisting of the labelling chamber on the right, and perfusion chamber on the left. The vessel walls are constructed from acrylic tubes and machined plate. Porous UHMW-Polyethylene discs can be seen in the perfusion chamber.
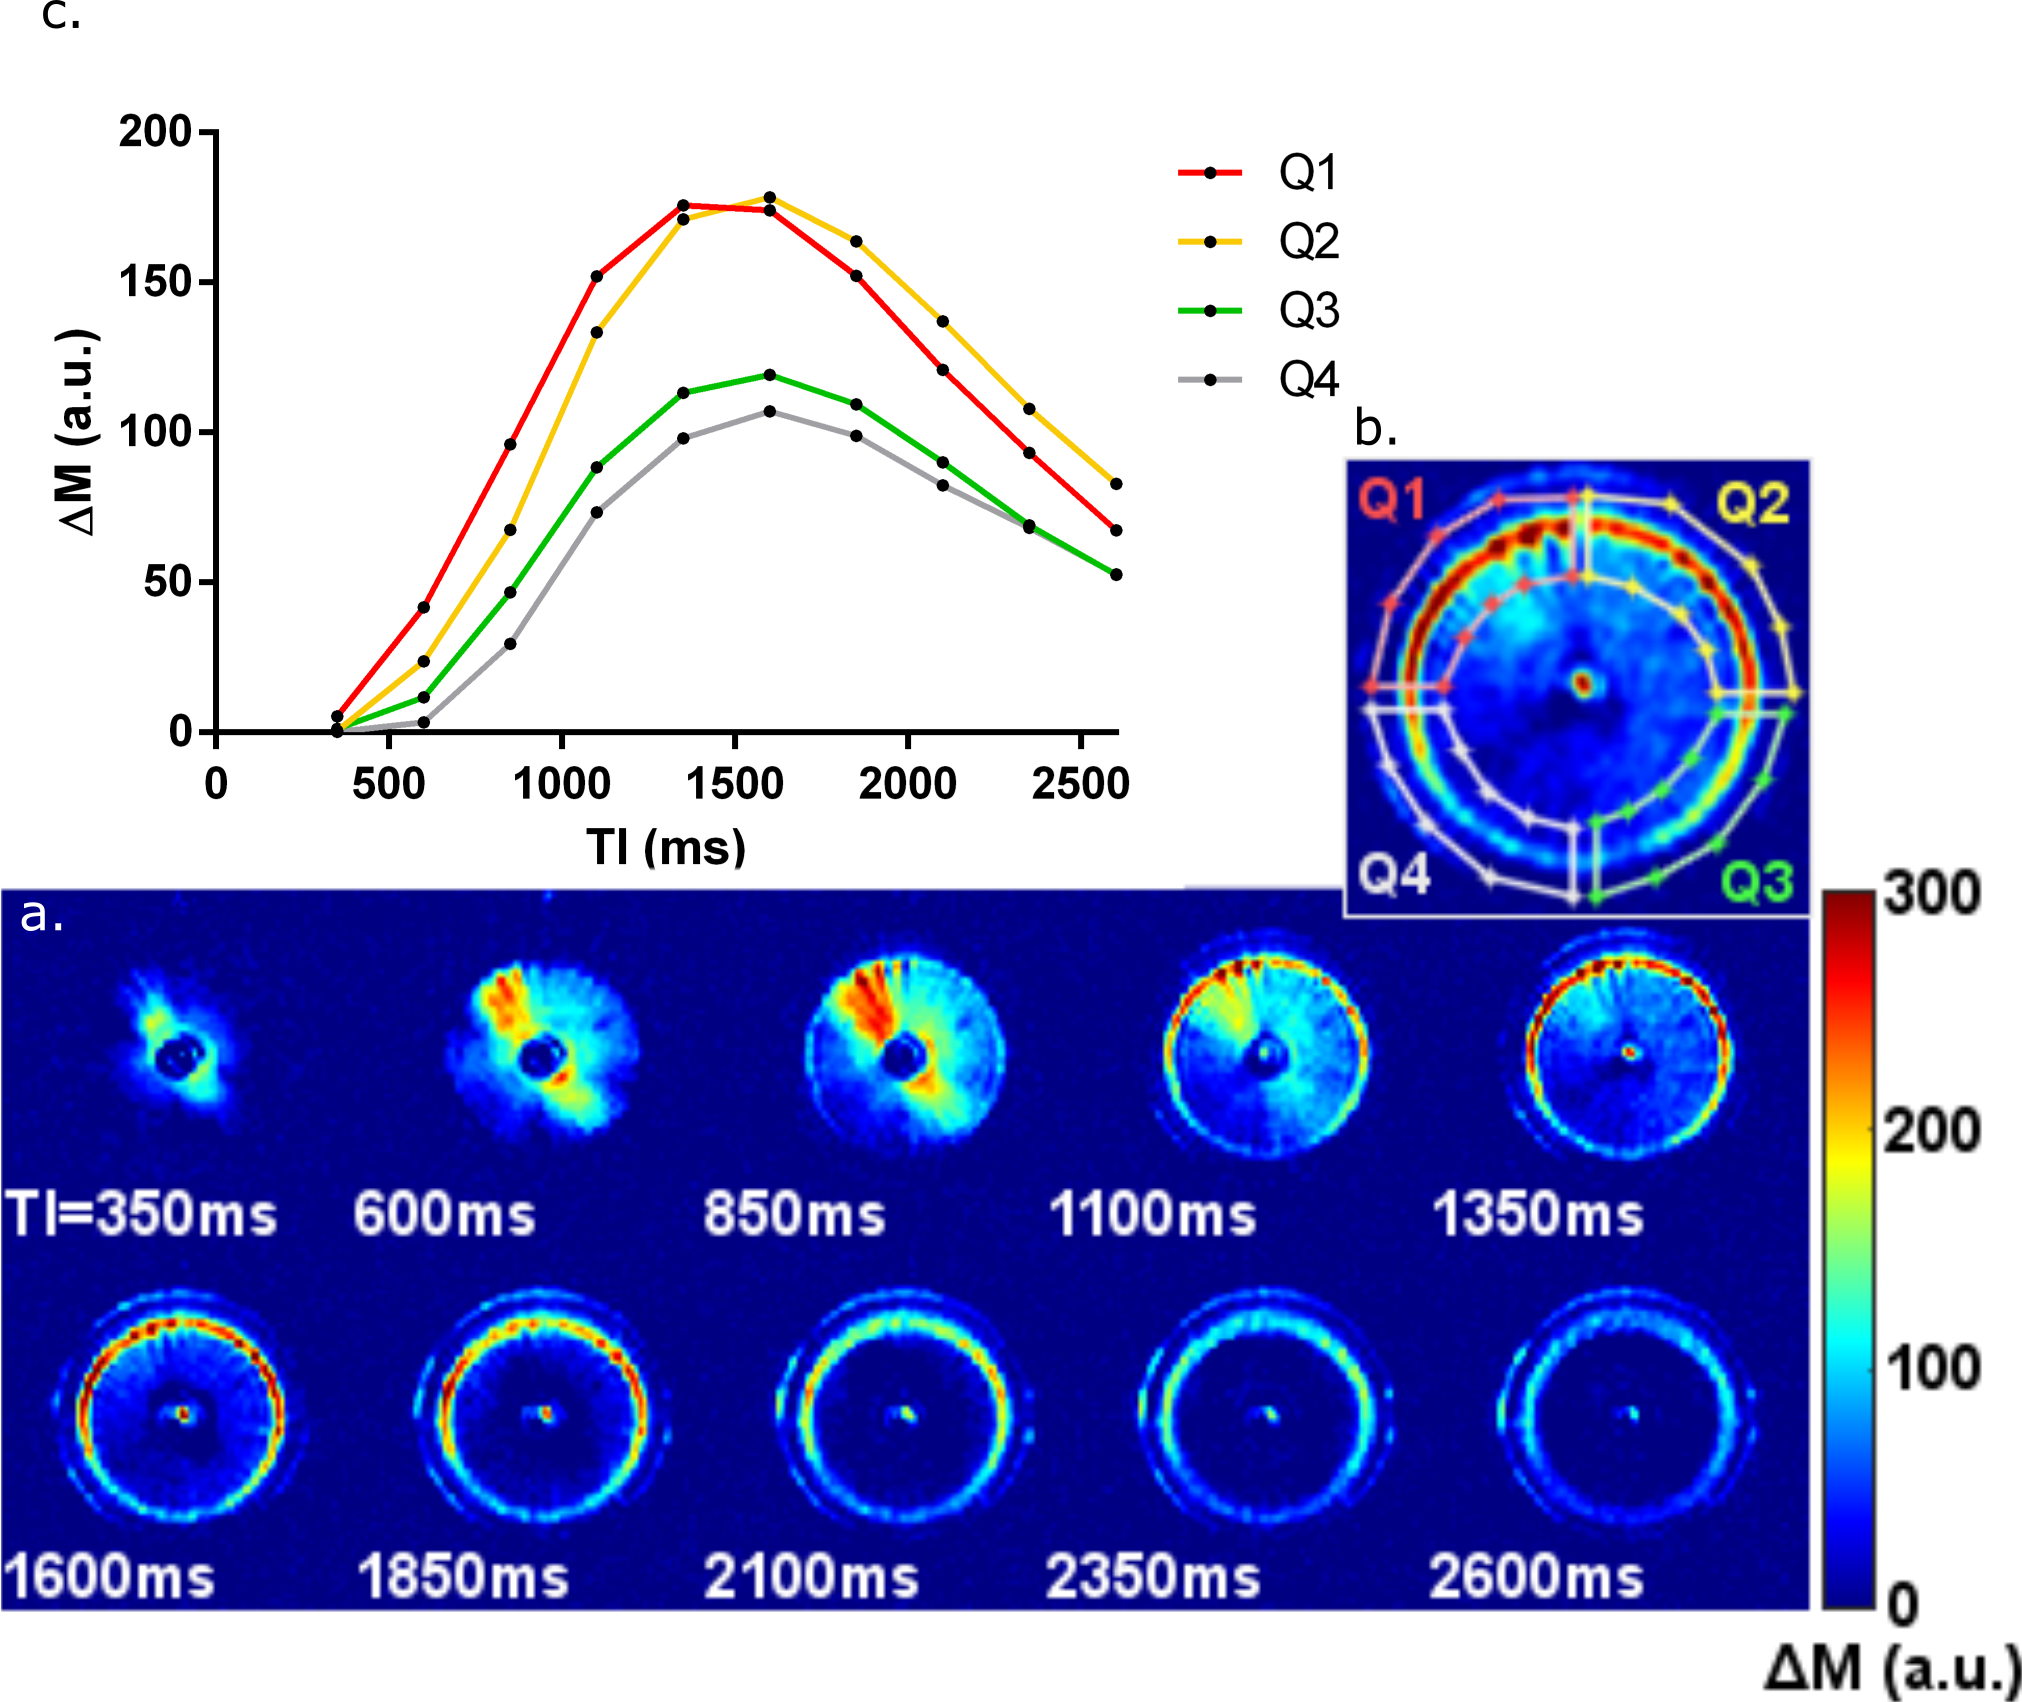
Figure 2:
a. ΔM images of the first slice of the porous material at each acquired TI (a). As this is the first slice it shows the dynamics of the labelled bolus as it travels through the branching region (350 and 600ms), through the arterioles (850-1600ms) and perfusing into the porous material (1850-2600ms) and dispersing.
b. Close up of TI=1350ms image with quadrant ROIs superimposed.
c. Signal curves for the mean signal within each of the four ROIs.

Figure 3:
a. CBF maps within the porous layers. As expected perfusion is mostly concentrated around the input arterioles, however there is also a bloom of perfusion at the edges of the porous material, due to seepage between layers.
b. Arterial transit time maps within the porous layers.
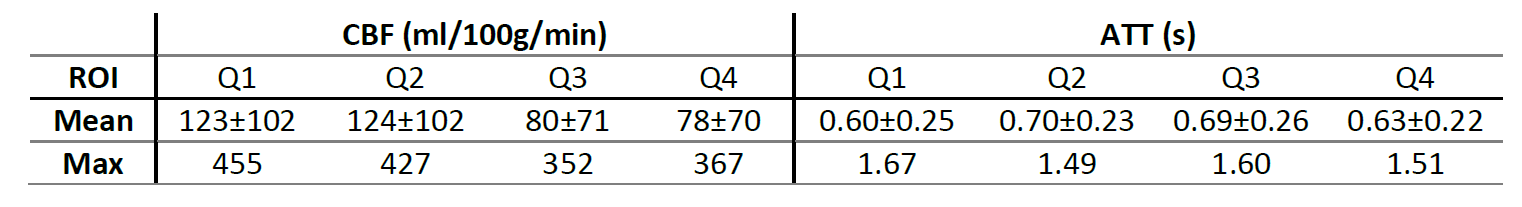
Table 1:
Table of Mean (±1 S.D.), minimum and maximum CBF and ATT values for each ROI across all porous material slices. Values cover the physiological range for expected grey matter and white matter perfusion in a healthy adult. Lower bounds have not been determined due to low SNR.