0679
Cardiorespiratory noise correction improves the ASL signal1Laureate Institute for Brain Research, Tulsa, OK, United States, 2Oxley College of Health Sciences, University of Tulsa, 3Cornell MRI Facility, Cornell University, 4Stephenson School of Biomedical Engineering, University of Oklahoma
Synopsis
The use of ASL fMRI to study brain function is constrained by its low signal-to-noise ratio and large temporal signal variations. We evaluated the influence of cardiorespiratory activity on the amount of variance in resting state and task based ASL data via several different physiological noise models. We further tested the utility of physiological noise correction approaches by pharmacologically inducing cardiorespiratory fluctuations and evaluating for improvements in the ASL signal. We found that regressing out these non-neuronal, cardiorespiratory-related signal variations substantially improved the ASL signal, offering an important advance for quantitative studies of cognitive processes.
Purpose
To evaluate
the influence of cardiorespiratory activity on the amount of variance in ASL
fMRI data and to examine the effectiveness of different models in suppressing
this cardiorespiratory-related ‘noise.’ We hypothesized that cardiorespiratory activity
produces synchronized (short-term) and non-synchronized (delayed) fluctuations
in the ASL signal, representing a non-neuronal process that can be modeled and
corrected.
Method
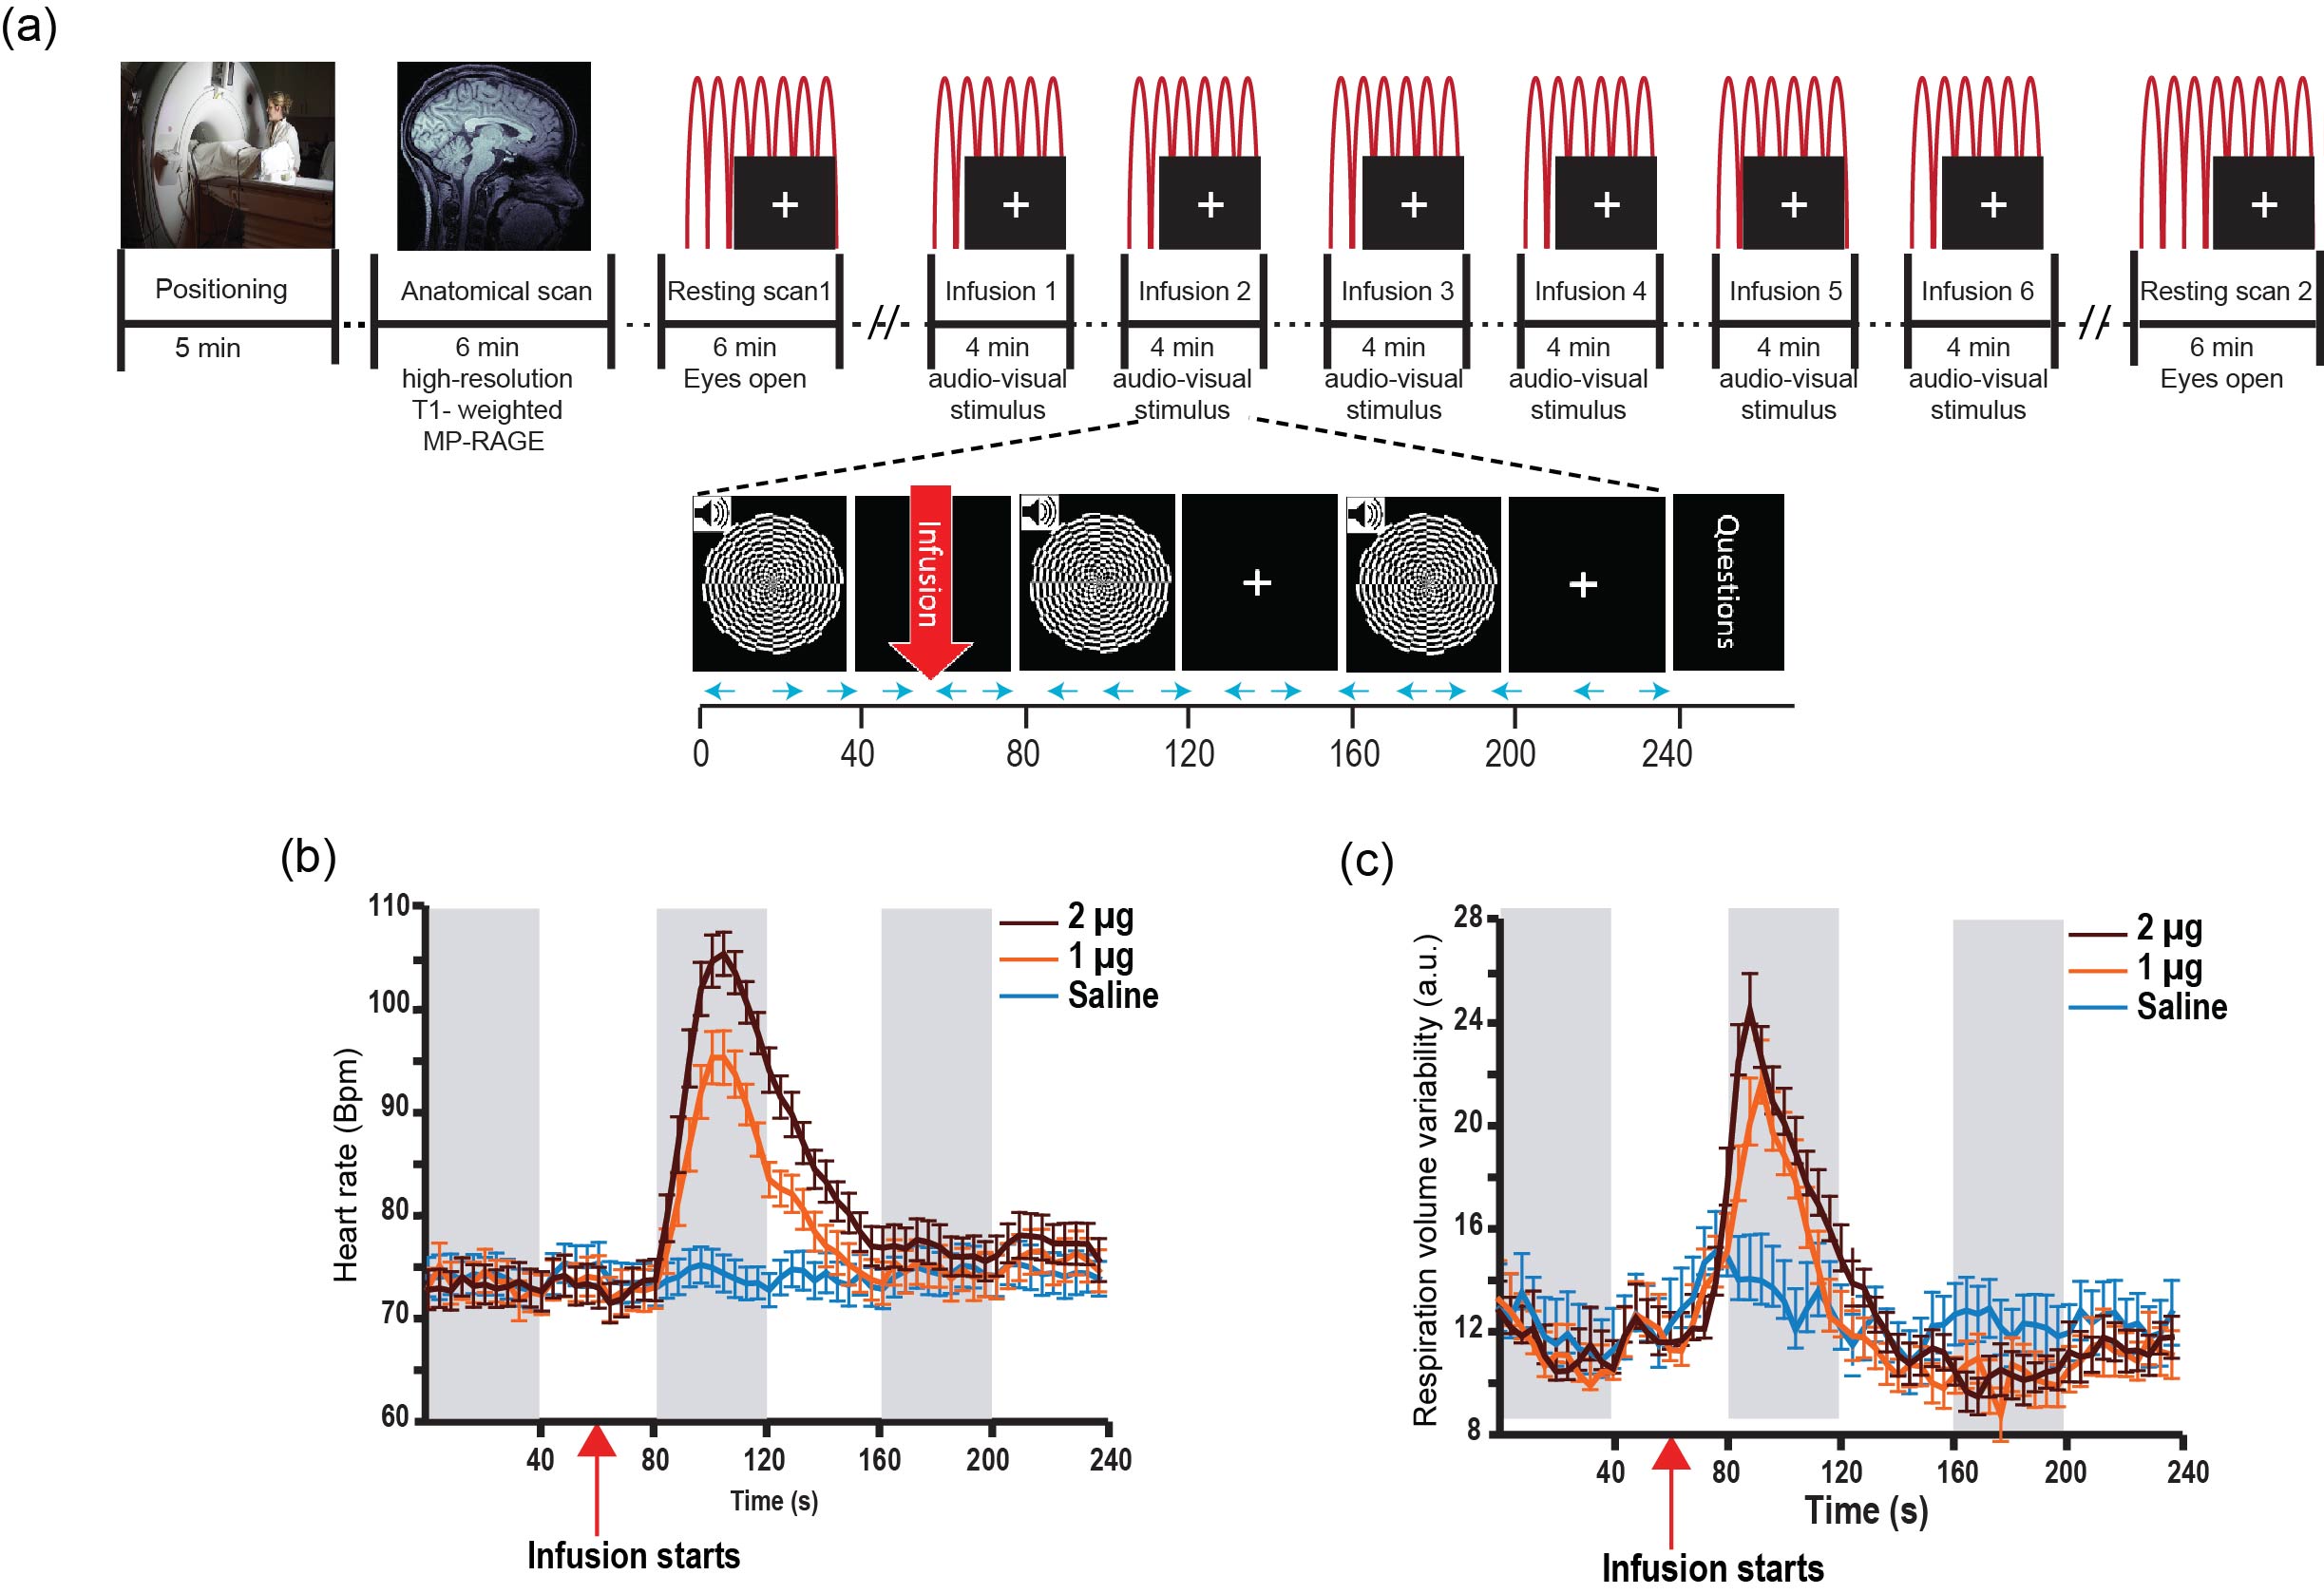
23 healthy individuals underwent two resting scans (6 minutes, eyes open, fixating on a white cross on a black screen), and six task scans (4 minutes, comprising 3 blocks of auditory-visual stimulation, 40s on/off, paired with a continuous performance task to enhance visual attention). During each task scan participants received a single bolus intravenous infusion (60s into scan) of either saline or isoproterenol, a peripherally acting beta-adrenergic agonist [1]. Isoproterenol was infused at a dose of 1 or 2 microgram (µg) (each repeated twice, double-blinded and randomized). Cardiac and respiratory waveforms were concurrently acquired (at 40 Hz) from scanner equipped pulse oximeter and a respiratory effort transducer belt (Figure 1a).
Imaging data were acquired using a 3 Tesla GE MR750 MRI scanner with an 8-channel receive-only head coil. Functional images were 24 axial slices (interleaved and bottom to top), acquired using a pseudo-continuous ASL (pCASL) sequence and the following parameters: FOV/slice thickness=220/5 mm, matrix size=64 x 64, labeling duration=1.8s, post labeling delay=1.5s, TR/TE=4000/13ms, and flip angle=90o. The minimum contrast (TR/TE = 2000/13ms) and cerebral spinal fluid reference (TR/TE = 6000/13ms) images were acquired (no labeling) for CBF quantification.
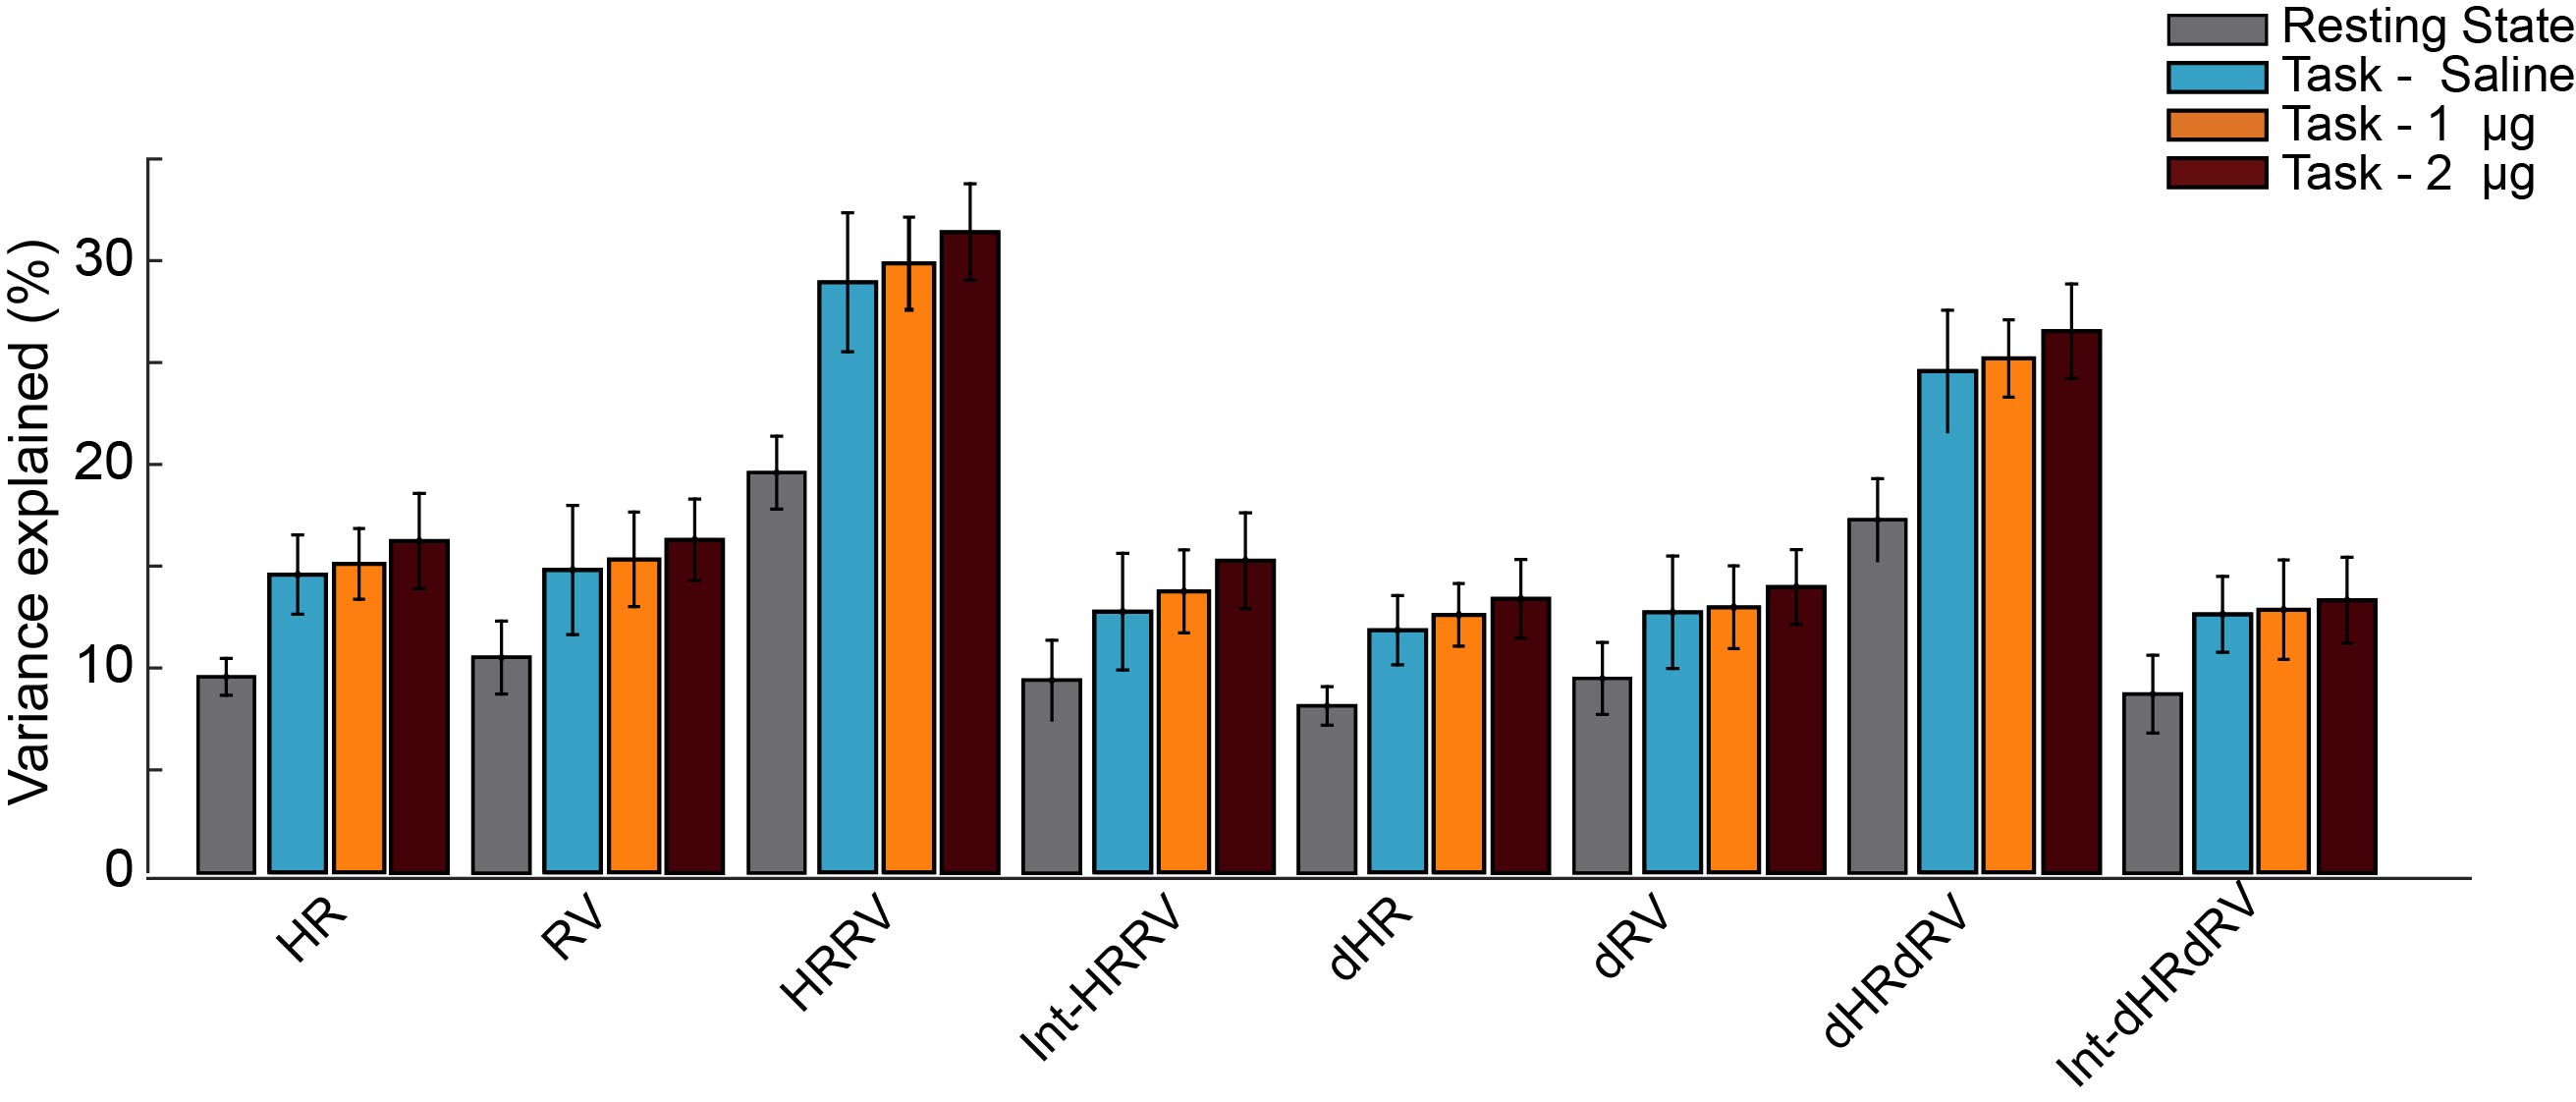
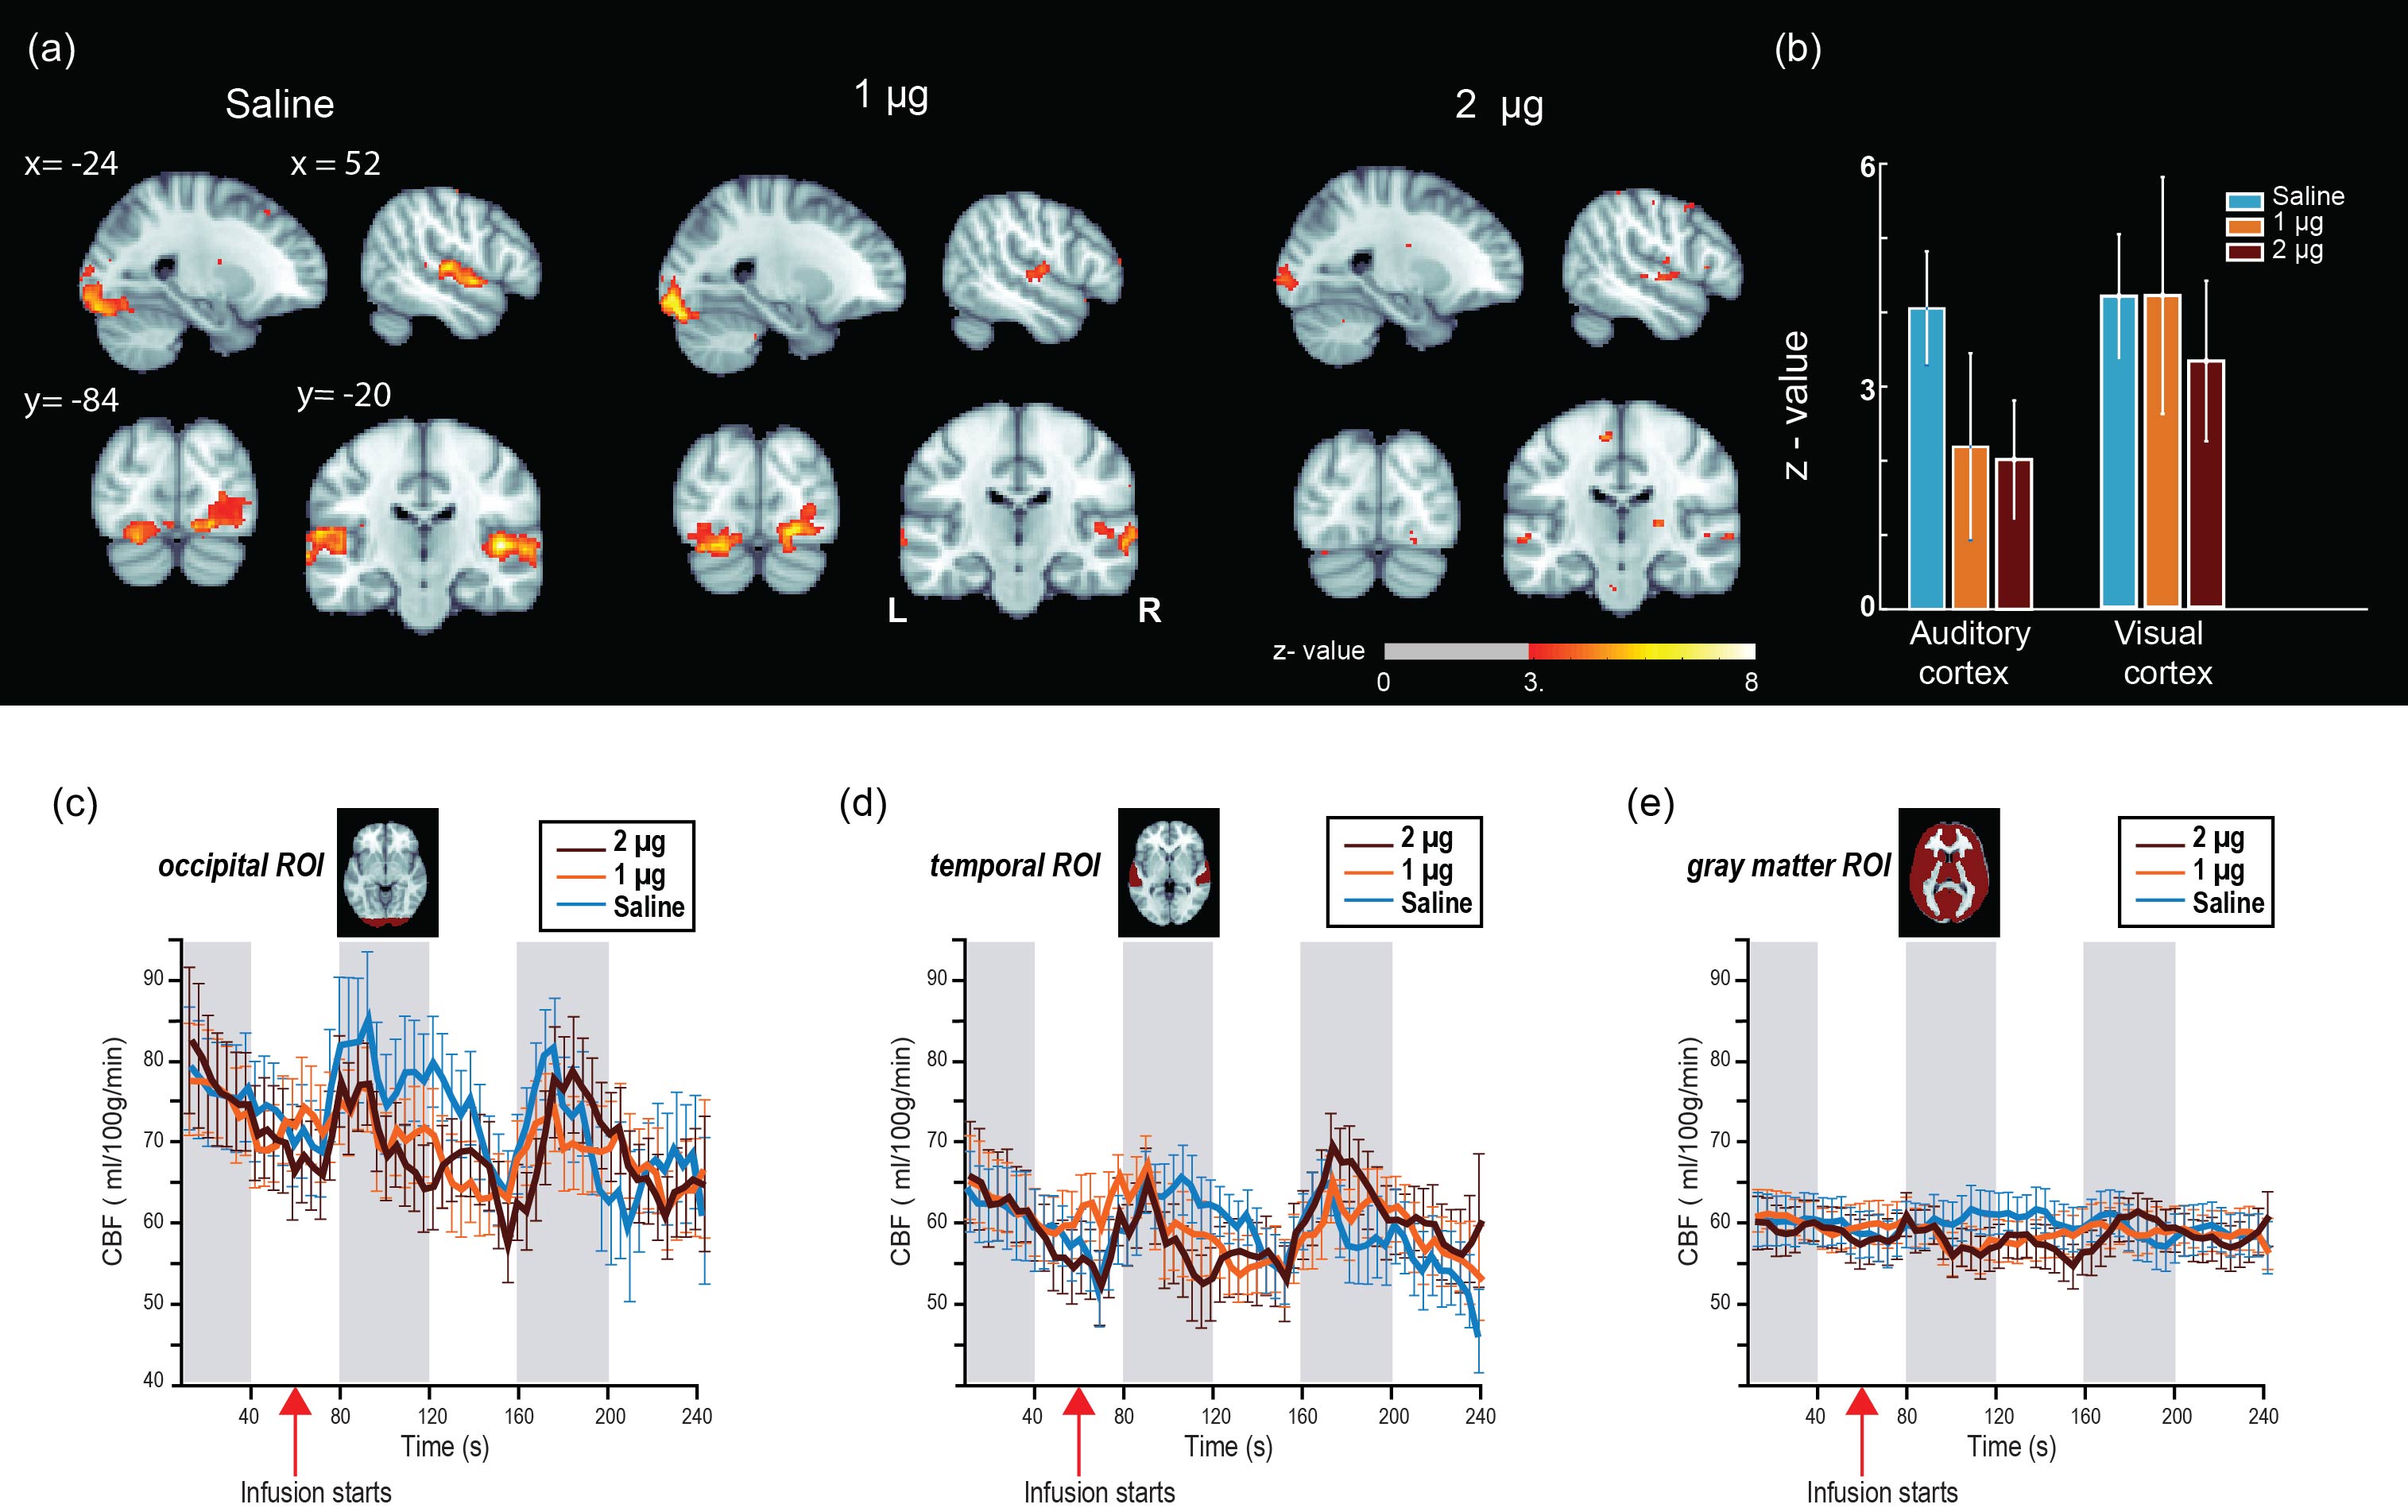
After volume alignment and spatial smoothing (6 mm FWHM), synchronized noise was modeled, estimated and removed using a standard physiological noise correction procedure (RETROICOR) applied separately to tag and control images [2, 3]. Next, perfusion images were calculated (pair-wise subtraction) and CBF values were calibrated using a general kinetic model for pCASL [4, 5]. Several non-synchronized noise models were built based on heart rate (HR) and variation in respiration volume (RV) measures within a linear deconvolution framework [6,7]: HR, RV, their combination, and interaction (HRRV and Int-HRRV models) as well as models based on their temporal gradients (dHR, dRV, dHRdRV and Int-dHRdRV). Percent signal variance explained by each noise model in CBF images was calculated for both resting and task data. Finally, to evaluate the effect of transient changes in cardiac and respiratory outputs on measures of CBF activity during audio-visual stimulation, task data were normalized to MNI 152 atlas space, and response maps were generated using block averaging. Group-level statistical maps were thresholded at p<0.001(uncorrected). A cluster size analysis based on random field theory was performed to determine the statistical significance of above threshold clusters at p<0.05 (corrected). Temporal dynamics of CBF were examined using time-series analyses within occipital, temporal and gray matter ROIs.
Results
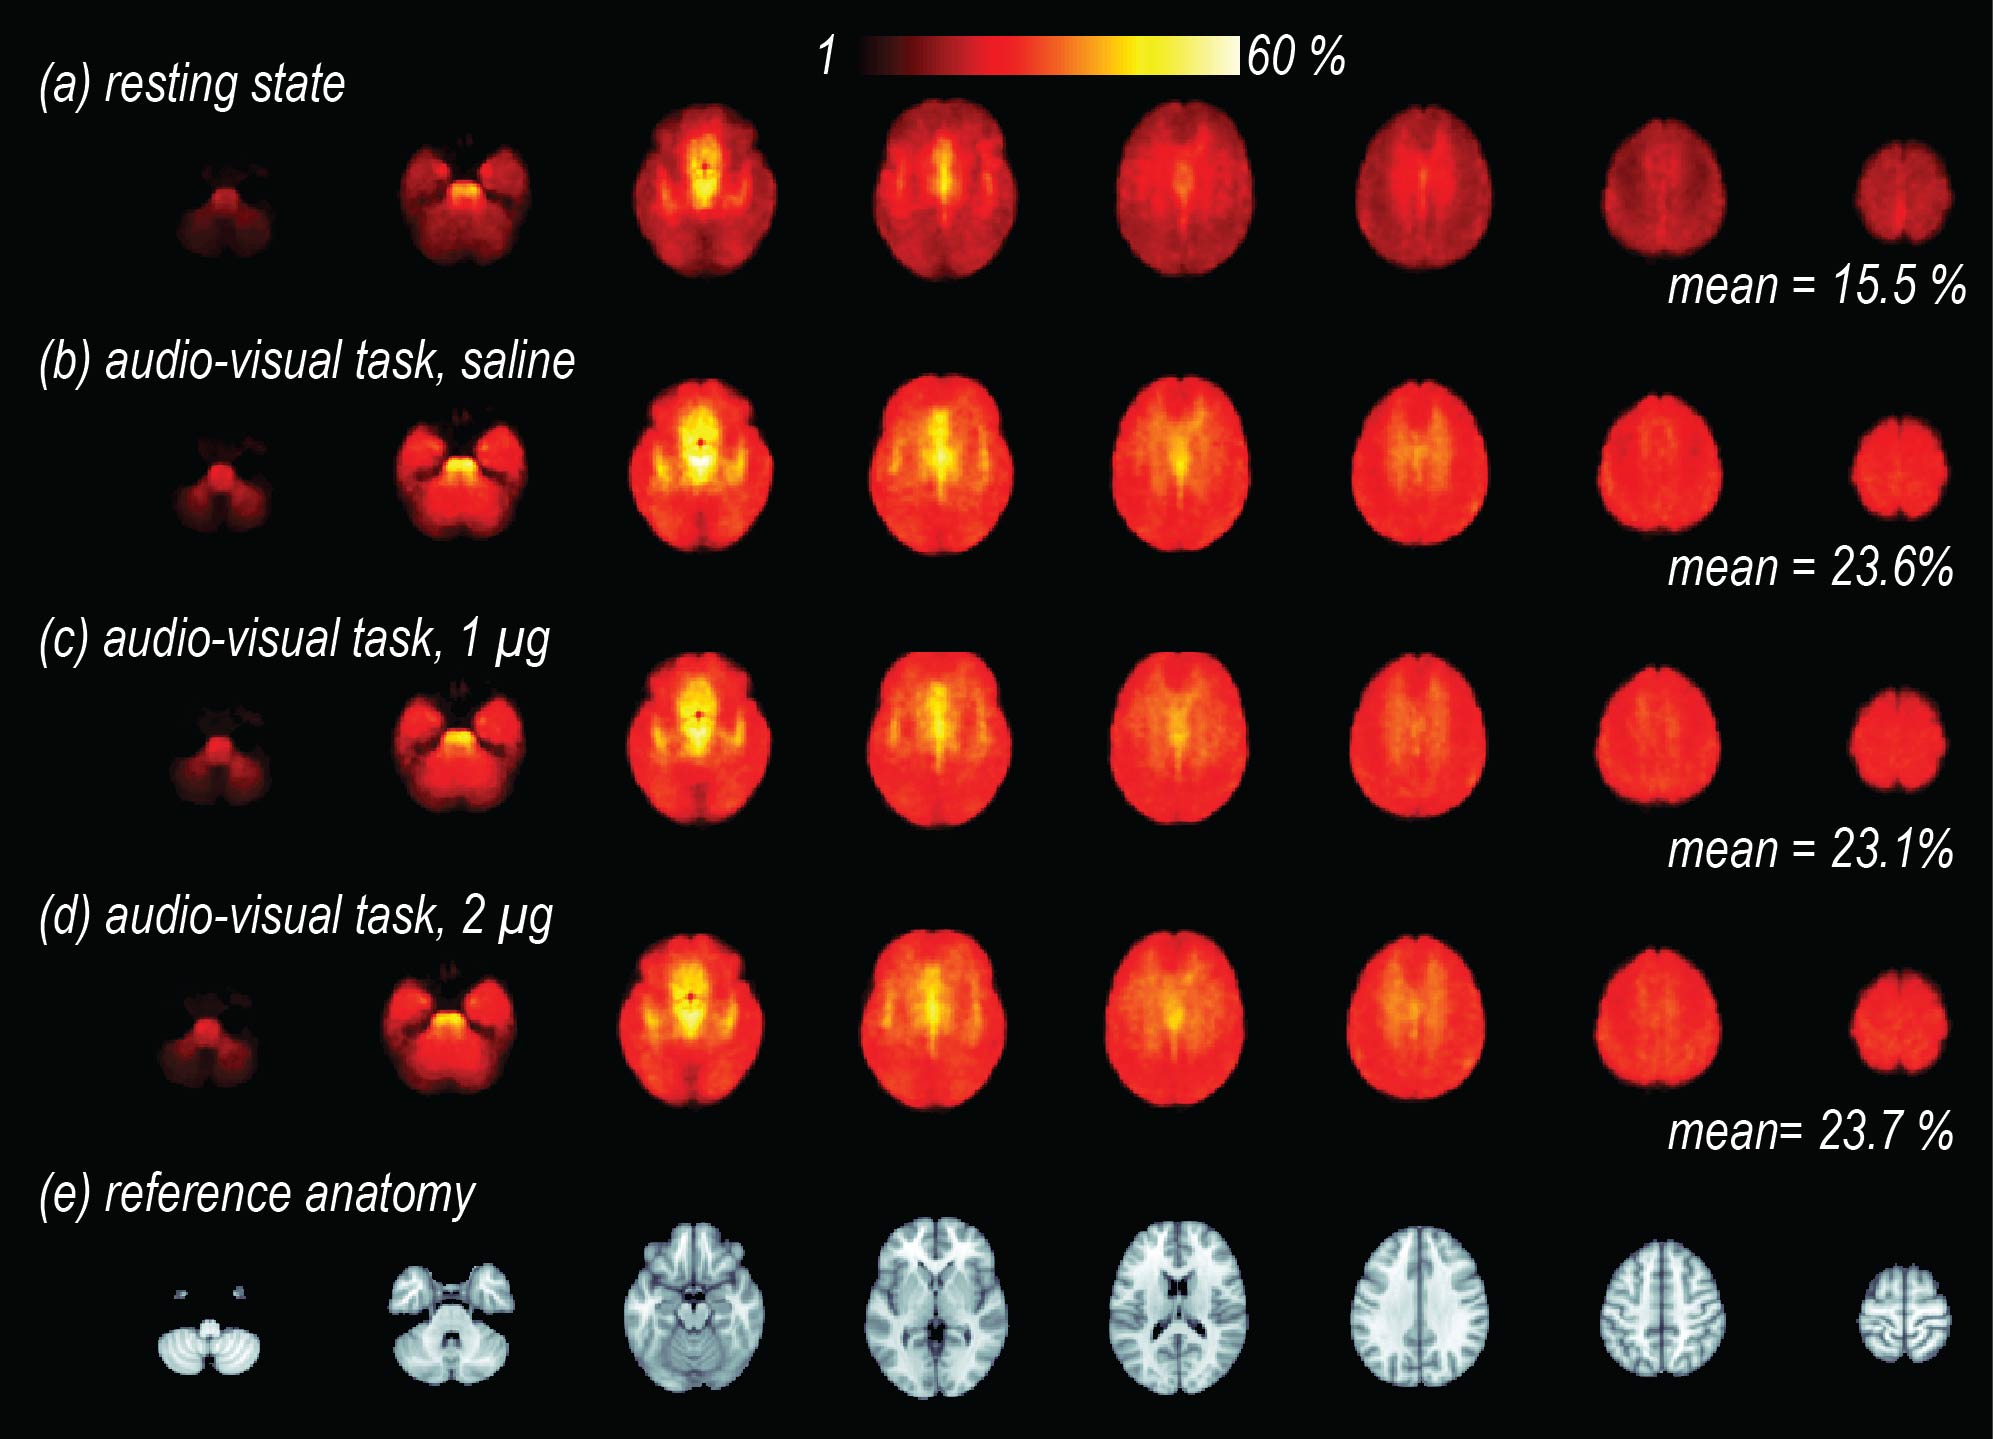
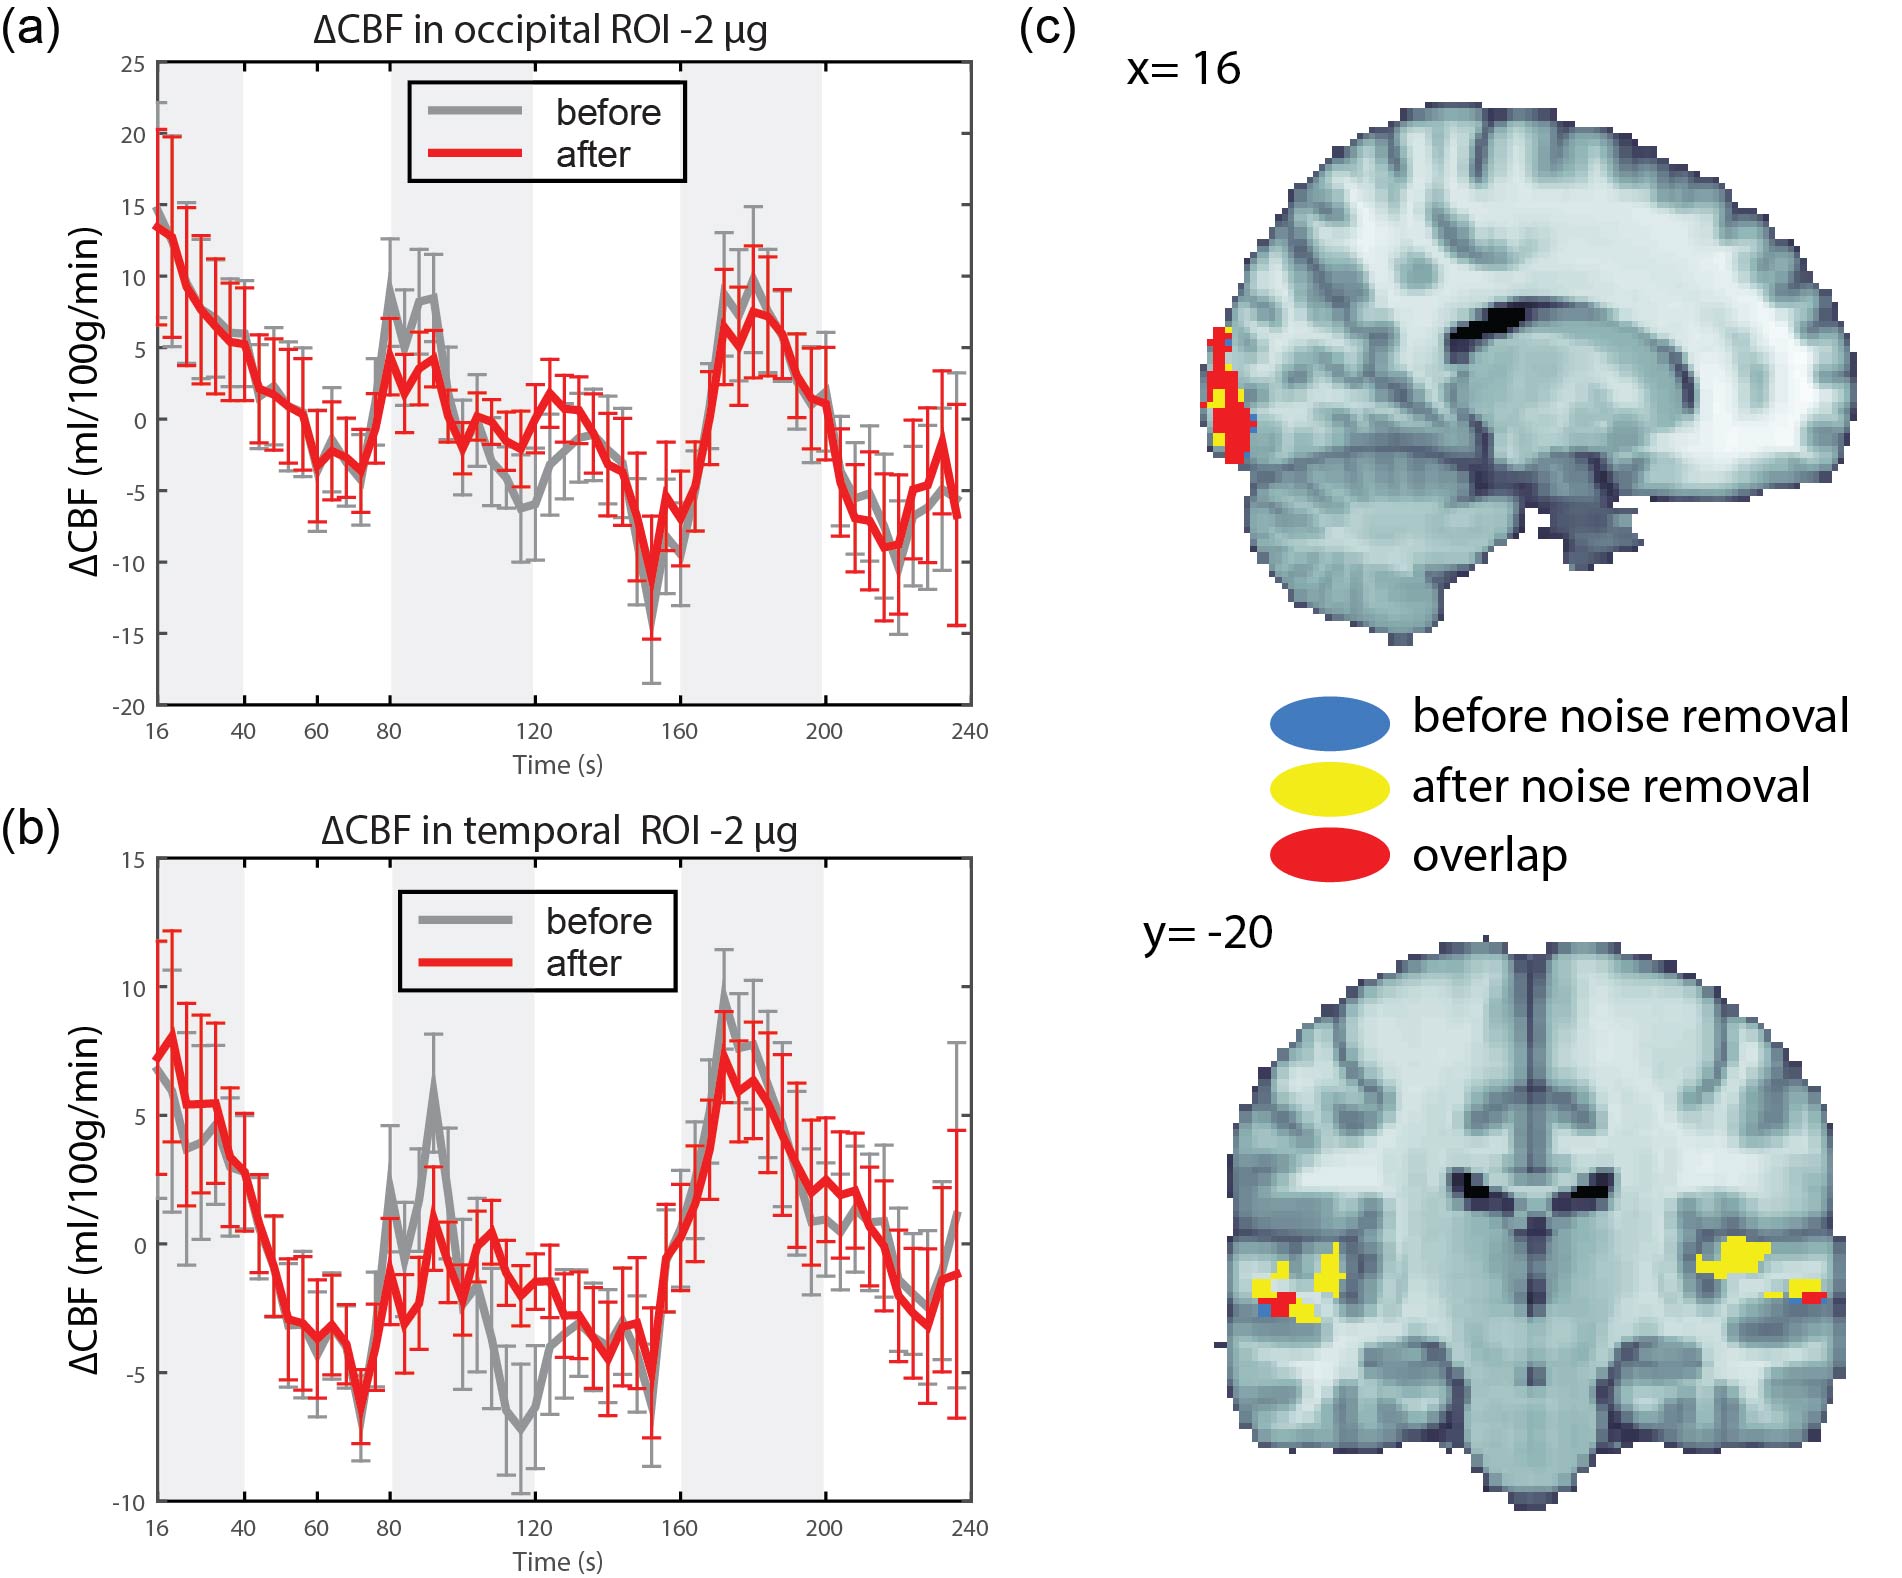
Isoproterenol induced transient cardiorespiratory changes (Figure 1b-c). Up to 60% of the ASL signal variance in certain voxels could be explained by synchronized fluctuations in cardiac and respiratory cycles, mainly in regions near the brain stem, ventricles and major vessels. This spatial pattern was consistently observed across the resting and task data, with slightly higher variance accounted for in the task data (23.6 vs 15.5 %, Figure 2 a-b). Modulating cardiorespiratory outputs did not affect this spatial pattern or the variance explained by RETROCIOR (Figure 2 b-d). However, the spatial pattern and amounts of non-synchronized physiological noise explained was less consistent. Among all the noise models, HRRV and dHRdRV models explained the highest percentage of variance in resting state as well as task data across the whole brain. We found that non-synchronized physiological noise was relatively higher (>10 %) during task performance compared to resting state. Isoproterenol infusions slightly increased the noise-related variance in data (Figure 3), but resulted in a substantial reduction in temporal SNR and CBF responses to audio-visual stimuli (Figure 4). Removing non-synchronized noise based on dHRdRV model substantially improved temporal SNR in occipital and temporal cortical regions during 2µg infusions (Figure 5).Discussion
Cardiorespiratory-related non-neuronal ASL signal fluctuations can negatively impact quantitative ASL measures and contribute to its low temporal SNR for resting and task experiments. We demonstrated that removing non-synchronized cardiorespiratory noise can substantially improve ASL measures of CBF response during transient cardiorespiratory changes.Conclusion
Cardiorespiratory fluctuations account for large proportions of the variance in resting and task-based CBF. By regressing out these non-neuronal signal variations, we improved the ASL signal’s intrinsically low temporal signal-to-noise ratio. This approach enhances detection power in task based ASL fMRI studies, and it may help to identify and control spurious activations in resting state analyses.Acknowledgements
No acknowledgement found.References
1. Hassanpour MS, et al., How the heart speaks to the brain: neural activity during cardiorespiratory interoceptive stimulation. Phil. Trans. R. Soc. B, 2016. 371(20160017).
2. Glover, G., Li, T.Q., Rees, D. 2000. Image-based method for retrospective correction of physiological motions effects in fMRI: RETROICOR. Magn Reson Med. 44:162-7.
3. Restom, K., Y. Behzadi, and T.T. Liu, Physiological noise reduction for arterial spin labeling functional MRI. Neuroimage, 2006. 31(3): p. 1104-15.
4. Buxton, R.B., et al., A general kinetic model for quantitative perfusion imaging with arterial spin labeling. Magn Reson Med, 1998. 40(3): p. 383-96.
5. Alsop, D.C., et al., Recommended implementation of arterial spin-labeled perfusion MRI for clinical applications: A consensus of the ISMRM perfusion study group and the European consortium for ASL in dementia. Magn Reson Med, 2015. 73(1): p. 102-16.
6. Chang, C., J.P. Cunningham, and G.H. Glover, Influence of heart rate on the BOLD signal: the cardiac response function. Neuroimage, 2009. 44(3): p. 857-69.
7. Birn, R.M., et al., The respiration response function: the temporal dynamics of fMRI signal fluctuations related to changes in respiration. Neuroimage, 2008. 40(2): p. 644-54.
Figures