0678
Pseudo Continuous Arterial Spin Labeling Quantification Considerations in Hyperemic Cerebral Blood Flow1Biomedical Engineering/ Cardiology, University of Southern California/ Children's Hospital Los Angeles, Los Angeles, CA, United States, 2Hematology, Children's Hospital Los Angeles, Los Angeles, CA, United States, 3Cardiology, University of Southern California/ Children's Hospital Los Angeles, Los Angeles, CA, United States
Synopsis
In this work we compare 2D phase contrast (PC) and pseudo continuous arterial spin labeling (PCASL) estimates in subjects with hyperemic cerebral blood flow. We found that B1 ineffiency dependent reductions in labeling efficiency and venous outflow of ASL tracer in PCASL leads to underestimation of PC CBF estimates.
Introduction
Cerebral blood flow (CBF) is powerful biomarker of cerebral oxygen supply. High cerebral blood flow can be found in healthy children due to the elevated metabolism of the immature brain as well as patients with chronic anemia syndromes as a result of low oxygen carrying capacity1. Accurate CBF measurements are therefore useful in the study of both brain development during early childhood and disease prognosis in pathophysiology.
Using MRI, CBF can be quantified non-invasively, without contrast using Pseudo Continuous Arterial Spin Labeling (PCASL) and phase contrast (PC) MRI. In this study we compare the estimates of CBF using these two techniques in subject with high blood flow and demonstrate several, novel sources of error.
Methods
All studies were approved by the institutional review board at Children’s Hospital Los Angeles and all patients provided informed assent/consent. All studies were performed on a Philips Achieva 3T scanner with an 8 channel receive headcoil.
Cerebral blood flow was measured using 2D Phase Contrast (PC) and PCASL MRI. For PC a 2D axial plane, non-gated sequence was position 1cm above the carotid bifurcation (venc 150 cm/s, 3mm slice thickness, 0.58x0.58mm in plane resolution ). An anatomical T1 sequence was used brain volume calculation (density 1.05 g/ml). A segmented, dualshot 3D GRASE, unbalanced, background suppressed PCASL sequence was used for ASL CBF estimates (TR=3.8s,TE 3.2ms, label duration of 2.0s and label delay of 1.6s). PCASL train parameters include 100us Hanning RF pulses, maximum gradient amplitude of 10G/cm and mean gradient of 1 G/cm over the interpulse interval of 1ms with a pulse duration of 0.5ms. Voxelwise velocity estimates from PC MRI were used for labeling efficiency (LE) correction. M0 image was acquired and PCASL single compartment, kinetic model was used for quantification2. T1 of blood was corrected for hematocrit and 10 dynamic scans were acquired and averaged. Background suppression inversion efficiency was measured at 90%.
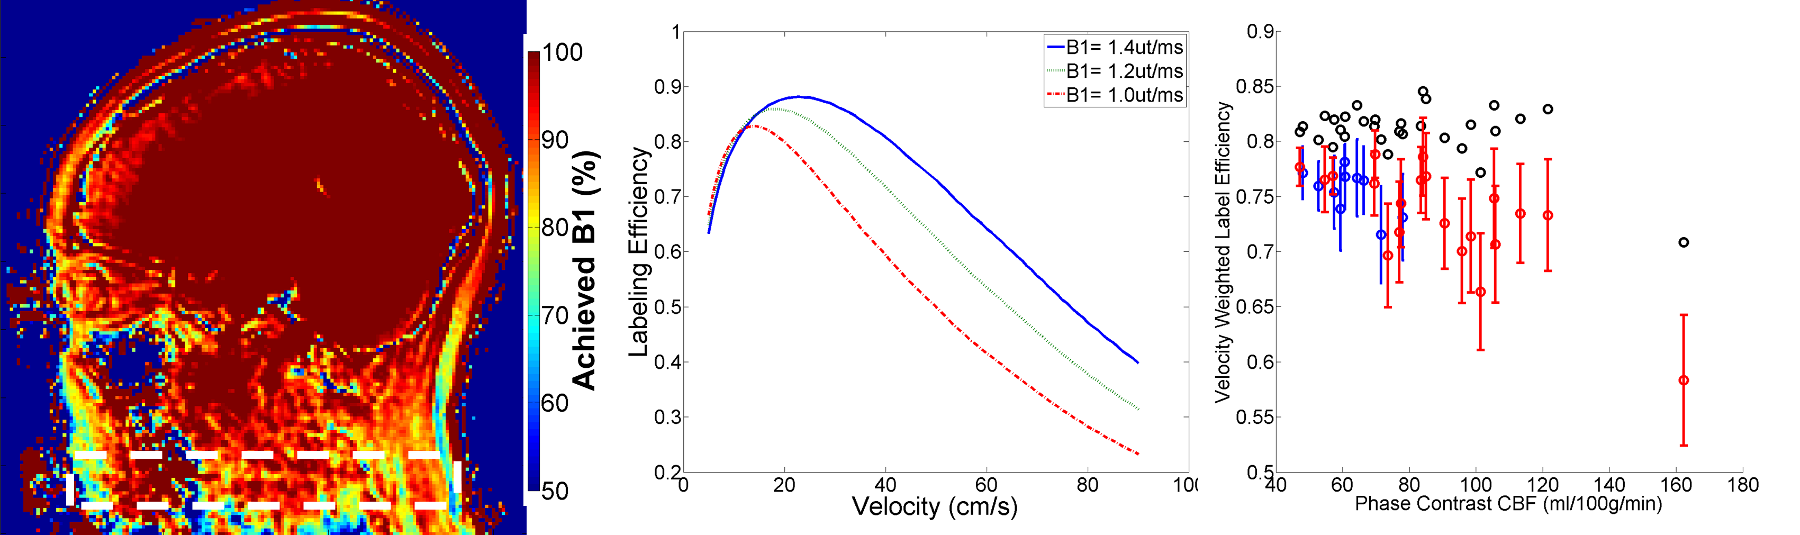
In five healthy subjects whole brain B1 maps were measured using a whole brain, sagittal slab dual TR B1 mapping sequence with TE/TR1/TR2=3ms/20ms/120ms, voxel=1.2x1.2x3mm, NSA-1, FOV-15cm. The B1 efficiency was recorded at the plane of PCASL labeling. Bloch simulation of PCASL efficiency was constructed in house using MATLAB to probe the effects of B1 efficiency.
Results
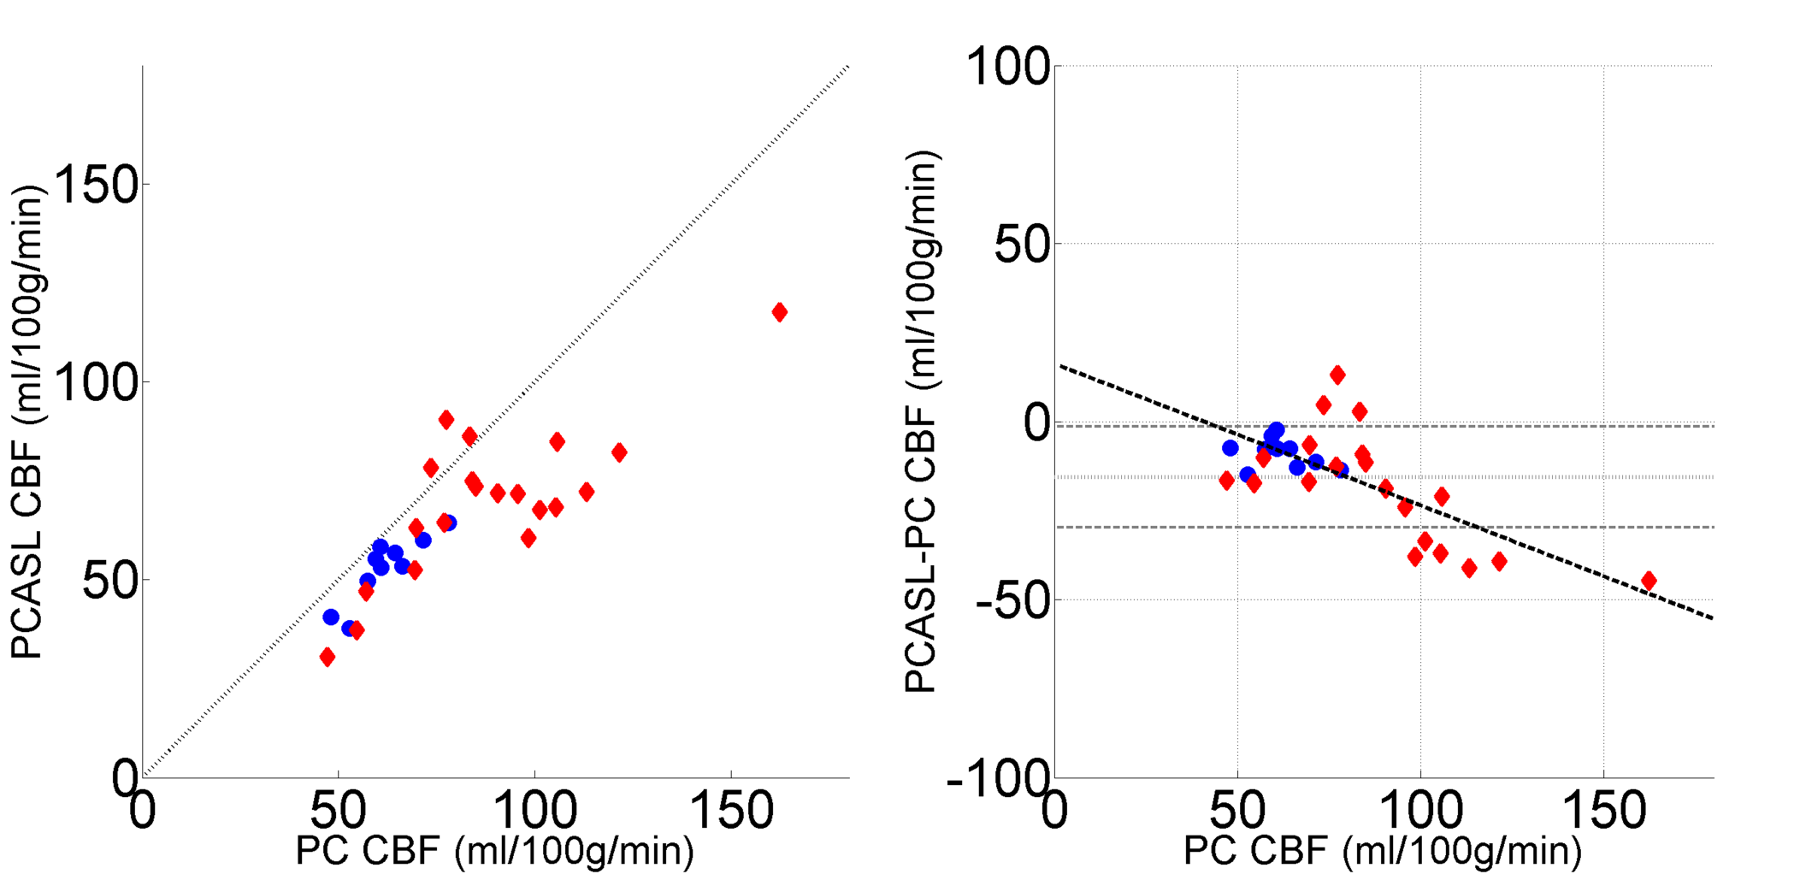
PC and PCASL CBF imaging was performed on adolescents and young adults (18.6±4.2 years), 10 healthy and 20 patients with sickle cell and other chronic anemia disorders (9 SCD and 11 other non-sickle anemic syndromes). Measurements of CBF by PC and PCASL were correlated but there was a bias and a residual, relative error dependent on CBF (Figure 1). Whole brain PC CBF was 78.2±25.1 ml/100g/min, whereas PCASL was 64.2+18.1 ml/100g/min with velocity LE correction with a mean relative error (PCASL CBF- PC CBF) of -15.6±14.1 ml/100g/min (Figure 1). The discordance between PCASL and PC CBF grew with PC CBF with an r2 = 0.62 (Figure 1). Two sources of error in PCASL estimates were identified.
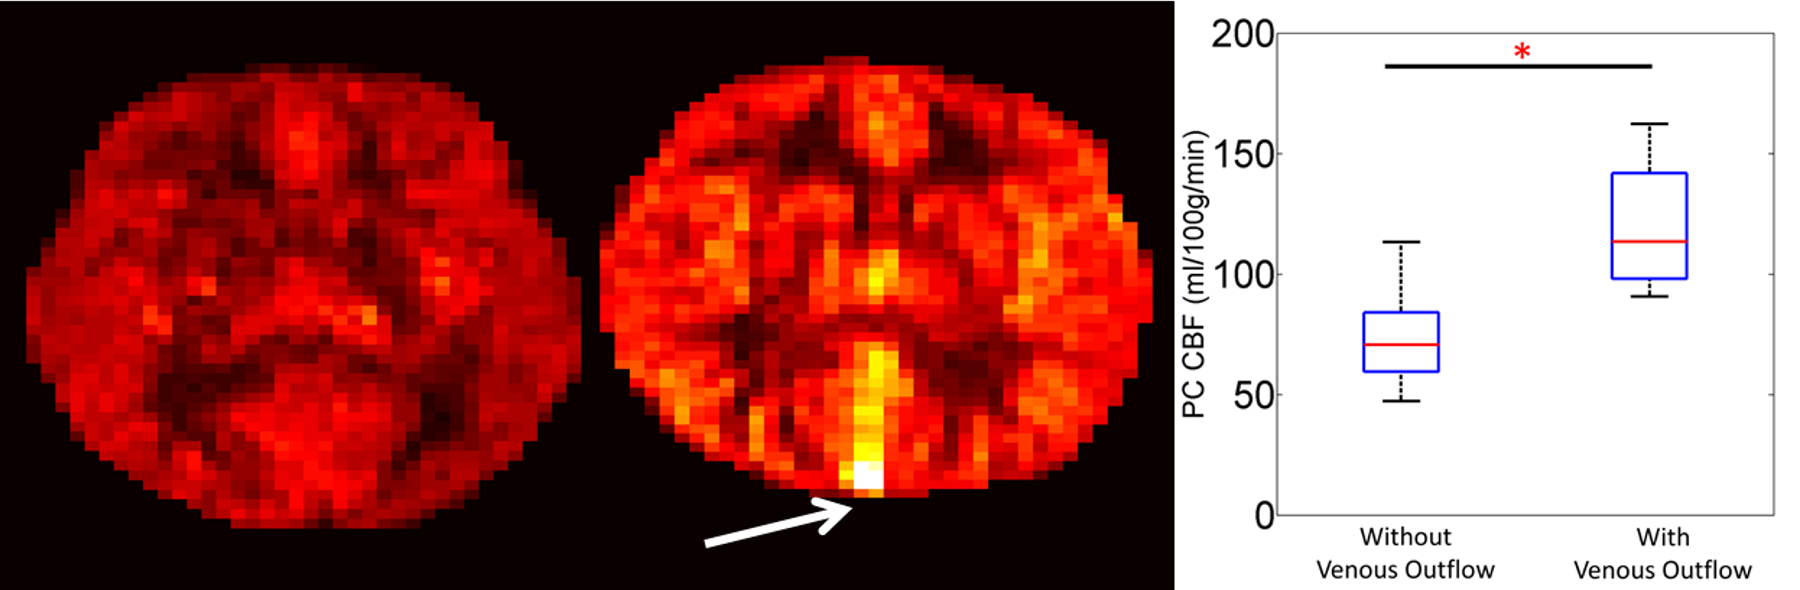
Venous Outflow: Representative PCASL perfusion weighted images can be seen in Figure 2. ASL signal appeared in the large cerebral draining veins of four patients (figure 2 white arrows). Subjects with venous outflow had significantly higher PC CBF (Figure 2) . Removing subjects with venous outflow from the group analysis improved agreement between PC and PCASL CBF measurements (-12.6±12.1 ml/100g/min).
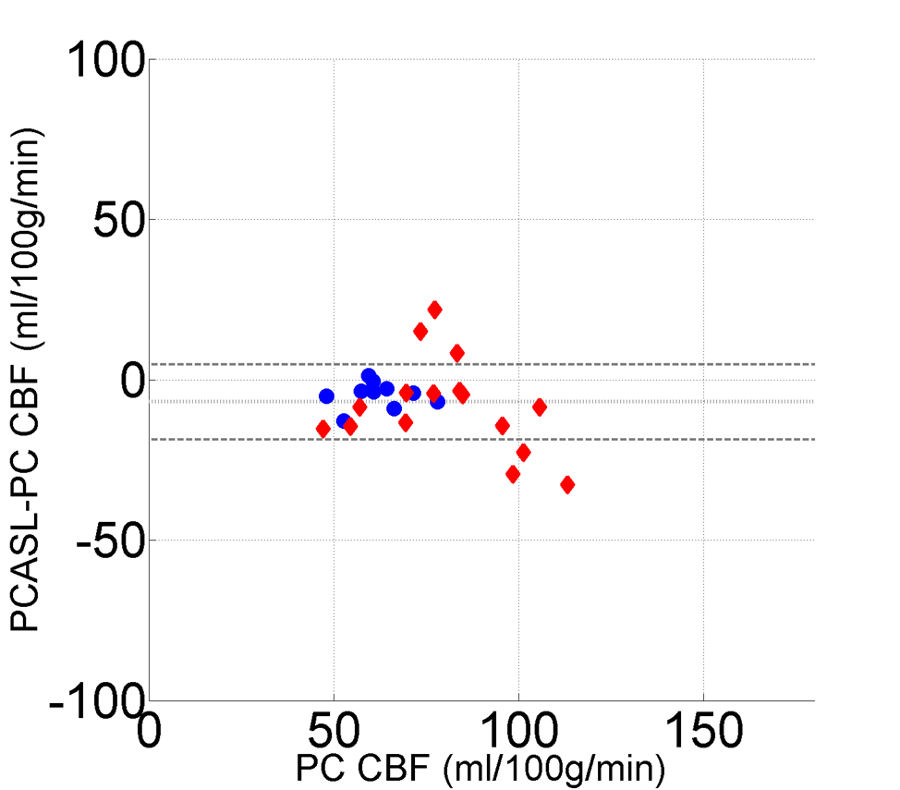
Achieved B1: Radiofrequency strength is an important, previously identified parameter in the determination of PCASL efficiency3. We found, post hoc, that achieved B1 strength was 82.9±5.1% of the designated B1 at the intersection of the feeding vessels and the labeling plane (figure 3). Equal drops in B1 efficiency result in larger drops in LE due to nonlinearities in in B1, velocity and LE. Accounting for achieved B1 efficiency effects on LE postdoc further improved relative error between PCASL and PC CBF (-6.9±11.7 ml/100g/min, Figure 4).
Discussion
In this study we compare PC and PCASL CBF estimates in hyperemic patients and identified two sources of error in PCASL MRI: venous outflow and B1 inefficiency. Typically, kinetic models used in PCASL quantification assume negligible labeled spins will leave the imaging voxel upon entry. In this study we demonstrate that this assumption is false, particularly at high flow rates, leading to underestimate and may represent an independent prognostic marker of microvascular shunting. Additionally, we show achieved B1 must be considered when calculating LE. Typically, LE is assumed to be 85%. These data show that the interaction of velocity and achieved B1 leads to flow underestimation using PCASL MRI, exaggerated in hyperemic flow conditions.Acknowledgements
Acknowledgements: Philips Healthcare and Jon Chia provided support for protocol development and applications engineering on a support-in-kind basis.
Grant Support: This work was supported by the National Heart Lung and Blood Institute (1U01HL117718-01, and Minority Supplement to 1U01HL117718-01) and National Center for Research through the Clinical Translational Science Institute at Children’s Hospital Los Angeles (5UL1 TR000130-05).
References
1. Bush AM, Borzage MT, Choi S, et al. Determinants of resting cerebral blood flow in sickle cell disease. Am J Hematol. 2016;91(9):912-917.
2. Alsop DC, USA BIDMCaHMSDoRBM, Detre JA, et al. Recommended implementation of arterial spin-labeled perfusion MRI for clinical applications: A consensus of the ISMRM perfusion study group and the European consortium for ASL in dementia. Magnetic Resonance in Medicine. 2016;73(1):102-116. 3. Dai W, Garcia D, de Bazelaire C, Alsop DC. Continuous Flow Driven Inversion for Arterial Spin Labeling Using Pulsed Radiofrequency and Gradient Fields. Magn Reson Med. 2008;60(6):1488-1497.
Figures