0675
4D Combined Angiography and Perfusion using Radial Imaging and Arterial Spin Labeling1FMRIB Centre, Nuffield Department of Clinical Neurosciences, University of Oxford, Oxford, United Kingdom
Synopsis
Complete assessment of blood flow to the brain requires both knowledge of blood flow through the large arteries and perfusion at the tissue level. However, separate acquisition of dynamic angiograms and perfusion maps is time-consuming. In this work a 4D implementation of the Combined Angiography and Perfusion using Radial Imaging and Arterial Spin Labeling (CAPRIA) sequence is presented, allowing the reconstruction of whole-brain dynamic angiograms and time-resolved perfusion maps from the same raw data set. In addition, a variable flip angle imaging scheme is shown to benefit the visualization of tissue perfusion without compromising angiographic image quality.
Introduction
In a variety of cerebrovascular diseases it is useful to have information about blood flow both at the level of the large arteries, to visualize stenoses, occlusions or abnormal vessels, and at the level of the tissue, to assess the effects on the resulting downstream perfusion. However, within a busy clinical protocol, the separate acquisition of angiographic and perfusion data may not be feasible. Previously, a method was proposed which allowed simultaneous acquisition of both dynamic angiograms and perfusion maps without the administration of a contrast agent: Combined Angiography and Perfusion using Radial Imaging and Arterial Spin Labeling (CAPRIA).1 However, the original implementation was restricted to separately imaging individual slices, limiting clinical utility. Here, a full 4D (time-resolved 3D) implementation is presented to obtain whole brain dynamic angiograms and perfusion maps within a single scan. Optimization of image quality is explored using a variable flip angle imaging scheme.Methods
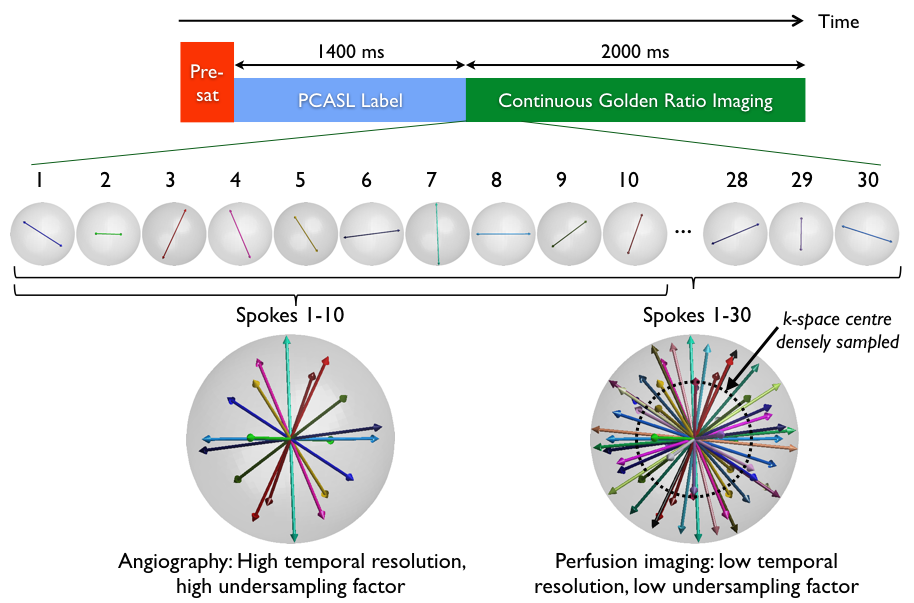
A schematic of the 4D CAPRIA pulse sequence is shown in Figure 1. Pre-saturation is used for background suppression and pseudo-continuous ASL (PCASL) generates the bolus of labeled blood. A spoiled gradient-echo golden ratio radial scheme2 continuously images the labeled blood as it passes through the vascular network and into the tissue. This approach ensures that within any arbitrary temporal window the acquired data are evenly spread throughout 3D k-space, even when combining across multiple PCASL preparations. This enables the reconstruction of angiographic images at high temporal resolution and perfusion images at lower temporal resolution from the same raw data set. Subtraction artefacts (e.g. from subject motion) are minimized by interleaving the acquisition of label and control data.
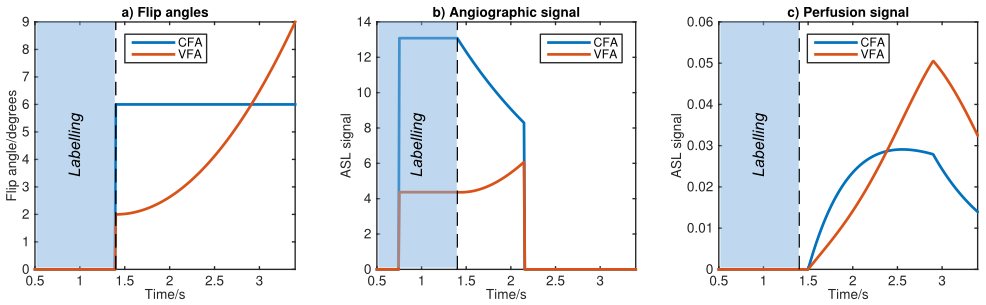
Due to T1 decay of the labeled blood, attenuation of the ASL signal by the imaging RF pulses, and the lower concentration of blood at the tissue level, the perfusion signal is considerably weaker than the angiographic signal. To compensate, a variable flip angle (VFA) scheme was considered in which the imaging flip angle increases quadratically during the acquisition period.3 Numerical simulations of the ASL angiographic4 and perfusion5 signals, accounting for RF attenuation, were used to compare VFA and constant flip angle (CFA) approaches (Figure 2).
Four healthy volunteers were scanned under an agreed technical development protocol on a 3T Siemens Verio scanner using a 32-channel head coil. 4D CAPRIA data were acquired in 10min (labeling duration 1.4s, readout duration 2s, matrix 160, 1.1mm isotropic voxels, TR/TE 9/3.4ms, flip angle 6° (CFA) or 2-9° (VFA), bandwidth 99Hz/Pixel, readout partial Fourier 79%). Angiographic/perfusion images were reconstructed at 216/323 ms temporal resolution, respectively, using a regridding algorithm.6 Perfusion image SNR was boosted via spatial smoothing to match typical ASL resolution (3.4mm isotropic). Effective angiographic and perfusion undersampling factors were 19 and 2, respectively.
Results and Discussion
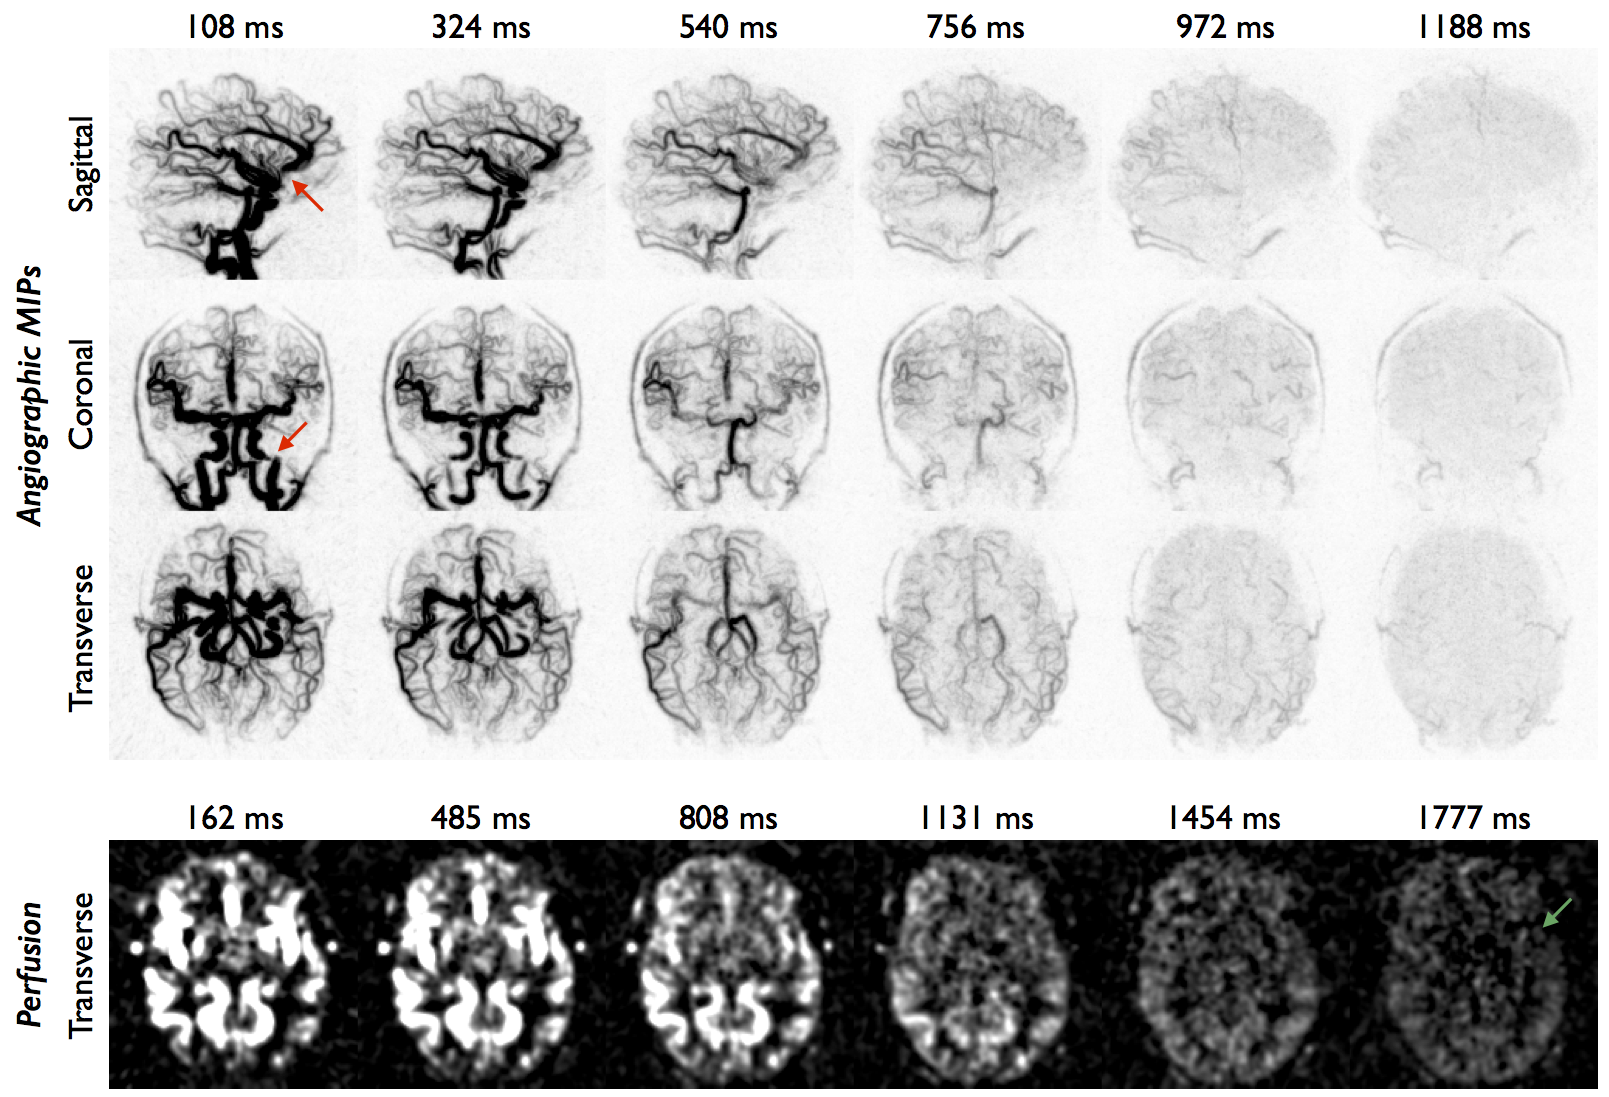
Example 4D CFA CAPRIA data are shown in Figure 3. Good visualization of the proximal and distal arterial branches is achieved. Note that due to the long labeling duration the first angiographic image shows much of the arterial tree filled with labeled blood, with subsequent frames showing the filling of distal vessels and the passage of blood into the tissue. Perfusion images reconstructed from the same raw data set show the expected patterns of blood flow into the tissue, although the signal is weak at later time points.
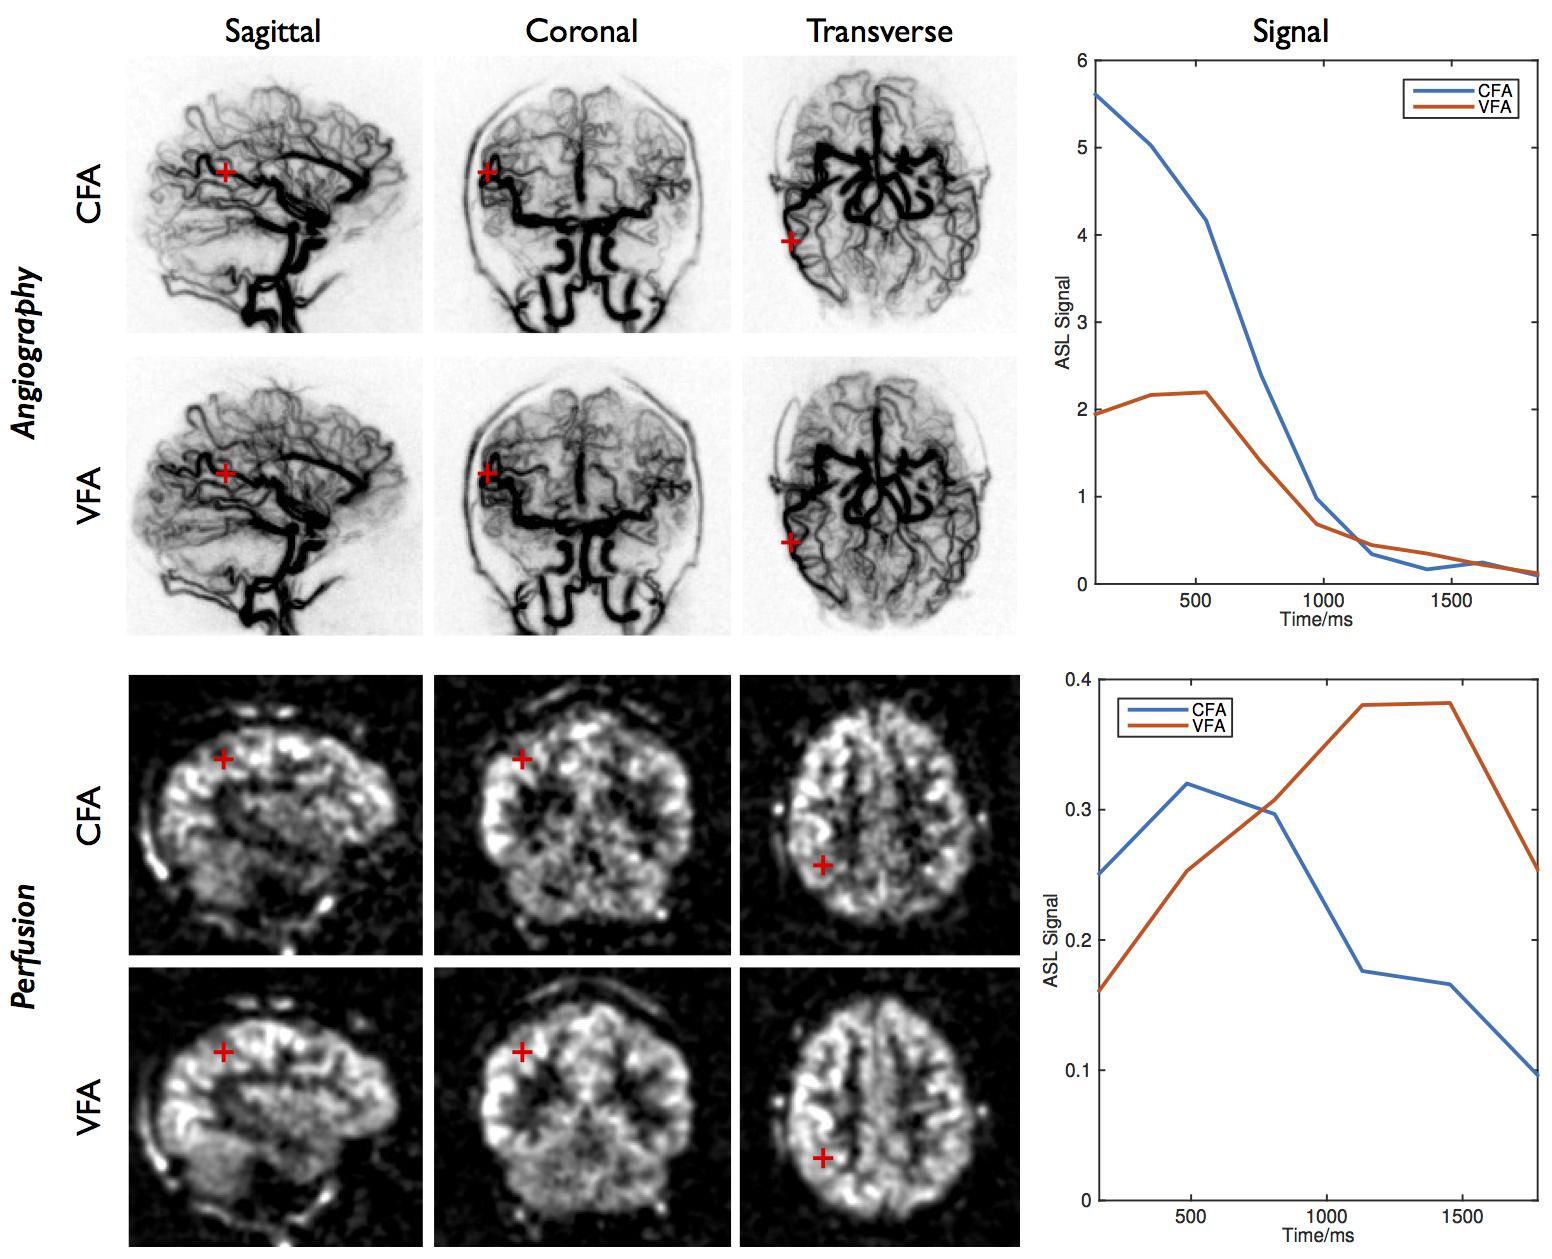
A VFA scheme varying quadratically between 2° and 9° was found to give a considerable boost to the perfusion signal in simulations (Figure 2): for blood with an arterial transit time of 1.5s the VFA signal is 82%/133% larger than the CFA signal at postlabeling delays of 1.5s/2s, respectively. Comparison of CFA and VFA schemes in the same subject (Figure 4) reveal very little difference in angiographic image quality at early time points, despite the lower initial flip angle used with VFA, due to the high intrinsic SNR of this technique. Improved perfusion signal strength at later time points is also observed with VFA due to the reduced signal attenuation as the labeled blood accumulates in the tissue, as well as the direct impact of using larger flip angles at later time points. The observed signal timecourses were found to follow the trends expected from simulations (Figure 5).
In conclusion, 4D CAPRIA allows the complete assessment of blood flow into the brain within a single scan, with a VFA approach yielding considerable improvements to perfusion image quality without adversely affecting the reconstructed angiograms. Reduction of noise-like radial undersampling artefacts using compressed sensing7 should help improve image quality and/or reduce scan time in future work.
Acknowledgements
Thanks to the Royal Academy of Engineering for funding support and to Siemens Healthcare for providing the base pulse sequence code.References
1. Okell TW. Combined Angiography and Perfusion using Radial Imaging and Arterial Spin Labeling. In Proceedings 24th Scientific Meeting, ISMRM, Singapore, 2016. p 1001.
2. Chan RW, Ramsay EA, Cunningham CH, Plewes DB. Temporal stability of adaptive 3D radial MRI using multidimensional golden means. Magn Reson Med 2009;61:354-363.
3. Schmitt P, Speier P, Bi X, Weale P, Mueller E. Non-contrast-enhanced 4D intracranial MR angiography: Optimizations using a variable flip angle approach. In Proceedings 18th Scientific Meeting, ISMRM, Stockholm, Sweden, 2010. p 402.
4. Okell TW, Chappell MA, Schulz UG, Jezzard P. A kinetic model for vessel-encoded dynamic angiography with arterial spin labeling. Magn Reson Med 2012;68:969-979.
5. Buxton RB, Frank LR, Wong EC, Siewert B, Warach S, Edelman RR. A general kinetic model for quantitative perfusion imaging with arterial spin labeling. Magn Reson Med 1998;40:383-396.
6. Fessler J. Image Reconstruction Toolbox. http://web.eecs.umich.edu/~fessler/irt. Oct 2015.
7. Lustig M, Donoho D, Pauly JM. Sparse MRI: The application of compressed sensing for rapid MR imaging. Magn Reson Med 2007;58:1182-1195.
Figures