0673
Estimating breast tumor blood flow and blood volume using MRI: DCE vs IVIM1Division of Biomedical Imaging, University of Leeds, Leeds, United Kingdom, 2Department of Radiology, Leeds Teaching Hospital NHS Trust, 3Department of Medical Physics and Engineering, Leeds Teaching Hospital NHS Trust
Synopsis
There is an increasing interest on whether IVIM parameters can be used as surrogates of perfusion and thus complement information on tumor microstructure. DCE-MRI techniques on the other hand have been widely used to characterise perfusion and hence offer the opportunity to test this hypothesis. In this study, we use high temporal resolution DCE-MRI and IVIM-DWI techniques to monitor patients with advanced breast cancer at various stages of their neoadjuvant chemotherapy, and assess the physiological relationship between perfusion and IVIM parameters.
Introduction
MRI has a key role in treatment monitoring of patients with advanced breast cancer. Dynamic contrast-enhanced (DCE)-MRI techniques enable quantification of physiological processes such as tumor blood flow (Fb) and capillary permeability (PS)1. Another technique that probes tumor characteristics is intravoxel incoherent motion diffusion-weighted imaging (IVIM-DWI), which allows simultaneous assessment of diffusion (Dt) and pseudo-diffusion (D*)2. Despite the wide application of IVIM-DWI, D* and its relative weighting (fp) are still poorly understood in terms of their relationship to the physiological parameters Fb and blood volume fraction, vb. In this study we use high temporal resolution DCE-MRI and IVIM-DWI to examine the correlation between perfusion and IVIM parameters in breast tumors.Methods
Nine female patients diagnosed with locally advanced breast cancer and due to undergo neoadjuvant chemotherapy (NACT) were scanned on a 1.5 T Aera MR scanner (Siemens, Germany) pre-treatment, following one and three cycles of NACT. The MRI protocol, shown in Table 1, includes an IR-TurboFLASH sequence for T1 quantification both pre-contrast and post-contrast, an interleaved high temporal and high spatial resolution (HTR & HSR) DCE sequence for tracer kinetic analysis and clinical reporting, and echo planar DWI at 6 b-values for IVIM analysis. A flexible matrix coil was used to enhance signal from the descending aorta to provide an arterial input function (AIF) for the DCE experiment. A dose of 0.1 mmol/kg Gd-DOTA was administered at 3 ml/s followed by 20 ml saline.
All MRI data were processed in Matlab (Mathworks, USA). Tumor and AIF region of interests (ROIs) were manually drawn for the analysis. Bookend T1 relaxation times for tumor and AIF were estimated by fitting the inversion recovery turbo field-echo (IRTFE) signal equation to the measured signal3,4. Following an iterative approach, a bookend correction was applied as described by Cron et al5. DCE data were fitted with a two-compartment exchange model (2CXM) to provide estimates of Fb, PS, ve (extracellular-extravascular space fraction) and vb. Results obtained using both baseline only estimates of T1 and bookend-corrected estimates to calculate R1-relaxation rate changes were compared.
For DWI, signal data from ROIs within tumors were fitted using an IVIM model with a segmented approach6. Dt was estimated from data acquired using b = 400 & 800 s/mm2. A monoexponential ADC value was also estimated using the entire range of b-values. Correlation between IVIM-DWI and DCE-MRI parameters was assessed using a Spearman rank correlation test. Wilcoxon signed-rank non-parametric test was used to assess whether there was a significant change in parameters following NACT.
Results
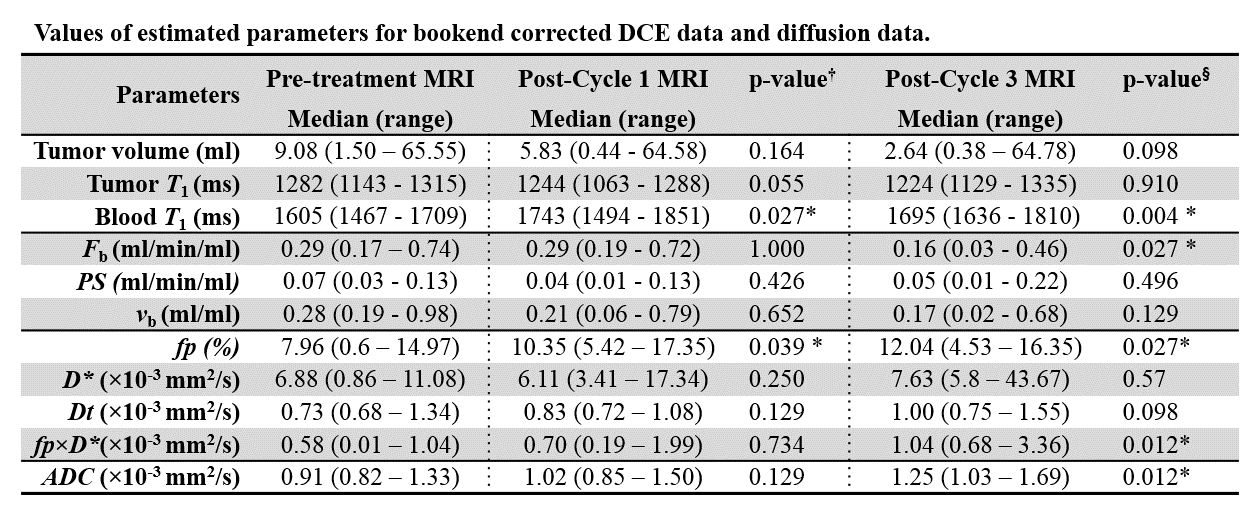
An example of the effect of bookend correction on the ΔR1 series of a breast tumor is shown in Figure 1, with the corresponding model fits. Figure 2 illustrates box plots for the resulting parameter estimates from baseline-corrected and bookend-corrected data. There were no significant changes in the parameter estimates from the bookend corrected DCE data between pre-treatment and post-cycle 1. Fb decreased significantly following cycle 3 of NACT. For the baseline-corrected data the results were more variable - Fb decreased significantly following cycle 3, vb increased after cycle 1 but decreased following cycle 3. For DWI, fp increased significantly following 1 and 3 cycles of NACT, whereas fp×D* and ADC increased significantly following 3 cycles. Table 2 summarizes the results for bookend corrected and diffusion data. Spearman rank tests revealed no significant correlation between any of the DCE-MRI and IVIM-DWI parameters.Discussion
Bookend correction reduced variability in the tracer kinetic parameter estimates between patients and across cycles of NACT. A reproducibility study is needed to establish the validity of the bookend corrected technique over the conventional baseline-corrected method.
Despite the narrative that IVIM parameters are related to perfusion7, we saw no correlation with DCE parameters at all. Furthermore, while blood flow and volume decreased in response to NACT, fp and fp×D* increased. The results suggest that the IVIM parameters that describe the fast components of diffusion in breast tumors are ill-defined and further investigations are needed to establish the underlying physiological processes they reflect.
Acknowledgements
The study was funded by Breast Cancer Now (award 2014MayPR241).References
1. Sourbron SP, Buckley DL. Tracer kinetic modelling in MRI: estimating perfusion and capillary permeability. Phys Med Biol. 2011;57:R1-R33.
2. Taouli B, Beer AJ, Chenevert T, et al. Diffusion-weighted imaging outside the brain: Consensus statement from an ISMRM-sponsored workshop. J Magn Reson Imaging. 2016;44(3):521-540.
3. Brix G, Schad LR, Deimling M, et al. Fast and precise T1 imaging using a TOMROP sequence. Magn Reson Imaging. 1990;8(4):351-356.
4. Kershaw LE, Hutchinson CE, Buckley DL. Benign prostatic hyperplasia: Evaluation of T1, T2, and microvascular characteristics with T1-weighted dynamic contrast-enhanced MRI. J Magn Reson Imaging. 2009;29:641-648.
5. Cron GO, Santyr G, Kelcz F. Accurate and Rapid Quantitative Dynamic Contrast-Enhanced Breast MR Imaging Using Spoiled Gradient-Recalled Echoes and Bookend T 1 Measurements. 1999;753:746-753.
6. Meeus EM, Novak J, Withey SB, et al. Evaluation of intravoxel incoherent motion fitting methods in low-perfused tissue. J Magn Reson Imaging. 2016.
7. Le Bihan D, Turner R. The capillary network: a link between IVIM and classical perfusion. Magn Reson Med. 1992;27(1):171-178.
Figures
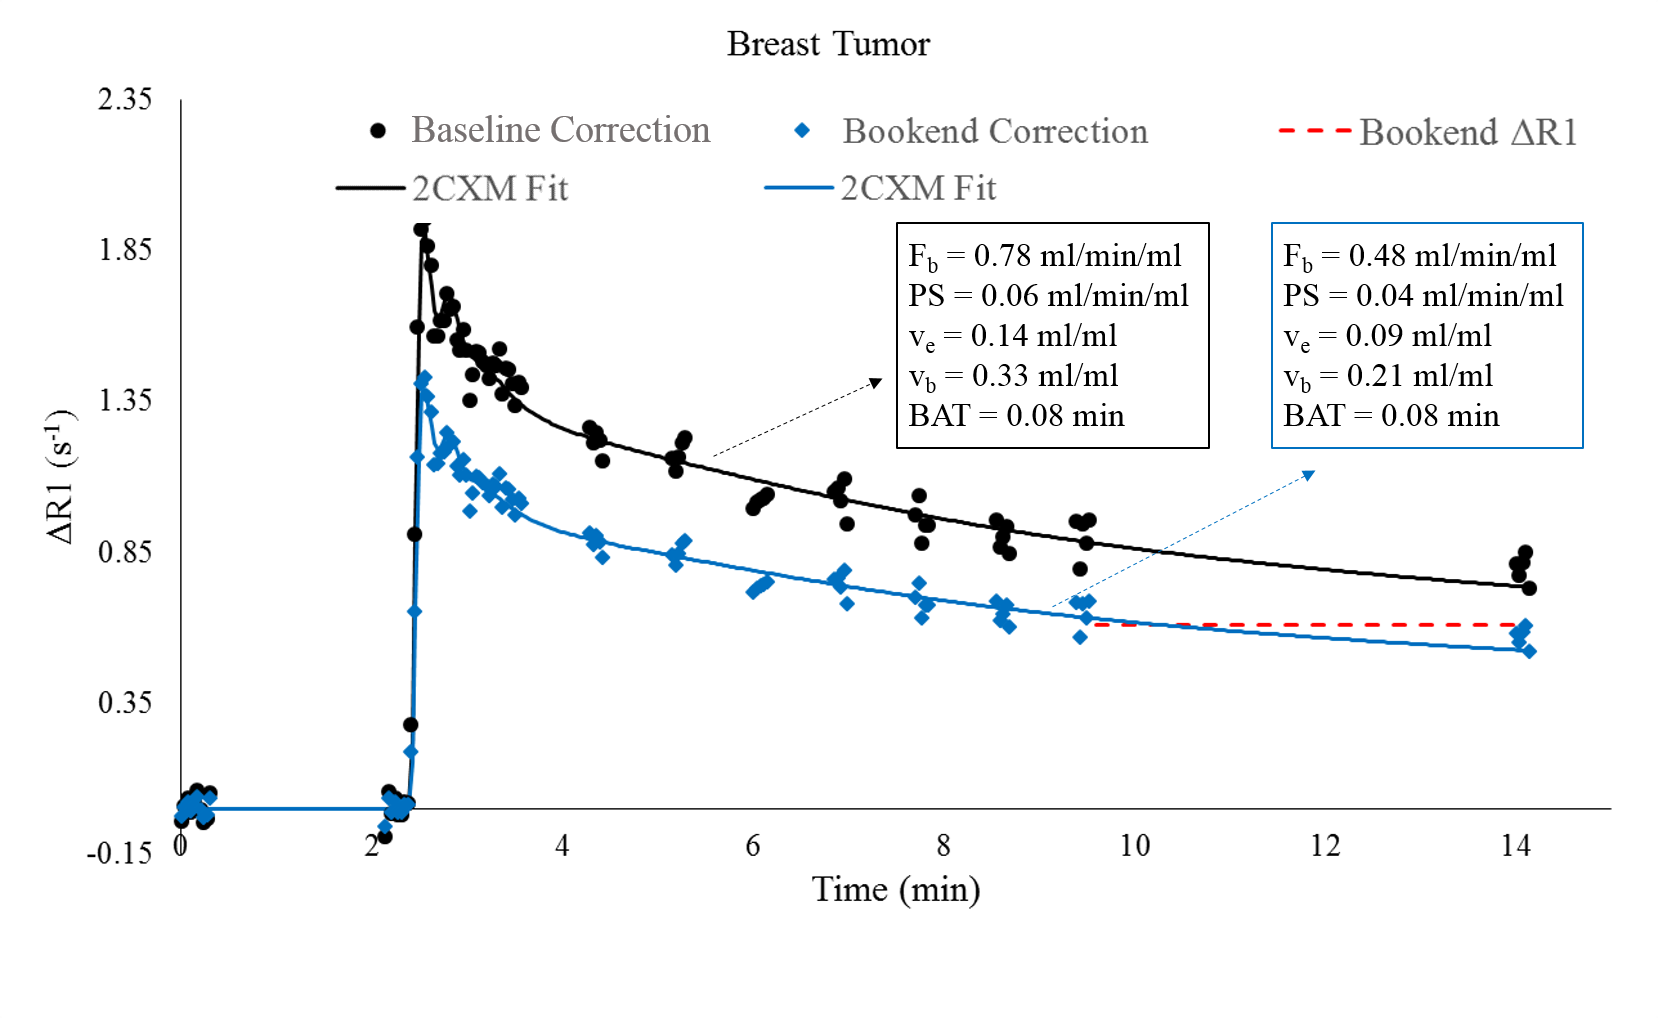
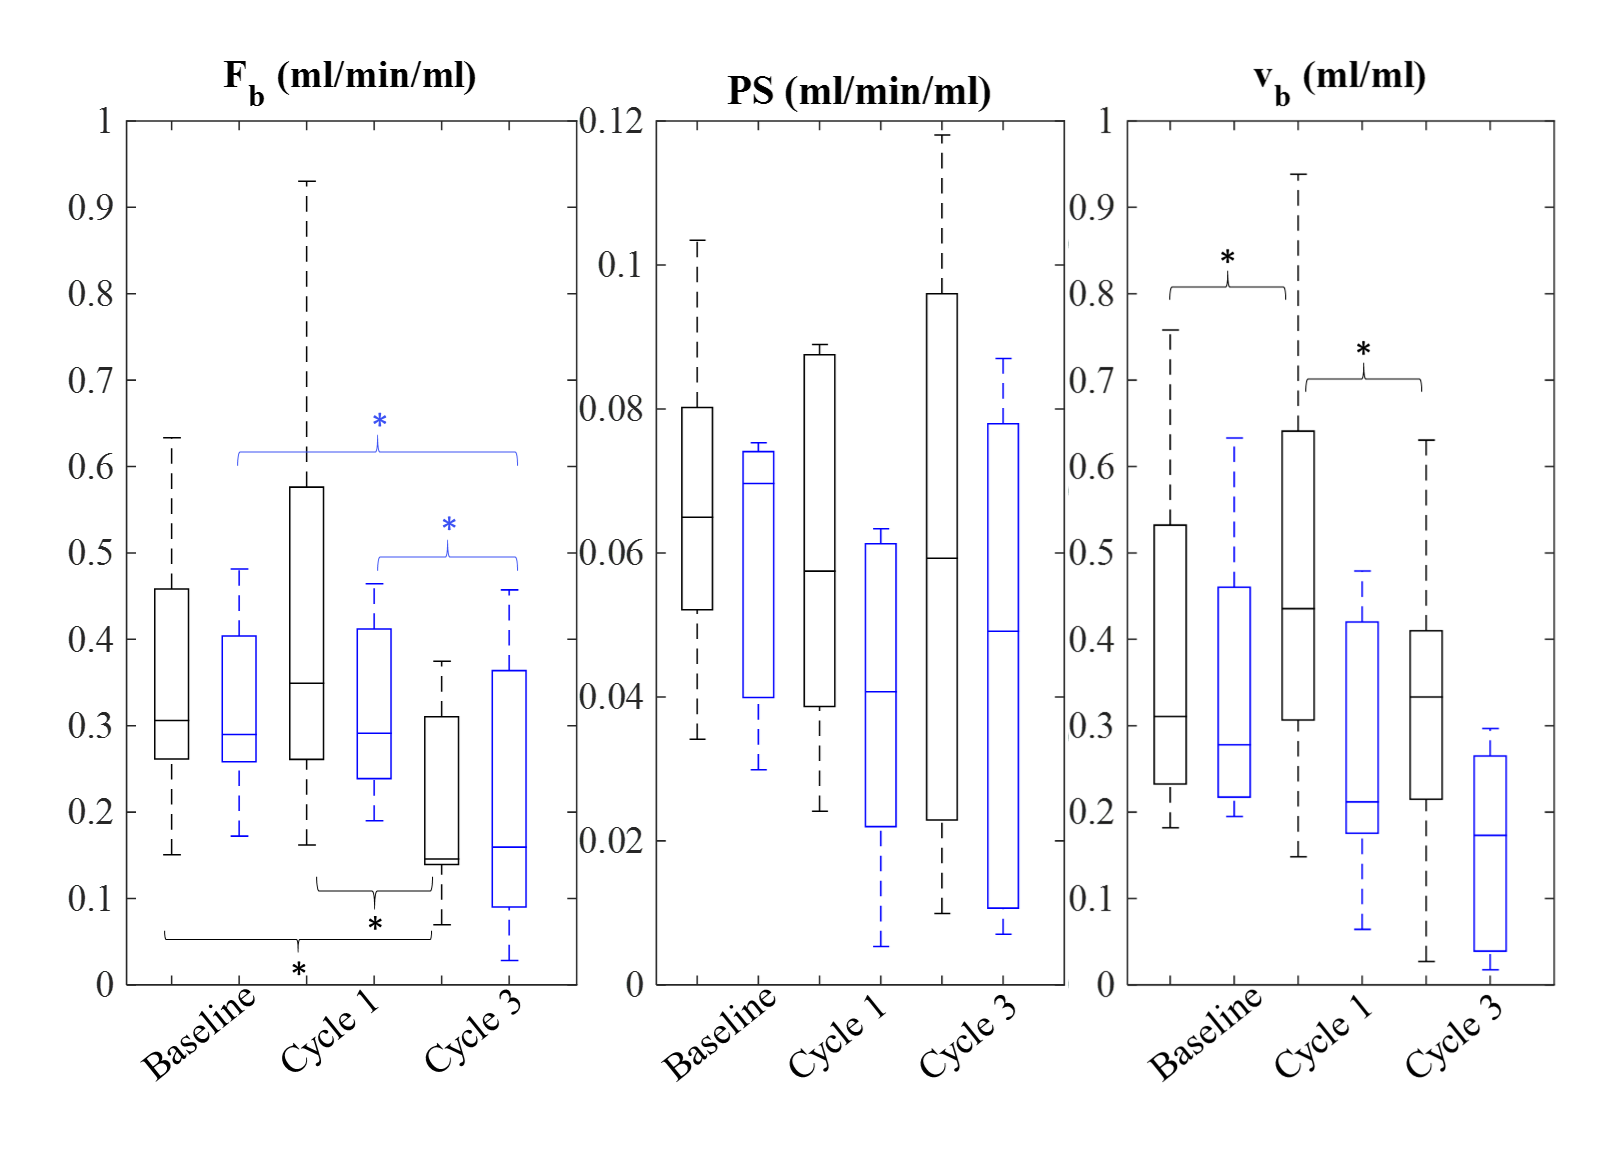
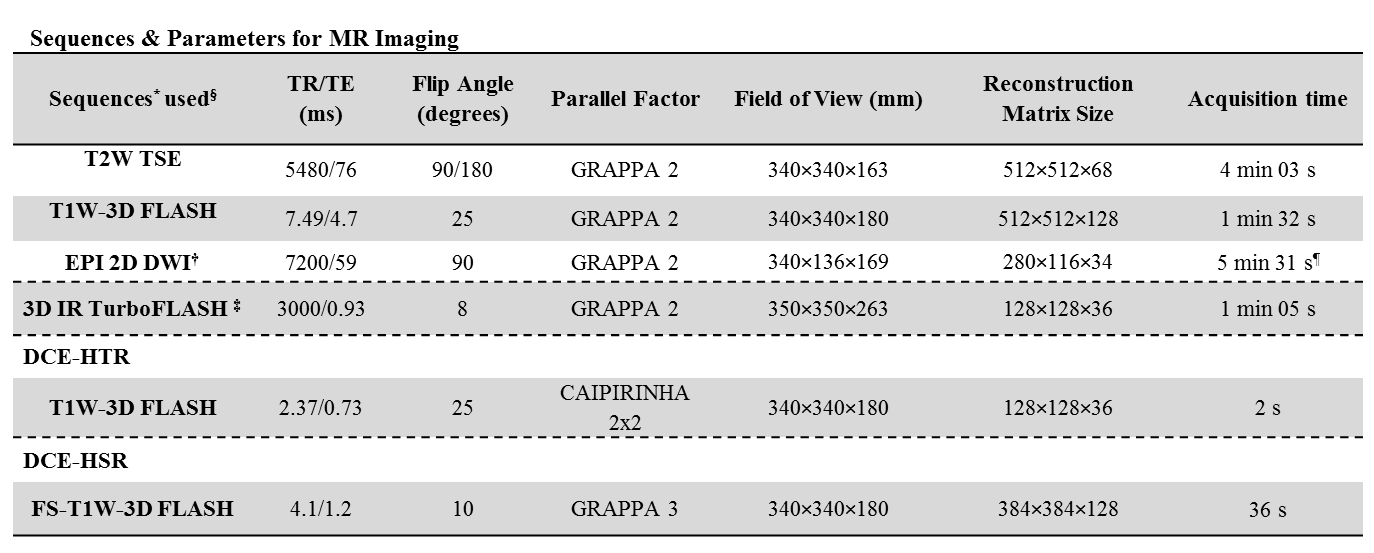
Table 1.*CAIPIRINHA=Controlled Aliasing in Parallel Imaging Results in Higher Acceleration, EPI = echo planar imaging, FLASH=fast low angle shot, FS=fat-suppressed, GRAPPA=generalized auto-calibrating partially parallel acquisition, IR=inversion recovery, T1W=T1-weighted, T2W=T2-weighted, TSE=turbo spin echo.
†b-values: 0/50/100/200/400/800 s/mm2.
¶For all b-values.
‡ IR-TR of 3000 ms at 4 inversion times: 100/600/1200/2800 ms.
§The protocol began with T2W TSE and T1W-3D FLASH, followed by EPI 2D DWI and IR-TurboFLASH to measure the baseline T1,0. The DCE-HTR and DCE-HSR were acquired in an interleaved manner (total dynamic scan was ~12 minutes: 93 HTR and 8 HSR volumes), followed by another IR-TurboFLASH T1 measurement at completion.