0672
Predictive Cytological Topography (PiCT): a Radiopathomics Approach to Mapping Prostate Cancer Cellularity1Radiology, Medical College of Wisconsin, Milwaukee, WI, United States, 2Pathology, Medical College of Wisconsin, Milwaukee, WI, United States, 3Urology, Medical College of Wisconsin, Milwaukee, WI, United States, 4Radiation Oncology, Medical College of Wisconsin, Milwaukee, WI, United States
Synopsis
This study combines radiographic images and pathological microscopy with machine learning to generate predictive maps of pathological features (i.e. new contrasts) based on segmented histological features. Predictive cytological topography (PiCT) maps of cellularity were utilized to detect additional pathologically confirmed high-grade prostate cancer tumors missed by radiologists.
Purpose
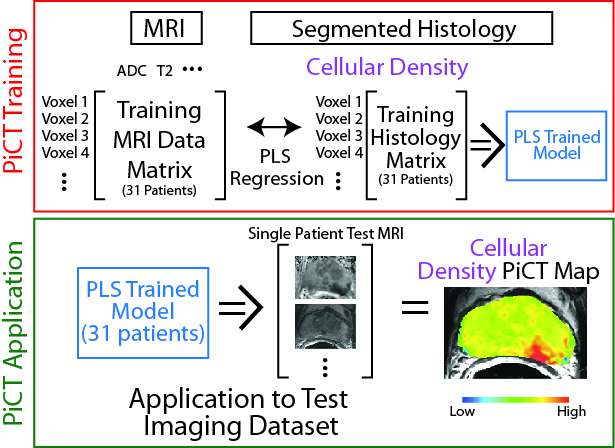
Radiological-pathological (Rad-Path) correlation has recently allowed the validation of prostate cancer imaging technology1,2. Multiparametric MRI (MP-MRI) has shown to be highly accurate at locating targets for biopsy3 and clinical adoption has surged since the introduction of the PI-RADS grading scale.4,5 However, difficulties still remain in this method of prostate cancer detection and grading.6,7 We present a new technique that combines the two cross-modal datasets of MP-MRI and the gold standard, pathological grading, with machine learning to generate predictive maps of histological features. These maps can be used to predict prostate cancer presence with non-invasive imaging alone.Methods
Thirty-two patients undergoing prostatectomy were imaged <2 weeks pre-op using a 3T MRI machine (GE) and MP-MRI. This included diffusion imaging with 10 b-values, dynamic contrast enhanced (DCE) imaging, and T2 weighted imaging. We designed and used custom 3D-printed patient-specific slicing molds to section the prostates in the same orientation in which the imaging was acquired.8-10 Whole-mount sections were paraffin-embedded, H&E stained, digitized, and contoured using custom code developed in Matlab (Mathworks Inc). Segmentation features included lumen, stroma, and cellularity. Digitized histology was co-registered to the T2-weighted MRI using Matlab software and non-linear warping. A partial least squares regression (PLS) machine-learning algorithm was trained with co-localized MRI voxel values and corresponding histology features. A leave one out approach was used to generate Predictive Cytological Topography (PiCT) maps of each of the three histological features (lumen, stroma, and cellularity) for each patient using the histology and corresponding MRI values from all other patients (Figure 1). Blinded observers were asked to highlight regions suspicious for tumor on the PiCT maps. Lesions detected were compared to radiologist reads and the Gleason (G) graded whole mount histology, performed by a board-certified pathologist. A receiver operating characteristic (ROC) analysis was performed to determine the sensitivity and specificity of PiCT mapping compared to the radiologist reads.Results
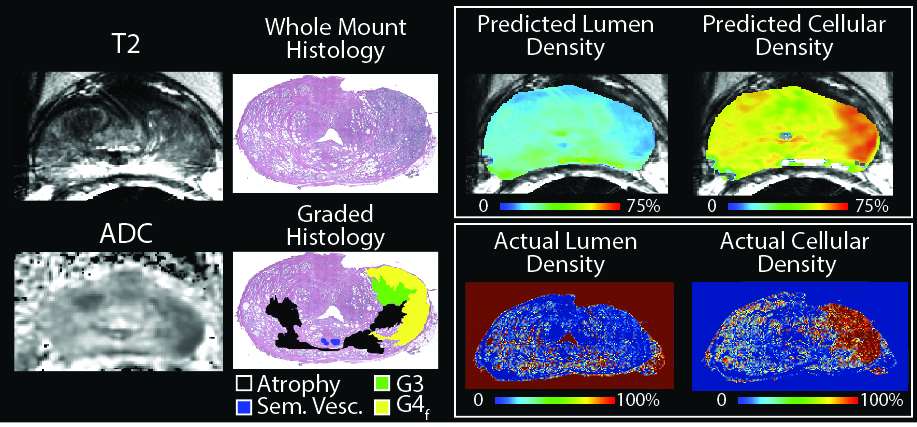
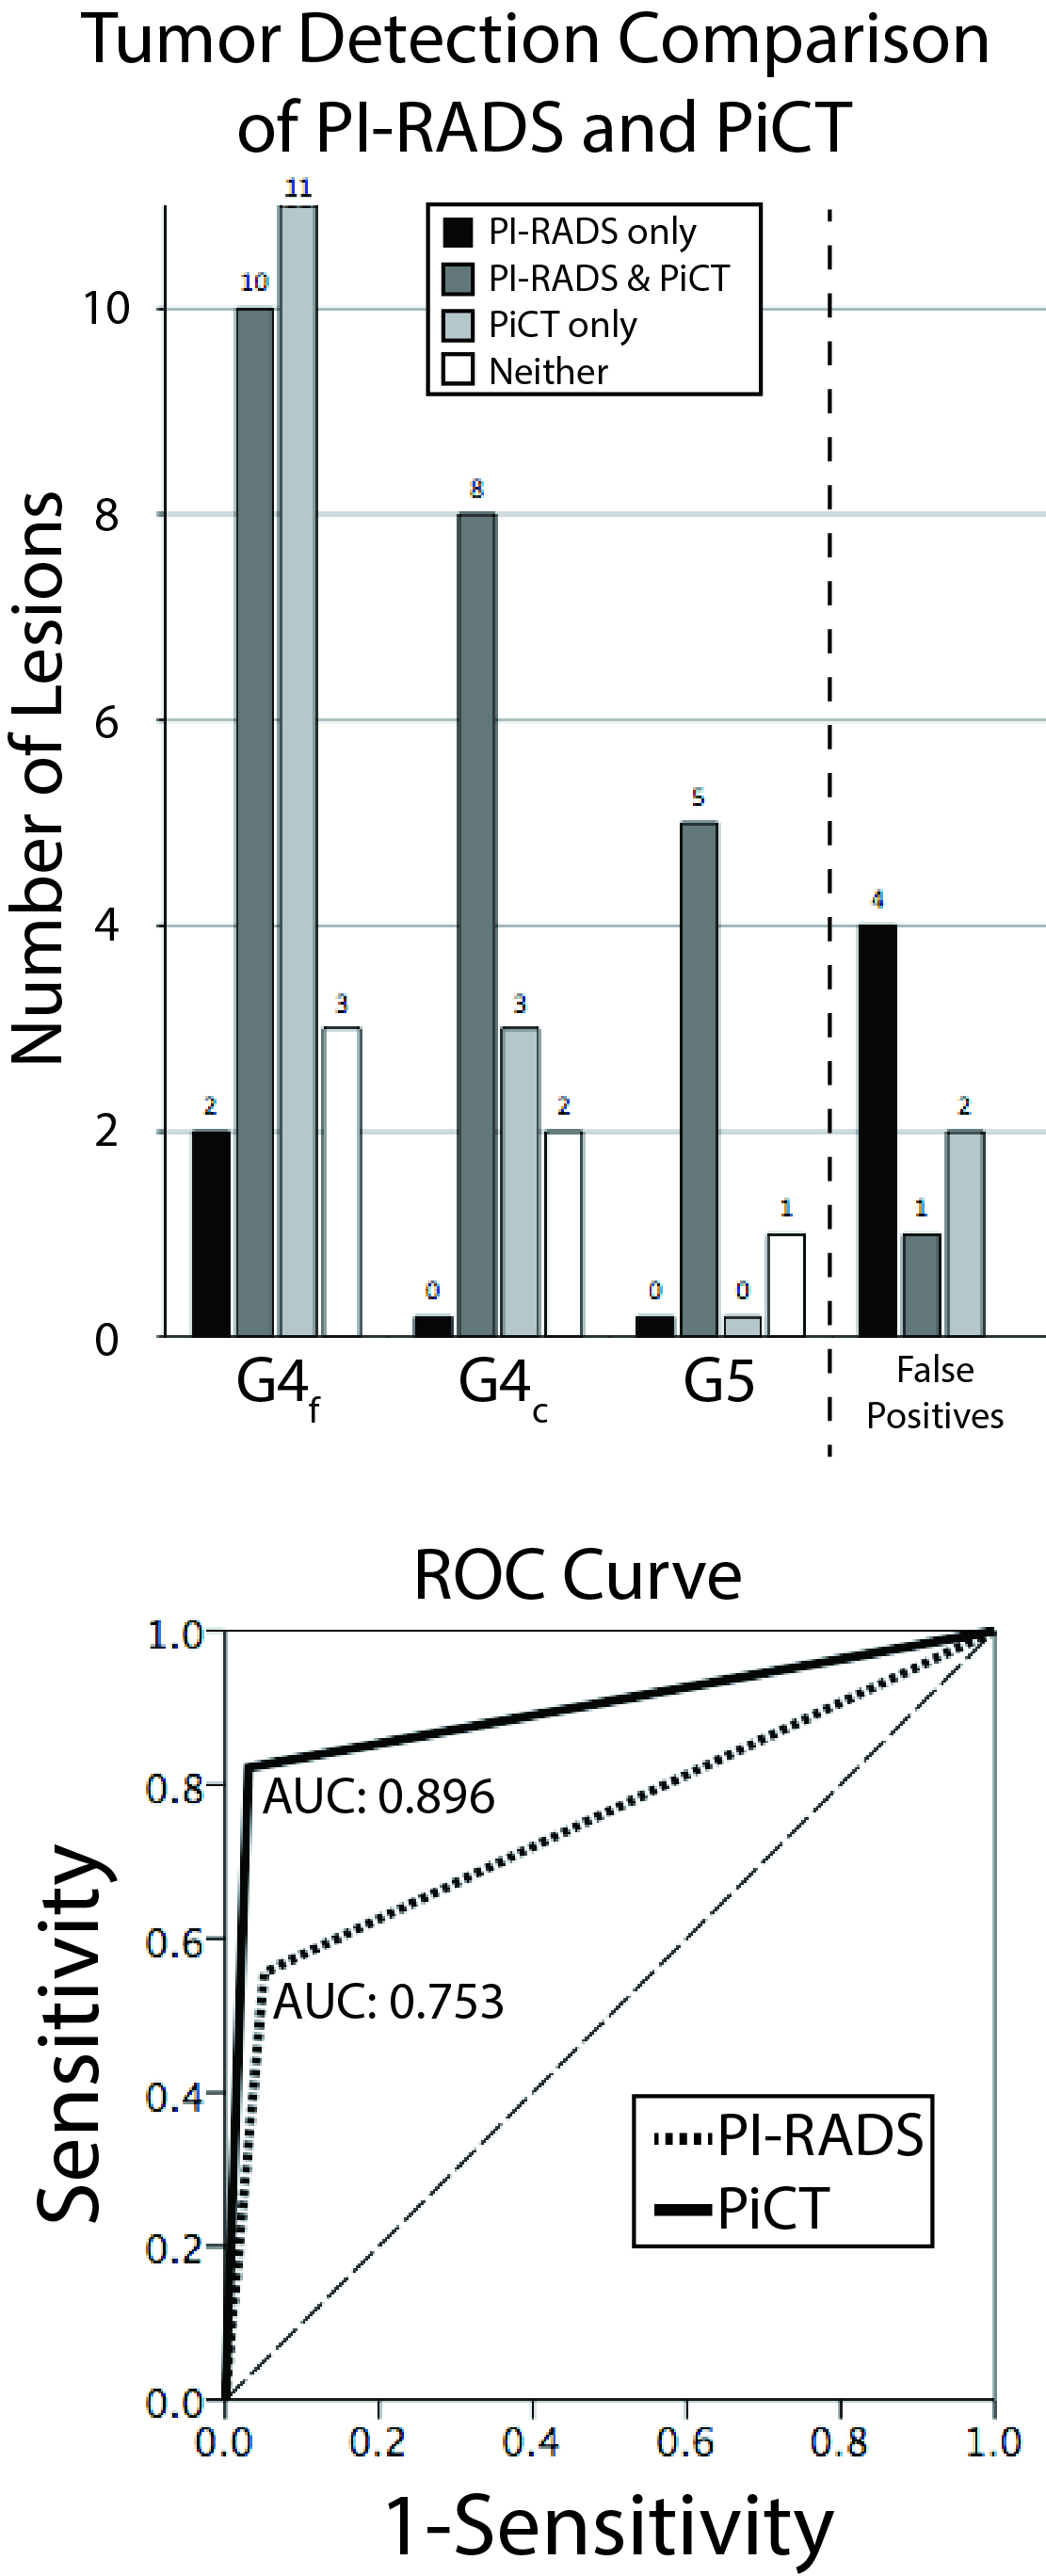
Figure 2 shows an example of the PiCT maps of lumen and cellular density compared to the actual features segmented from histology. Of the lesions identified on pathology, 26 were G4 fused glands (G4f), 13 were G4 cribriform glands (G4c), and six were G5. The PiCT maps detected an additional 11 G4f lesions and 3 G4c lesions missed by radiologists, while radiologists detected three G4f lesions and two G4c lesions missed by PiCT. Three G4f lesions and 2 G4c lesions were not detected by either radiologists or PiCT. Both PiCT and radiologists detected the same five G3 lesions and missed the same one G5 lesion. The ROC area under the curve (AUC) for PiCT maps was 0.896 and the AUC for PI-RADS was 0.753 (P<0.0001 for both) (Figure 3).
Discussion
We generated machine learning-trained maps of histological features based on non-invasive quantitative MR imaging. We found that more high-grade tumors were detected using these maps than radiologists detected with conventional imaging.Conclusion
This study demonstrates a novel approach to radiopathomics applied to prostate cancer imaging.Acknowledgements
Advancing a Healthier Wisconsin, State of Wisconsin Tax Check Off Program for Prostate Cancer Research, NCI U01-CA176110-01A1References
1. Nagarajan R, Margolis D, Raman S, et al. Correlation of Gleason scores with diffusion-weighted imaging findings of prostate cancer. Advances in urology. 2012;2012:374805.
2. Mazaheri Y, Hricak H, Fine SW, et al. Prostate tumor volume measurement with combined T2-weighted imaging and diffusion-weighted MR: correlation with pathologic tumor volume. Radiology. 2009;252(2):449-457.
3. Panebianco V, Barchetti F, Sciarra A, et al. Multiparametric magnetic resonance imaging vs. standard care in men being evaluated for prostate cancer: a randomized study. Urologic oncology. 2015;33(1):17 e11-17.
4. Vargas HA, Hotker AM, Goldman DA, et al. Updated prostate imaging reporting and data system (PIRADS v2) recommendations for the detection of clinically significant prostate cancer using multiparametric MRI: critical evaluation using whole-mount pathology as standard of reference. European radiology. 2016;26(6):1606-1612.
5. Weinreb JC, Barentsz JO, Choyke PL, et al. PI-RADS Prostate Imaging - Reporting and Data System: 2015, Version 2. Eur Urol. 2016;69(1):16-40.
6. Panebianco V, Barchetti F, Barentsz J, et al. Pitfalls in Interpreting mp-MRI of the Prostate: A Pictorial Review with Pathologic Correlation. Insights into imaging. 2015.
7. Notley M, Yu J, Fulcher AS, Turner MA, Cockrell CH, Nguyen D. Diagnosis of recurrent prostate cancer and its mimics at multiparametric prostate MRI. Br J Radiol. 2015;88(1054):20150362.
8. Priester A, Natarajan S, Le JD, et al. A system for evaluating magnetic resonance imaging of prostate cancer using patient-specific 3D printed molds. American journal of clinical and experimental urology. 2014;2(2):127-135.
9. Turkbey B, Mani H, Shah V, et al. Multiparametric 3T prostate magnetic resonance imaging to detect cancer: histopathological correlation using prostatectomy specimens processed in customized magnetic resonance imaging based molds. The Journal of urology. 2011;186(5):1818-1824.
10. Nguyen HS, Milbach N, Hurrell SL, et al. Progressing Bevacizumab-Induced Diffusion Restriction Is Associated with Coagulative Necrosis Surrounded by Viable Tumor and Decreased Overall Survival in Patients with Recurrent Glioblastoma. AJNR Am J Neuroradiol. 2016.
Figures