0671
Novel Informatics Modeling of Magnetic Resonance Imaging Metrics for Characterizing Prostate Lesions with Pathology Correlation.1The Russell H. Morgan Dept of Radiology and Radiological Science, The Johns Hopkins University School of Medicine, Baltimore, MD, United States, 2Sidney Kimmel Comprehensive Cancer Center, The Johns Hopkins University School of Medicine, Baltimore, MD, United States, 3Computer Science, The Johns Hopkins University, Baltimore, MD, United States, 4Dept of Radiology, University of Minnesota, Minneapolis, United States
Synopsis
Precision medicine is increasingly being used in radiological applications. Advanced machine learning coupled with informatics modeling of clinical and radiological variables can provide the foundation to relate to precision medicine in patients with prostate cancer. We test our modeling using multiparametric prostate MR imaging (mpMRI) and MR-guided prostate biopsy with magnetic resonance-transrectal ultrasound (MR-TRUS) fusion to correlate the imaging features with histopathological results.
Introduction
Ultrasound (US) and MRI are imaging modalities used for prostate cancer detection. Most prostate cancers are diagnosed using TRUS [1]. However, by using functional MRI parameters, a set of descriptors that facilitates assessment and accurate diagnosis of prostate lesions can be developed. We hypothesize that there is a relationship between imaging features and the histologic profile of prostate tissue that can be visualized using modern informatics modeling tools. To test this, we developed a machine-learning non-linear dimension reduction (NLDR) algorithm with embedded informatics called Integrated Radiomics Informatics System (IRIS)[2-4 ]. Using these techniques, we compare MRI descriptors to the results from targeted biopsy of the prostate for diagnostic prediction.Method and Materials
We tested our nonlinear informatics modeling in a set of consecutive patients (n=39) who underwent mpMRI of the prostate at 3T and were referred for MR-guided prostate biopsy with MR-TRUS fusion approach to sample indeterminate and suspicious lesions visible on MRI [1]. The clinical and imaging parameters included, PSA, lesion morphology, prostate volume, lesion volume, T2 signal intensity, T1-Pharmacokinetic (PK)-DCE MRI, and Diffusion Weighted Imaging with ADC mapping. Pharmacokinetic (PK) DCE MRI provides quantitative metrics of the volume transfer constant which characterize the transfer of gadolinium from the plasma (Ktrans (min-1)), the fractional volume of the extracellular extravascular space, i.e., the leakage (ve (%)), and the transfer rate constant (kep (min-1)), which describes the reflux of the contrast agent from the extravascular extracellular compartment into the plasma compartment. These parameters are related by the mathematical formula (kep= Ktrans/ ve). Quantitative metrics of Ktrans, ve, and enhancement pattern were calculated. Regions of Interest (ROI) were drawn on both the normal prostate tissue and lesions biopsied with MR-TRUS fusion and defined by T2, ADC mapping and PK-DCE MRI. Our NLDR algorithm, IRIS, uses the multidimensional metrics and embeds these results into a two-dimensional heatmap for clinical decision support [4]. The informatics consist of clinical and pathological variables. We developed a Complex Interaction Network (CIN) which is defined as the dataset formed from the clinical and imaging parameters (Figure 1) [4,5]. This dataset had high dimensionality (d=15) which presents significant challenges for statistical data analysis. Furthermore, these parameters are entangled in highly correlated complex network. We used a NLDR algorithm, ISOMAP to understand these complex interactions in high dimensional space as well as provide a low dimensional visualization[5-7]. ISOMAP transforms a D dimensional space into a d dimensional manifold representation of its intrinsic dimensionality[7]. The NLDR subspace classification method transforms the patient space into a decision support system as shown in Figure 2. Statistical analysis consisted of the calculated sensitivity, specificity and accuracy. The Area under the Curve (AUC) and student’s t-tests were calculated and set at p<0.05.Discussion and Results
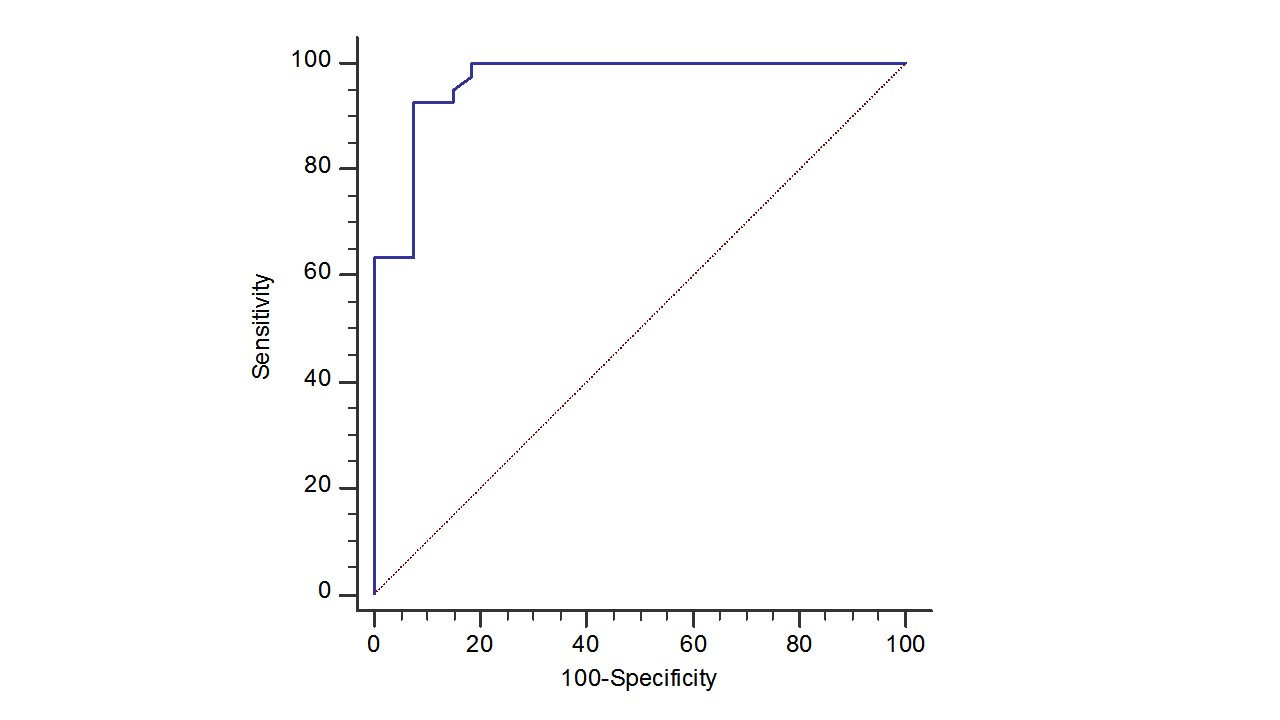
We created an informatics based clinical visualization tool detailing the contribution of each surrogate MRI parameter with the pathological result as shown in Figure 3. There were 39 patients with 73 MR-identified targets for biopsy in the study cohort. The median age of the subjects was 66 ± 6yrs . The PK-DCE parameters, Ktrans for the malignancy were higher (6.7 (1/min)) compared to benign tissue (5.23(1/min)), but the benign lesions had higher EVF than the malignant group. The ADC map values were significantly lower in the malignant than the benign lesions (1.03 vs 1.26x10⁻³mm2/s). The sensitivity and specificity with IRIS when correlated to pathology results was 93% and 92%, respectfully. The AUC was 0.97 (Figure 4). The most important surrogate predictors of prostate cancer determined from the NLDR model were the ADC map values, PK-DCE parameters, and PSA density dependent on prostate volume. These methods provide a basis for a comprehensive interrogation of the relationship and interactions between multiple imaging parameters, clinical variables, and the tumor environment in the clinical arena using an advanced NLDR clinical informatics model. The separation of the different risk groups using our model was striking with the identification of high grade prostatic intraepithelial neoplasia (HGPIN). These initial studies provide insight into the visualization of molecular underpinning of the surrogate radiologic features and may contribute to the foundation for the detection of prostate cancer within an integrated personalized medicine paradigm.Acknowledgements
Funding: 5P30CA006973 (IRAT), U01CA140204, R01CA190299, JHU2012 NR86-01-JA(Siemens) and equipment grant from NvidiaReferences
1. Ma TM, et. Al, . The Role of Multiparametric Magnetic Resonance Imaging/Ultrasound Fusion Biopsy in Active Surveillance. Eur Urol. 2016 May 25.
2. Akhbardeh A, Jacobs MA. Methods and systems for registration of radiological images. US Patent 9,008,462. 2015
3. Jacobs MA, Akhbardeh A, Multiparametric and Multimodality Non-Linear Reduction method for segmentation and classification of radiological imaging. US Patent 9,256,966, 2016
4. Jacobs MA , Akhbardeh A. Advanced Treatment Response Prediction Using Clinical Parameters and Advanced Unsupervised Machine Learning: The Contribution Scattergram. US Patent 20,160,171,695. 2016
5. Parekh V, Jacobs MA. Multidimensional Imaging Radiomics-Geodesics: A Novel Manifold Learning Based Automatic Feature Extraction Method for Diagnostic Prediction in Multiparametric Imaging. Medical Physics. 2016;43(6):3373-3374
6. J. M. Lee, Riemannian manifolds: an introduction to curvature. Springer, New York, 1997
7. J. Tenenbaum, V. Silva and J. Langford, A Global Geometric Framework for Nonlinear Dimensionality Reduction. Science 2000;290, 2319-2323.
Figures
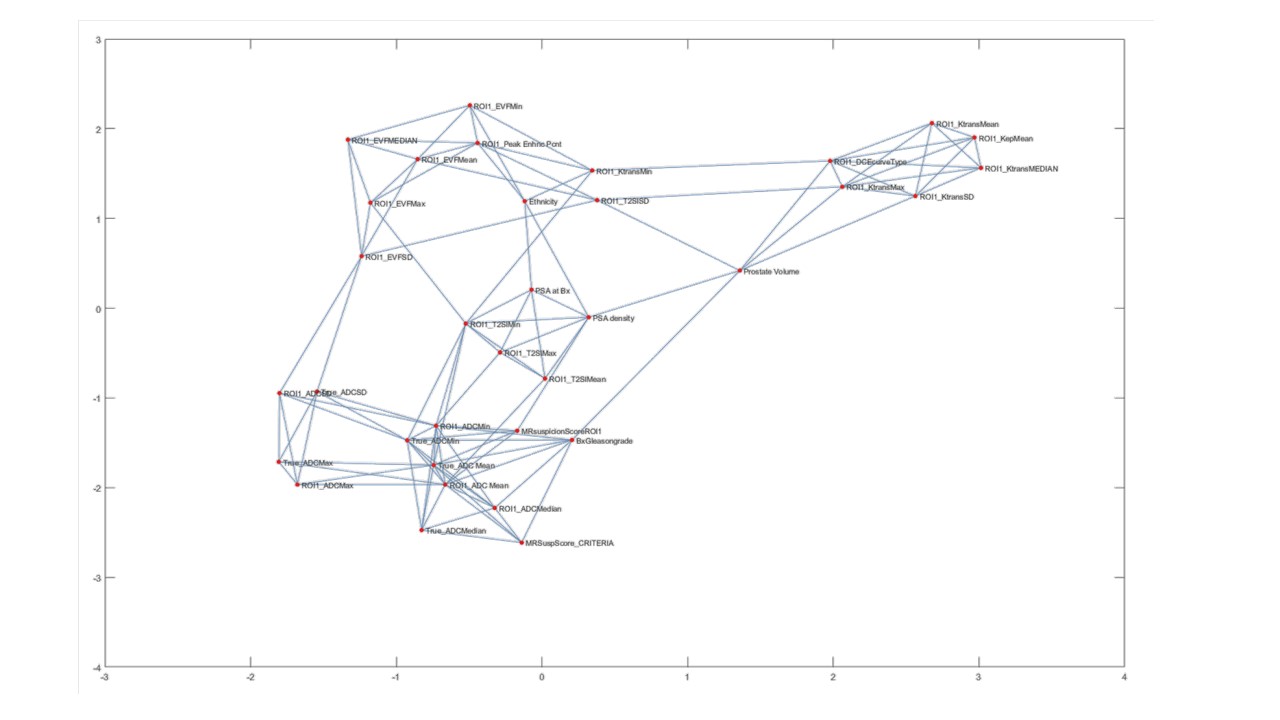
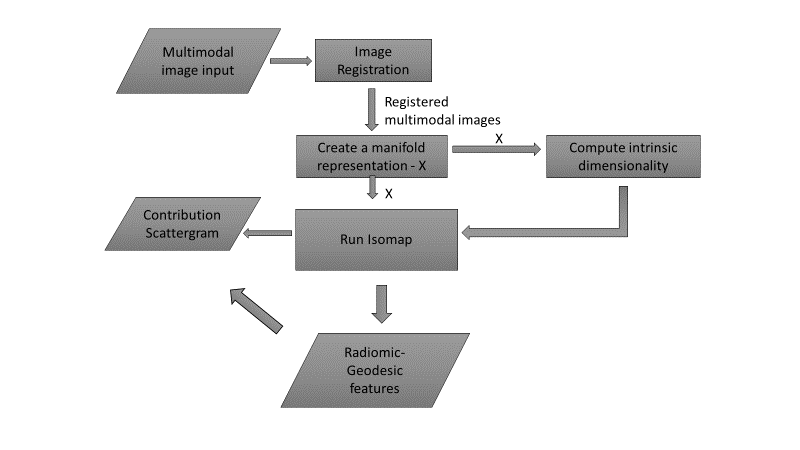
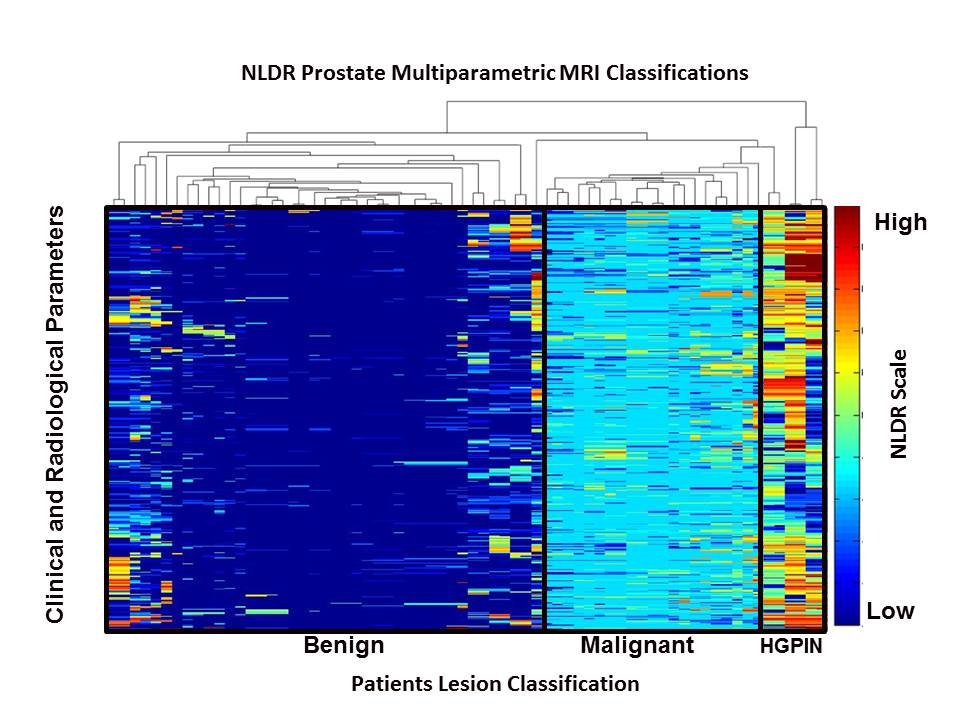
Figure 3. The NLDR informatics heat map demonstrates the stratification of the radiological parameters correlated with the MR-TRUS biopsy results from a group of prostate patients. Each column is a patient with each row representing the predictor learnt for each decision tree showing the risk assessment of the NLDR model.
HGPIN=High-Grade Prostatic Intraepithelial Neoplasia.