0670
Comparing the Diagnostic Accuracy of Luminal Water Imaging with Diffusion-Weighted and Dynamic Contrast-Enhanced MRI for Evaluation of Prostate Cancer.1Department of Physics and Astronomy, University of British Columbia, Vancouver, BC, Canada, 2Department of Urologic Sciences, University of British Columbia, Vancouver, BC, Canada, 3Vancouver Prostate Centre, Vancouver, BC, Canada, 4Department of Radiology, University of British Columbia, Vancouver, BC, Canada, 5Department of Pathology and Laboratory Medicine, University of British Columbia, Vancouver, BC, Canada, 6UBC MRI Research Center, Vancouver, BC, Canada
Synopsis
Luminal water imaging (LWI) is a newly developed MRI technique that has shown promising results for diagnosing and grading of prostate cancer. Incorporating LWI in clinical settings requires a profound investigation on its diagnostic accuracy by comparing it to existing clinical protocols. In this pilot study we have acquired and analyzed LWI, DWI, and DCE-MRI data from 15 patients to compare the diagnostic accuracy of LWI with the other two techniques. Our results show that LWI provides equal or higher accuracy in detection of tumors and better correlation with tumor grade compared to DWI and DCE-MRI.
Introduction
LWI is a new application of quantitative T2 mapping that has shown promising results for detection, and grading of prostatic carcinoma (PCa)1. This technique measures the fractional amount of luminal water which has been shown to be proportional to the percentage area of luminal space in prostatic tissue 2. Due to the fact that the amount of luminal space decreases as tissue transforms from normal to malignant, and the decrease in luminal space increases with Gleason score (GS), LWI can potentially provide valuable information for both detection and grading of PCa. This study was designed with the purpose of evaluating the diagnostic accuracy of LWI directly compared to DCE and DW-MRI, which are the two most commonly used techniques in mp-MRI protocols, and evaluating the significance of adding LWI in to an mp-MRI protocol in detection and grading of PCa.Methods
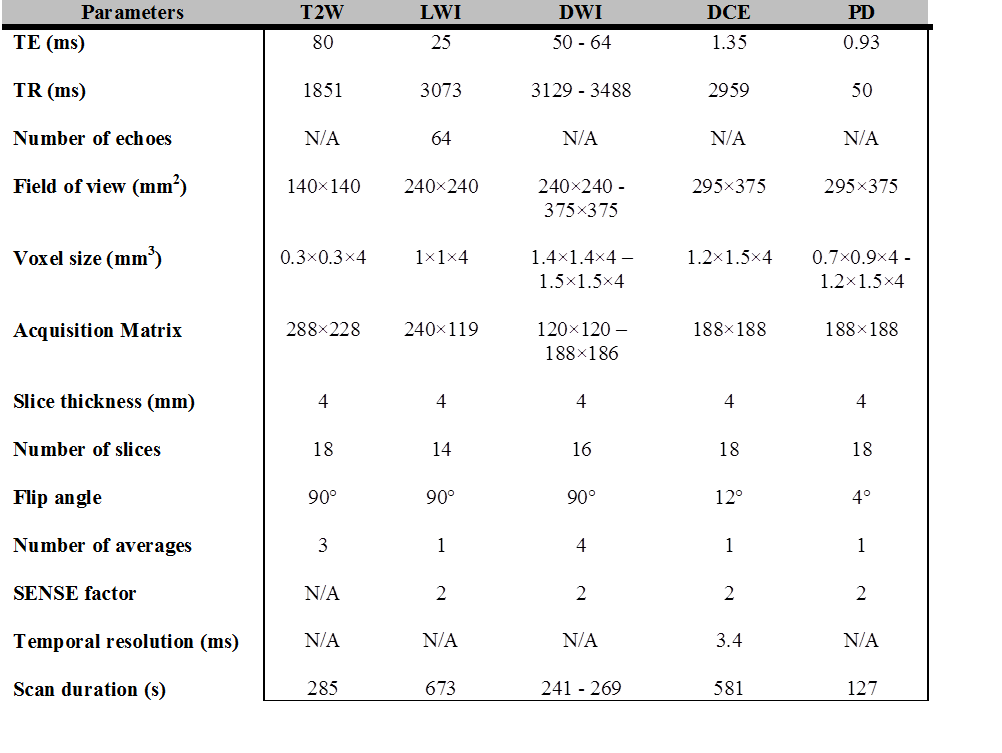
15 patients with biopsy proven PCa were examined with LWI, DWI, and DCE MRI at a 3T scanner [Philips Medical Systems, Best, The Netherlands] prior to undergoing radical prostatectomy. MR signals were acquired with a combined endorectal/pelvic phased-array coils. Sequence parameters are presented in Table 1. From LWI data, signal decay curve for each voxel was extracted and fitted to multi-exponential function to generate maps of 7 parameters called: T2-short, T2-long, gmT2, LWF, Ashort, Along, and N as described previously by Sabouri et al.1. From the set of four DWI images, with b values: 0, 100, 500, and 1000 s/mm2, apparent diffusion coefficient (ADC) was calculated by using the Stejskal-Tanner equation. For processing DCE MRI data, concentration of contrast agent in the tissue was calculated from PD and T1W images as described by Parker et al.3. By fitting the concentration of contrast agent in tissue to the extended Kety model4 values of pharmacokinetic parameters: Ktrans, νe, and νp were calculated. Maps of all MR parameters were correlated to whole-mount histology through digital registration. Receiver operating characteristics (ROC) analysis and logistic generalized linear mixed effect models (GLMMs) were used to evaluate the diagnostic accuracy of individual and combined MR parameters in detection of PCa. In multi-parametric ROC analysis only the parameters that contributed significantly to the GLMM model were used. Correlations between MR parameters and GS were evaluated with application of Spearman’s rank correlation test for each patient and averaging over the entire correlation coefficients. Significance of the correlation between MR parameters and GS was evaluated with application of the one sample t-test. P<0.05 was considered statistically significant.Results
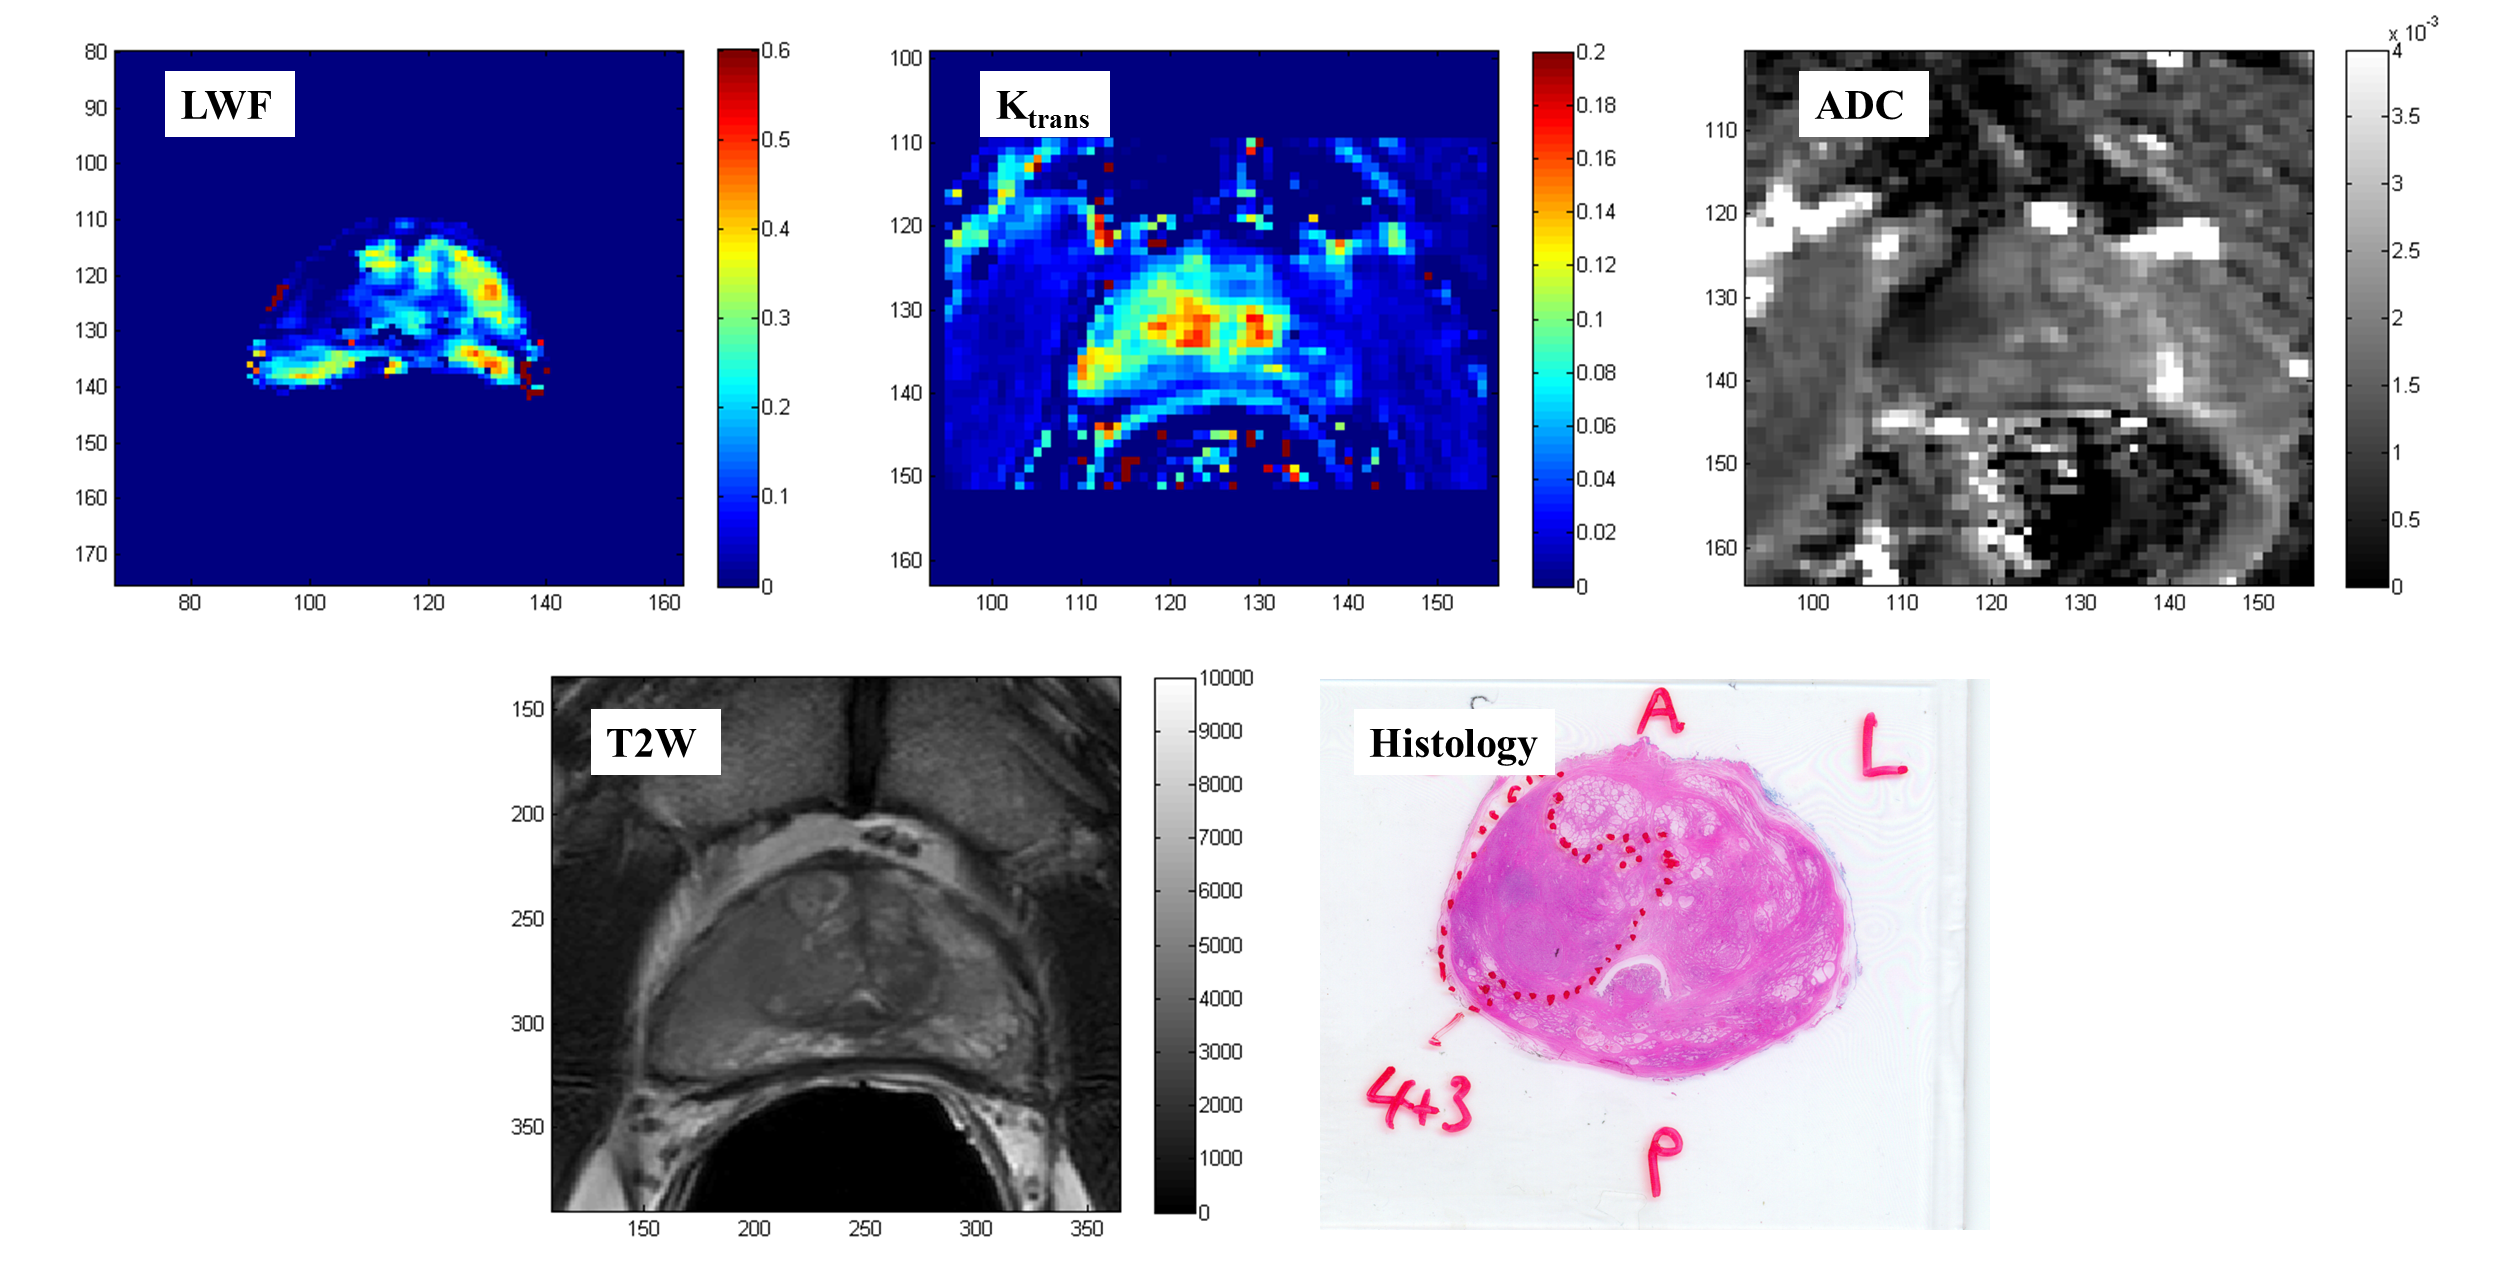
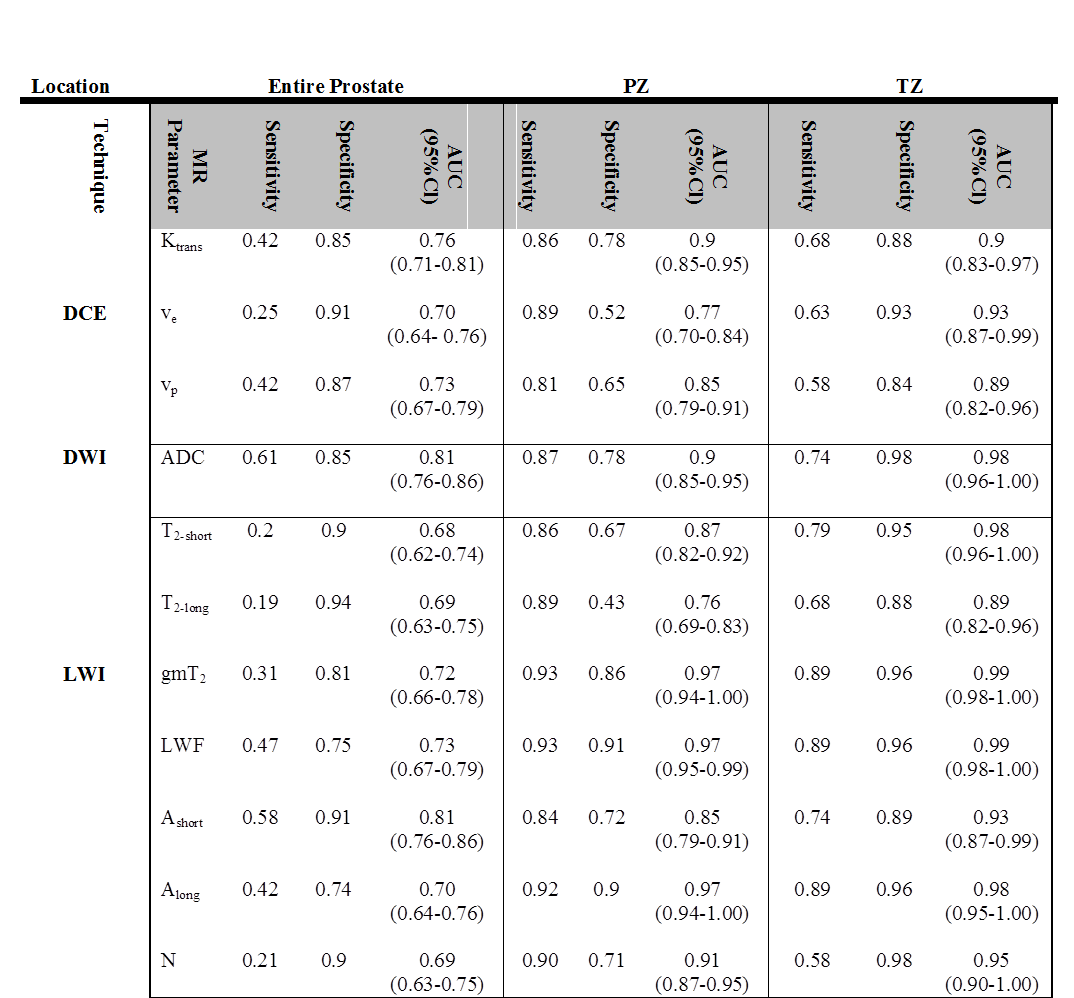
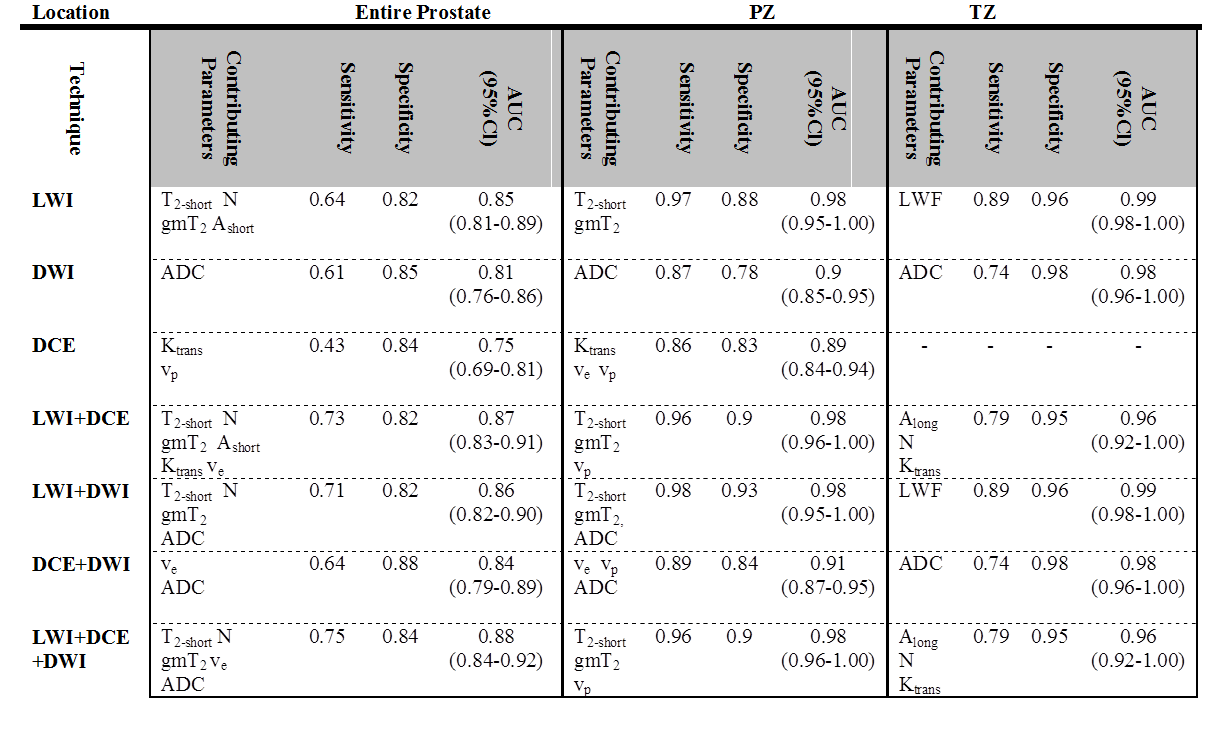
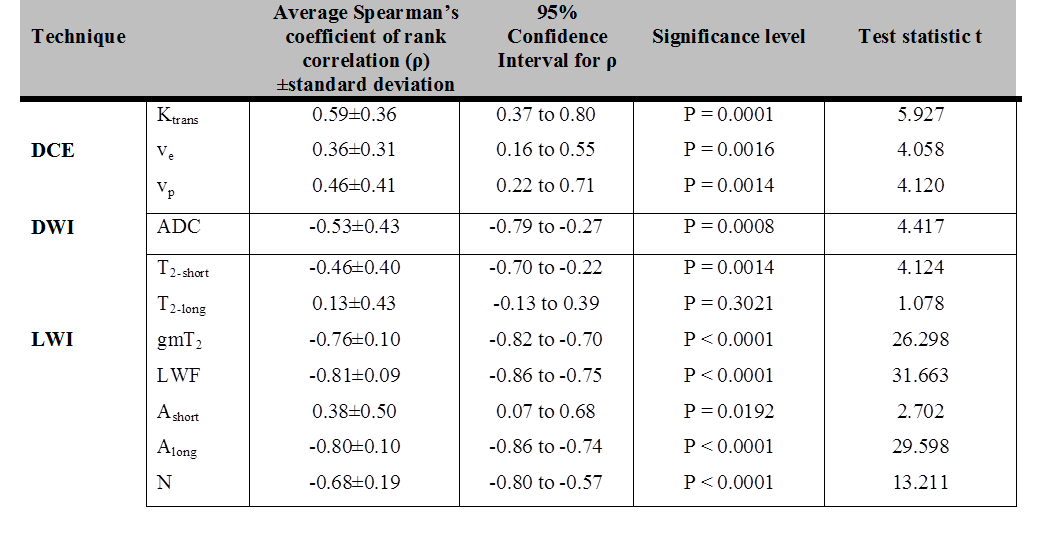
Representative MR parametric maps are shown in Figure 1. The values of sensitivity, specificity and AUC calculated from single and multi-parameter ROC analyses are summarized in Tables 2 and 3. Average Spearman's rank correlation coefficients between MR parameters and GS, as well as the results of t-test are presented in in Table 4. Among the single MRI parameters, the highest area under ROC curve (AUC) was obtained for: ADC and Ashort in the entire prostate, gmT2, LWF, and Along in the peripheral zone (PZ), and gmT2 and LWF in transition zone (TZ). In our multi-parametric analysis, the highest AUC value in the entire prostate was obtained for combination of LWI, DCE, and DWI, while in PZ the highest value of AUC was obtained for combination of LWI with either of the other two techniques. In TZ, there was no significant difference in AUC value obtained from different combinations. In PZ, the strongest correlation with GS was achieved by LWF (ρ:-0.81±0.09, P<0.001).Discussion
Comparing diagnostic accuracies obtained from individual parameters of each technique showed that values of AUC obtained from LWI are equally good or better than those obtained from DCE and DWI in all regions of investigation. Comparing the diagnostic accuracies of combined techniques showed that for both DCE and DWI the accuracy is improved when combined with LWI. In correlations with GS, the highest correlation coefficients were obtained from LWI, suggesting that in clinical settings LWI can provide higher contrast than DCE and DWI between tumors of different GS.Conclusion
Results of this pilot study show that LWI alone performs equally well or better than DCE and DWI in detection of PCa, and performs better than the other two techniques in correlation with GS. This technique can potentially be combined with either DCE or DWI in clinical MP-MRI protocols to increase the accuracy of diagnosis of PCa. To engage LWI in clinical settings, a study with higher number of patients and broader range of GS is required.Acknowledgements
This study has been supported by the Canadian Institutes of Health Research.References
1. Sabouri S, Chang S, Savdie R, et al. MR Luminal water imaging: a novel MRI method for prostate cancer diagnosisd. In:Proceedings of the 24thd Annual Meeting of ISMRM, Singapore, 2016. Abstract 2489.
2. Sabouri S, Fazli L , Chang S, et al. MR measurements of luminal water in prostate gland. In:Proceedings of the 24thd Annual Meeting of ISMRM, Singapore, 2016. Abstract 2487.
3. Parker GJ, Suckling J, Tanner SF, et al.Probing tumor microvascularity by measurement, analysis and display of contrast agent uptake kinetics. J Magn Reson Imaging, 1997;7(3):564-74.
4. Tofts PS, Brix G, Buckley DL, et al. Estimating kinetic parameters from dynamic contrast-enhanced T(1)-weighted MRI of a diffusable tracer: standardized quantities and symbols. J Magn Reson Imaging, 1999;10(3):223-32.
Figures