0668
A computer aided diagnosis (CAD) scoring tool: prostate cancer risk evaluation with PI-RADS v2 Guidelines1Academy for Advanced Interdisciplinary Studies, Peking University, Beijing, People's Republic of China, 2Department of Radiology, Peking University Frist Hospital, Beijing, People's Republic of China, 3Philips Healthcare, Suzhou, China, Beijing, People's Republic of China, 4College of Engineering, Peking University, Beijing, People's Republic of China
Synopsis
The second version of the Prostate Imaging Reporting and Data System (PIRADSv2) indicates the likelihood of a clinically significant cancer with a simplified 5-point scale. To assist radiologists in making diagnostic decisions consistent with the PIRADSv2, we proposed a machine learning-based computer aided diagnosis (CAD) scoring tool of prostate cancer risk evaluation by combining apparent diffusion coefficient (ADC) and T2-weighted MRI-based features. The tool could provide a malignancy prediction color map of 5 scores. The statistical results of the total score test for 130 patients between radiologist graded and the CAD tool showed high accuracy and AUC.
Purpose
Prostate cancer (PCa) is the fourth most common cancer and the second most common cancer in men worldwide, while MR imaging is the most accurate noninvasive method for PCa detection and can also aid local and distant staging [1,2]. In 2015, the second version of the Prostate Imaging Reporting and Data System (PIRADSv2) was published, proposing a simplified 5-point scale with a score of 5 indicating the highest likelihood of a clinically significant cancer [3]. To assist radiologists in making diagnostic decisions consistent with the PIRADSv2, we devised a machine learning-based automatic computer aided diagnosis (CAD) scoring tool for prostate cancer risk evaluation and compared the diagnostic accuracies with PIRADSv2-scoring-based human reader analysis.Materials & Methods
Data source
170 consecutive patients who were suspected of PCa in the prostate MR database were selected for the retrospective study. Among them, 18 patients were confirmed to have PCa by biopsy. All MR images of the prostate cancer were acquired on a 3.0-T whole-body MR scanner (Achieva, Philips Medical Systems, Best, the Netherlands) with an abdomen coil. Each patient had a multiparametric MRI examination including T2 weighted images (T2WI), diffusion weighted images (DWI) and dynamic contrast enhanced images (DCE). All routine prostate MR examinations followed standardized protocols.
Image Segmentation and Scoring
Firstly, the peripheral zone (PZ) and the transition zone (TZ) of each slice were manually segmented by two experienced radiologists using an interactive, locally developed MATLAB-based software package. Regions of interest (ROIs) of a 25 mm2 square were manually delineated both in the suspected and noncancerous regions and then the score of each ROI was graded subjectively according to PIRADSv2 guidelines by the two radiologists without reference to histopathology. For each patient, the total score is the maxium of all the ROI scores in the sampled slices. Because the grading standards of PIRADSv2 for 4 and 5-score prostate cancer are essentially the same except for the size of greatest dimension and definite extraprostatic extension/invasive behavior, the 4 and 5 score cancers are classified into the same category.
Feature extraction
Before analysis, all the MR images were standardized to correct for background and nonlinearity of the intensity scale. Quantified features were grouped into two types: general features (mean, standard deviation) and features derived from the gray level co-occurrence matrix (GLCM) (contrast, correlation, entropy). In total, 10 features were extracted from the T2WI and ADC map.
Detection model
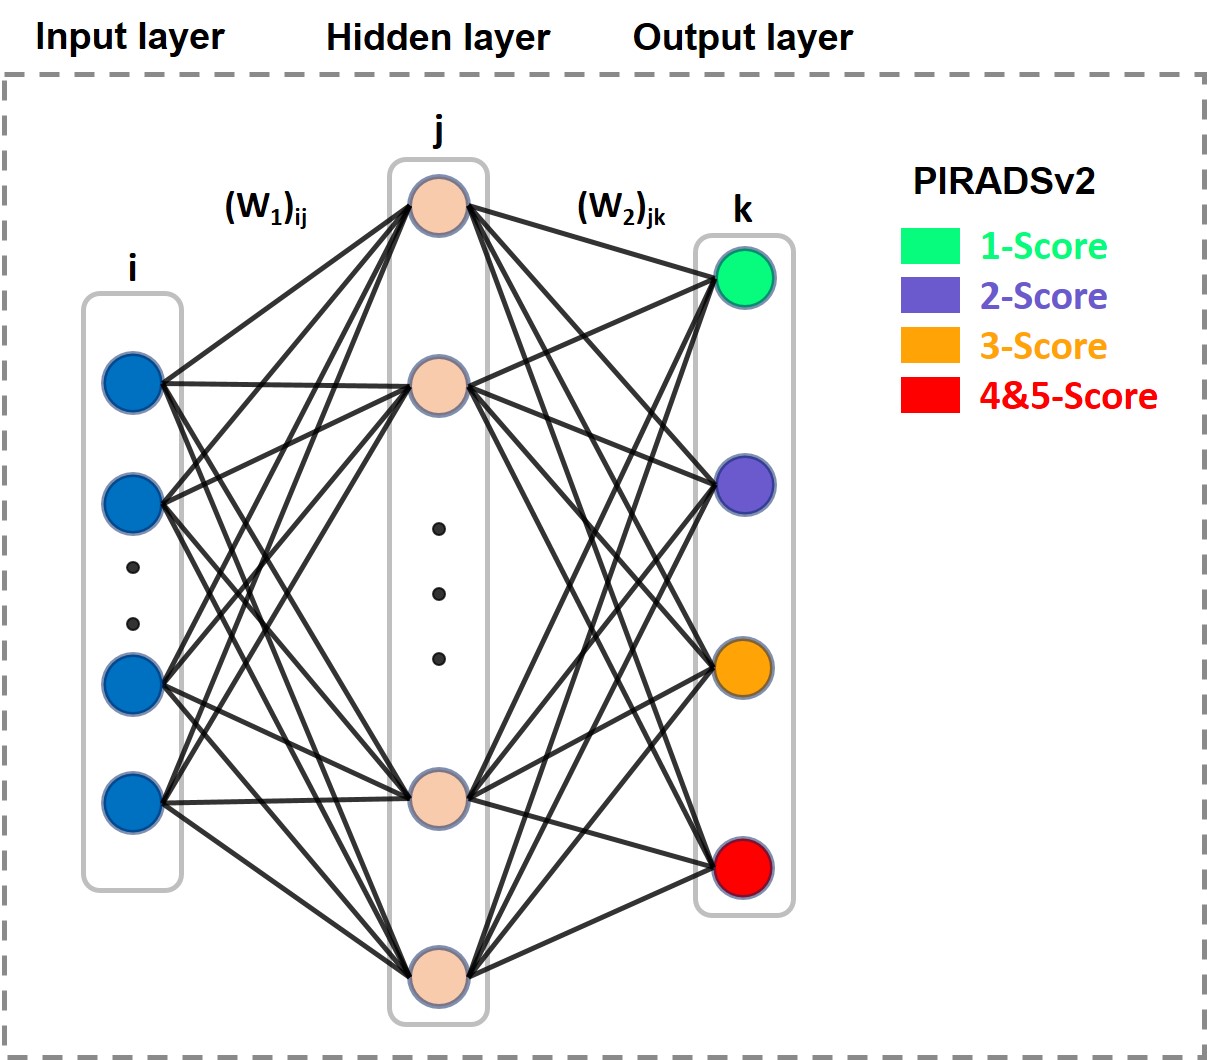
A back-propagation based multi-layer perceptron (MLP) network with 3 layers was used as a detection model (Fig.1). Ten MR images features were chosen to be the inputs of the system, and the output was a probability of each PIRADSv2 score for Pca risk evaluation. 10 neurons were chosen for the hidden layer, and Levenberg–Marquardt (LM) algorithm was used as learning rule. At the first stage, 40 patients were chosen as the database to ensure each score’s sampled ROIs sufficient for ANN model. And then the model was evaluated independently through stratified cross-validation. At the second stage, the MR images of the rest 130 patients were tested and the results were compared with the radiologist graded total score. What’s more, the tool could provide a malignancy prediction value for each image pixel, defined as Malignancy Attention Index (MAI) that can be depicted as a colour map overlay on the original images.
Results
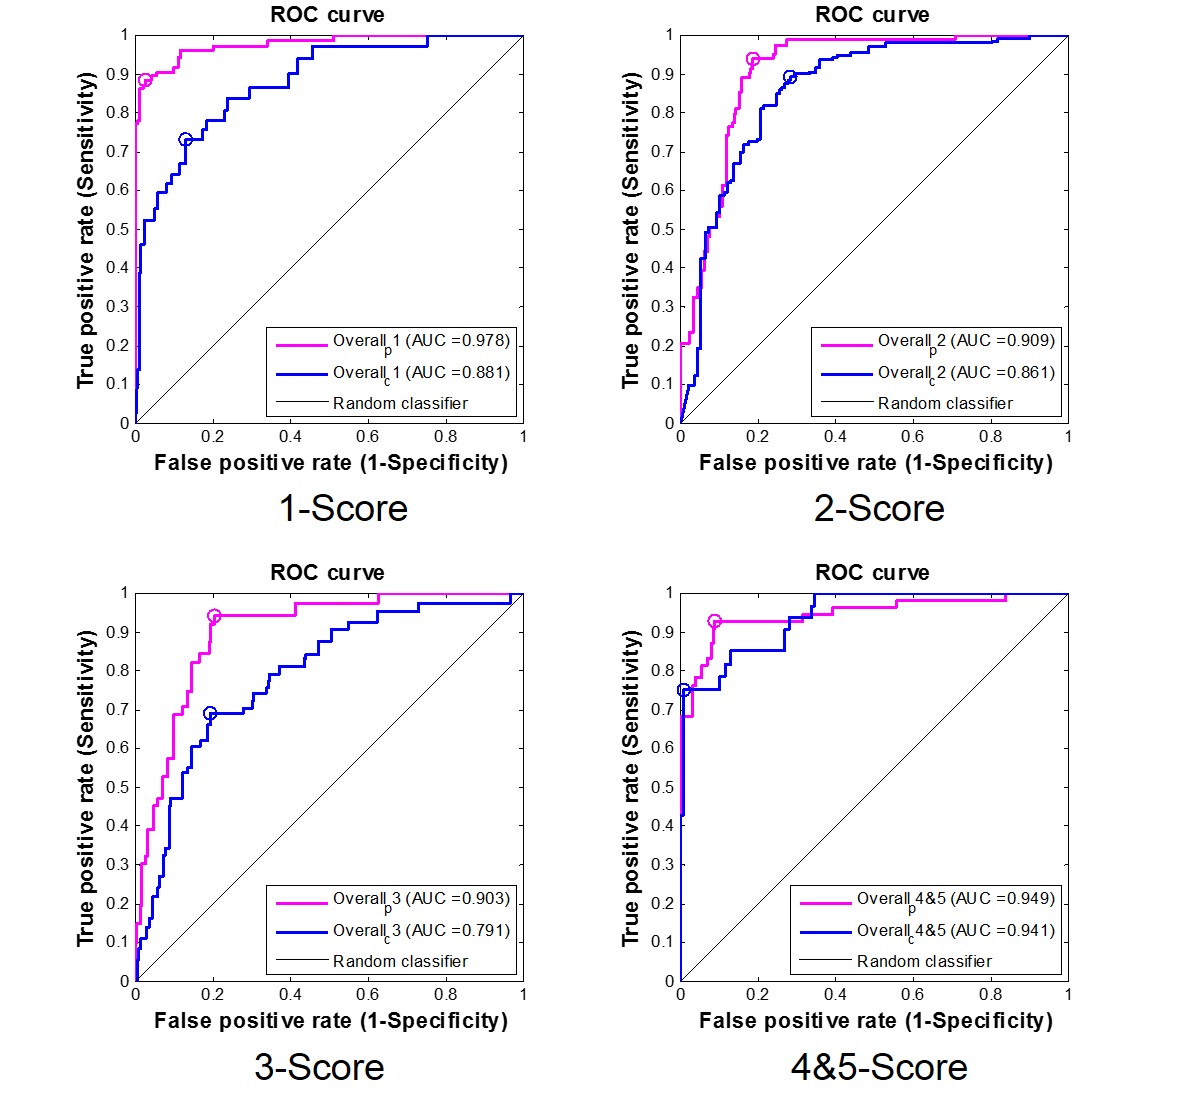
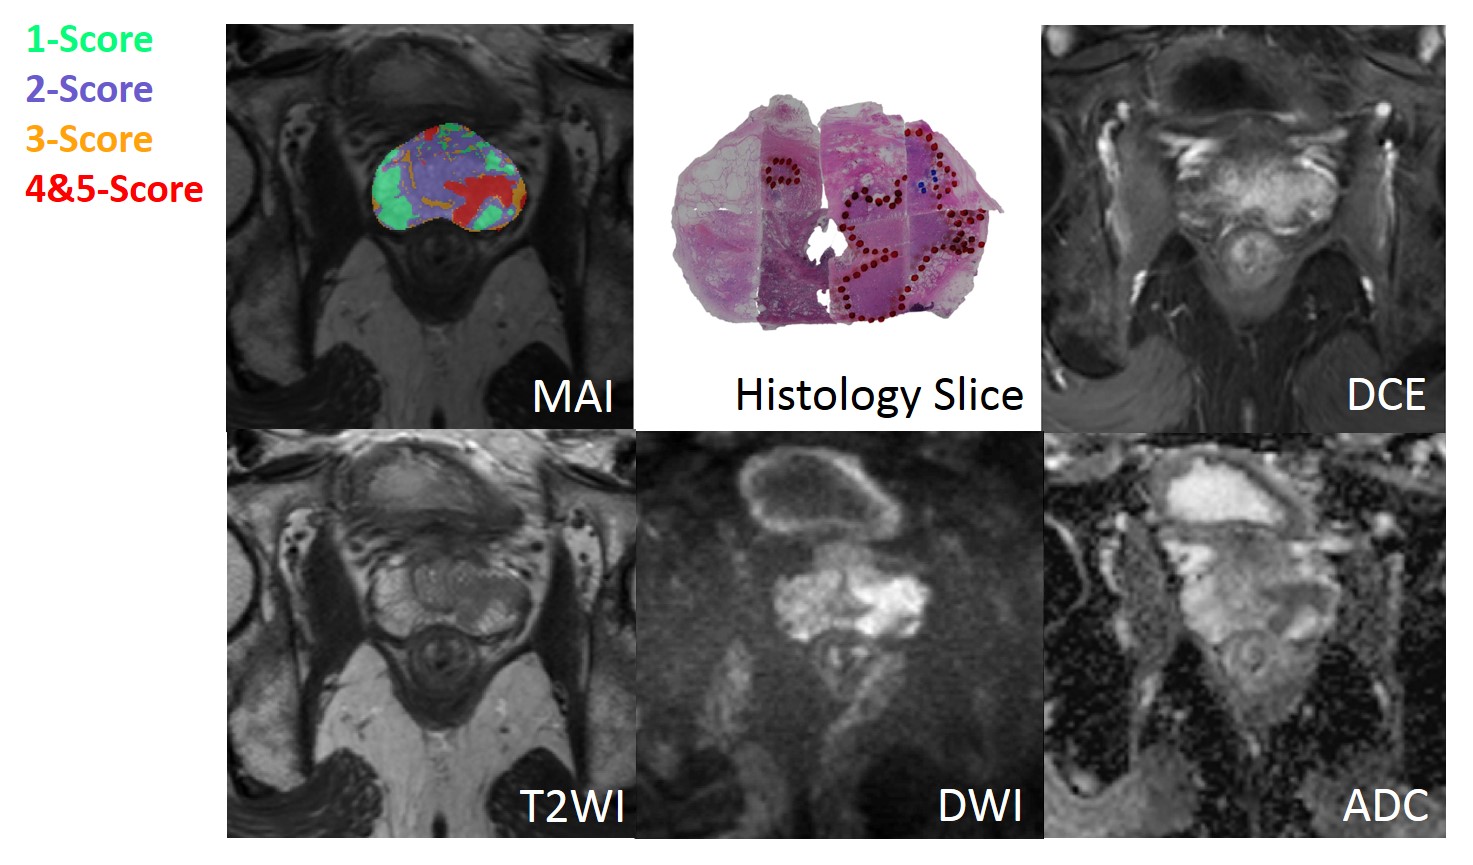
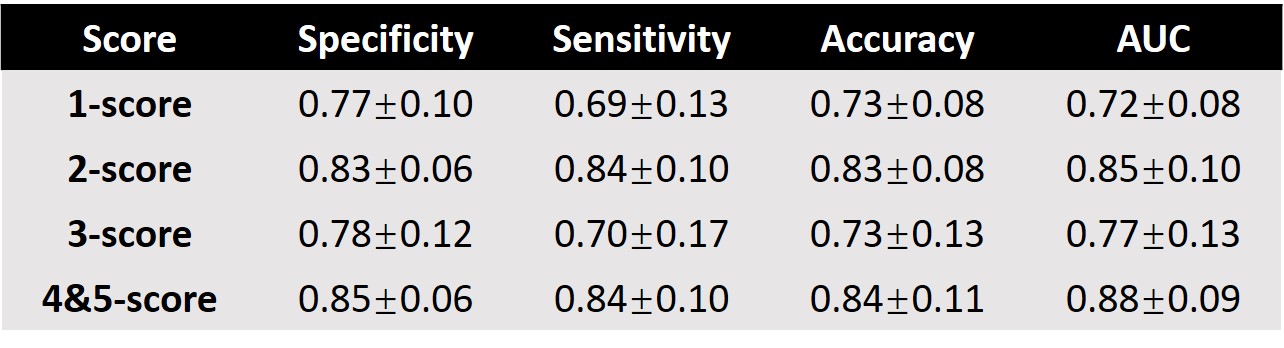
At the first stage in Fig.2, the areas under ROC curve (AUCs) for all five scores were higher than 0.90 (PZ) and 0.79 (TZ) using 10-fold cross validation method (10 times). Good AUC performance was achieved through proper training, which suggested the effectiveness of this model. The statistical results of the total score test for 130 patients between radiologist graded and model predicted are shown in Table 1 and more than 0.73 accuracy and 0.72 AUC[Helen1] can been obtained. Fig.3 shows an example of an MAI map in overlay on a T2W image, with green, blue, orange and red color indicating 1-5 PIRADSv2 scores. Also, Fig.3 shows the Histology Slice, T2WI, DWI, ADC and DCE of the typical prediction example.Discussion/ Conclusion
In the present study, this proposed ANN model could be used in prostate cancer scoring consistent with the PIRADSv2 with high accuracy, on condition that both PZ and TZ were integrated. In conclusion, this ANN model utilizing quantitative features derived from ADC and T2-w MRI together has the potential for advanced lesion assessments, such as cancer extent and staging prediction. In the future, the auto-identification of prostate cancer greatest dimension could be added as the new function in the tool for classification of 4 and 5 score cancers.Acknowledgements
No acknowledgement found.References
[1] Ferlay J, et al. International journal of cancer 2015, 136(5): E359-E386.
[2] Hoeks C M A, et al. Radiology 2011, 261(1): 46-66.
[3] Weinreb J C, et al. European urology 2016, 69(1): 16-40.
Figures