0667
Conductivity of different malignancy grades of invasive ductal carcinomas and fibroadenomas1Philips Research Europe, Hamburg, Germany, 2Tohoku University, Sendai, Japan, 3Shiga University, Hikone, Japan, 4University of Chicago, IL, United States
Synopsis
In ex vivo studies, breast tumors exhibit a significantly altered electric conductivity, measurable in vivo using “Electric Properties Tomography”. A significant conductivity difference was reported between benign and malignant breast tumors and between invasive and in situ carcinomas. This study tested a correlation between conductivity and WHO grade of invasive ductal carcinomas (IDCs) and benign fibroadenomas. A clear conductivity difference was found between IDC grade 1 and grade 2, as well as between IDC grade 1 and grade 3. No clear difference was found between fibroadenoma and IDC grade 1, as well as between IDC grade 2 and grade 3.
Purpose
According to ex vivo studies, breast tumors exhibit a significantly altered electric conductivity [1,2], which can be measured non-invasively in vivo using “Electric Properties Tomography” (EPT) [3]. A statistically significant conductivity difference has been reported between benign and malignant breast tumors as well as between invasive and in situ carcinomas [4,5]. This study is testing a correlation between conductivity and WHO grade of invasive ductal carcinomas (IDCs), as well as benign fibroadenomas (FAs). To this goal, tumor tissue boundary information of two different MR image types (contrast enhanced images and T2-weighted images) are combined as a priori information to stabilize EPT reconstruction.Theory / Methods
Given the transceive phase φ of a 3D turbo spin echo (TSE) image, EPT estimates tissue conductivity via σ = (Δφ)/(2μ0ω) with the Laplace operator Δ, magnetic permeability μ0 (assumed to be constant), and Larmor frequency ω [3]. Conductivity reconstruction was performed only inside lesion volumes, which have been semi-automatically segmented from pre/post-contrast subtraction images. To avoid artefacts along lesion boundaries, the numerical kernels of Δ and the subsequent median filter [4] were restricted to tissue boundaries extracted via a Canny edge detector from both, the subtraction image as well as the TSE magnitude image. – 25 patients (with 29 lesions in total) were imaged on a 3T system (Philips Achieva TX, Best, Netherlands) with a 16 channel breast coil using a 3D TSE sequence (TR/TE=2000/210 ms, voxel size=0.7×0.7×0.8 mm³). Pathologically proven, 5 lesions were classified as IDC grade 1, 7 lesions were classified as IDC grade 2, 12 lesions were classified as IDC grade 3, and 5 lesions were classified as FA.Results
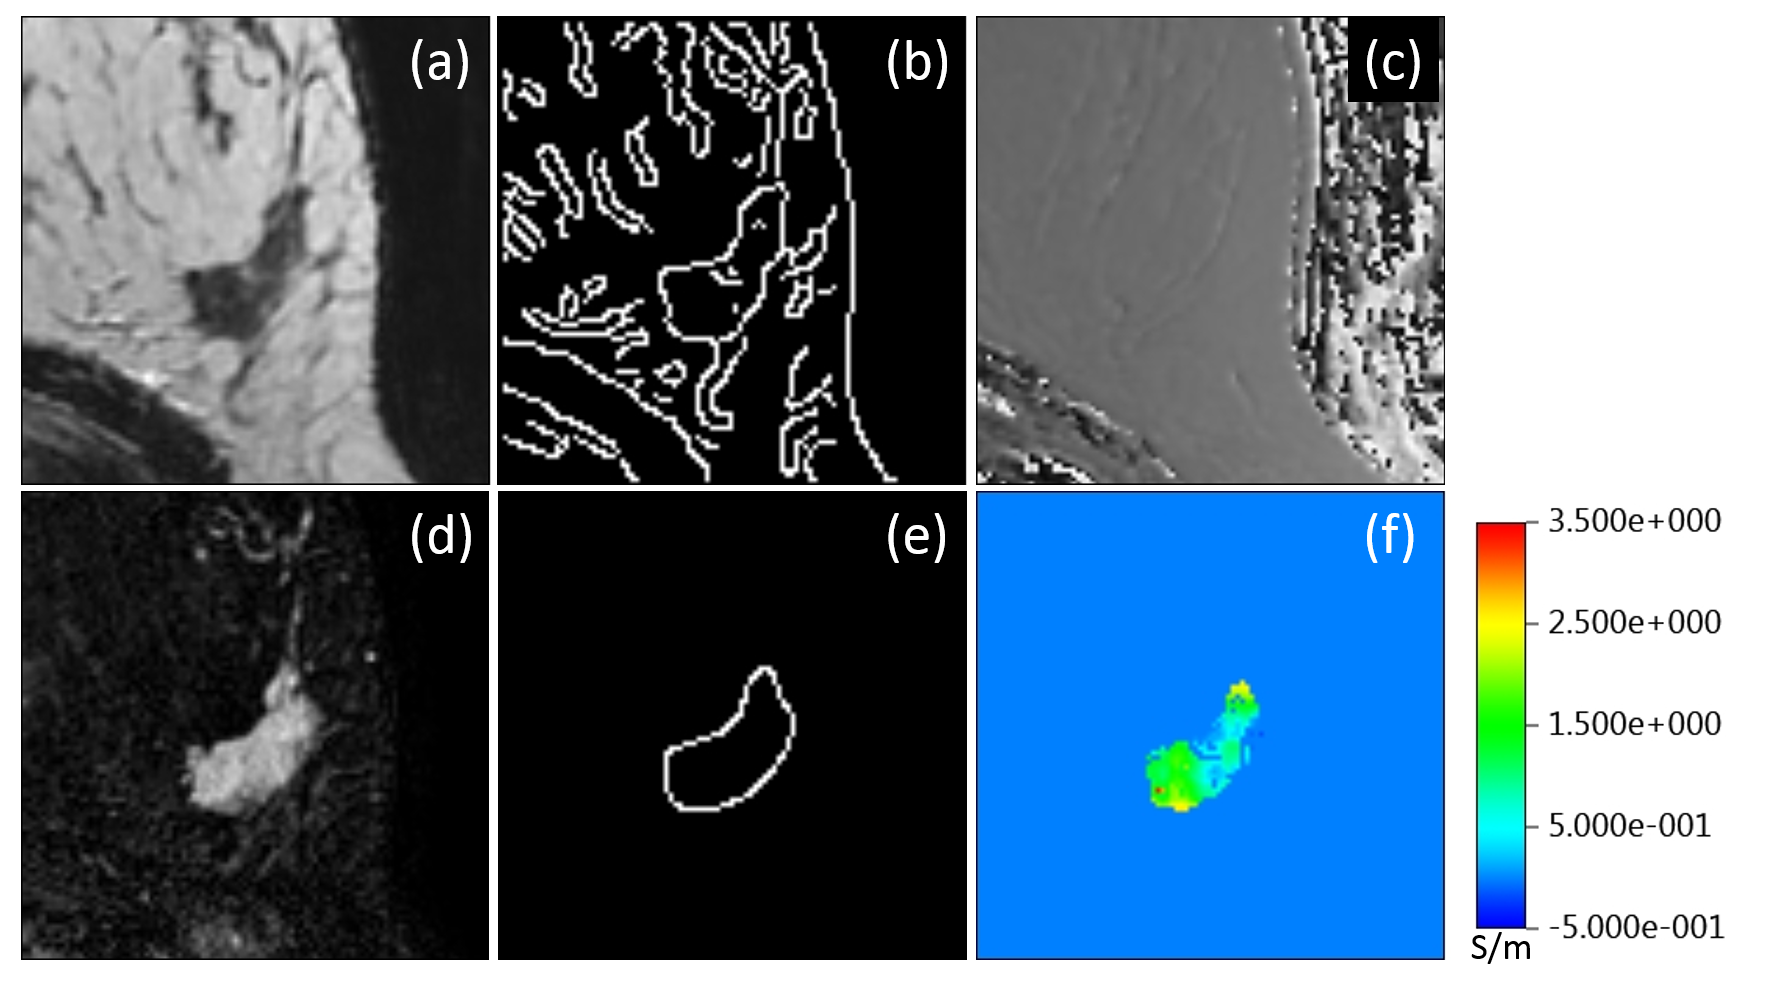
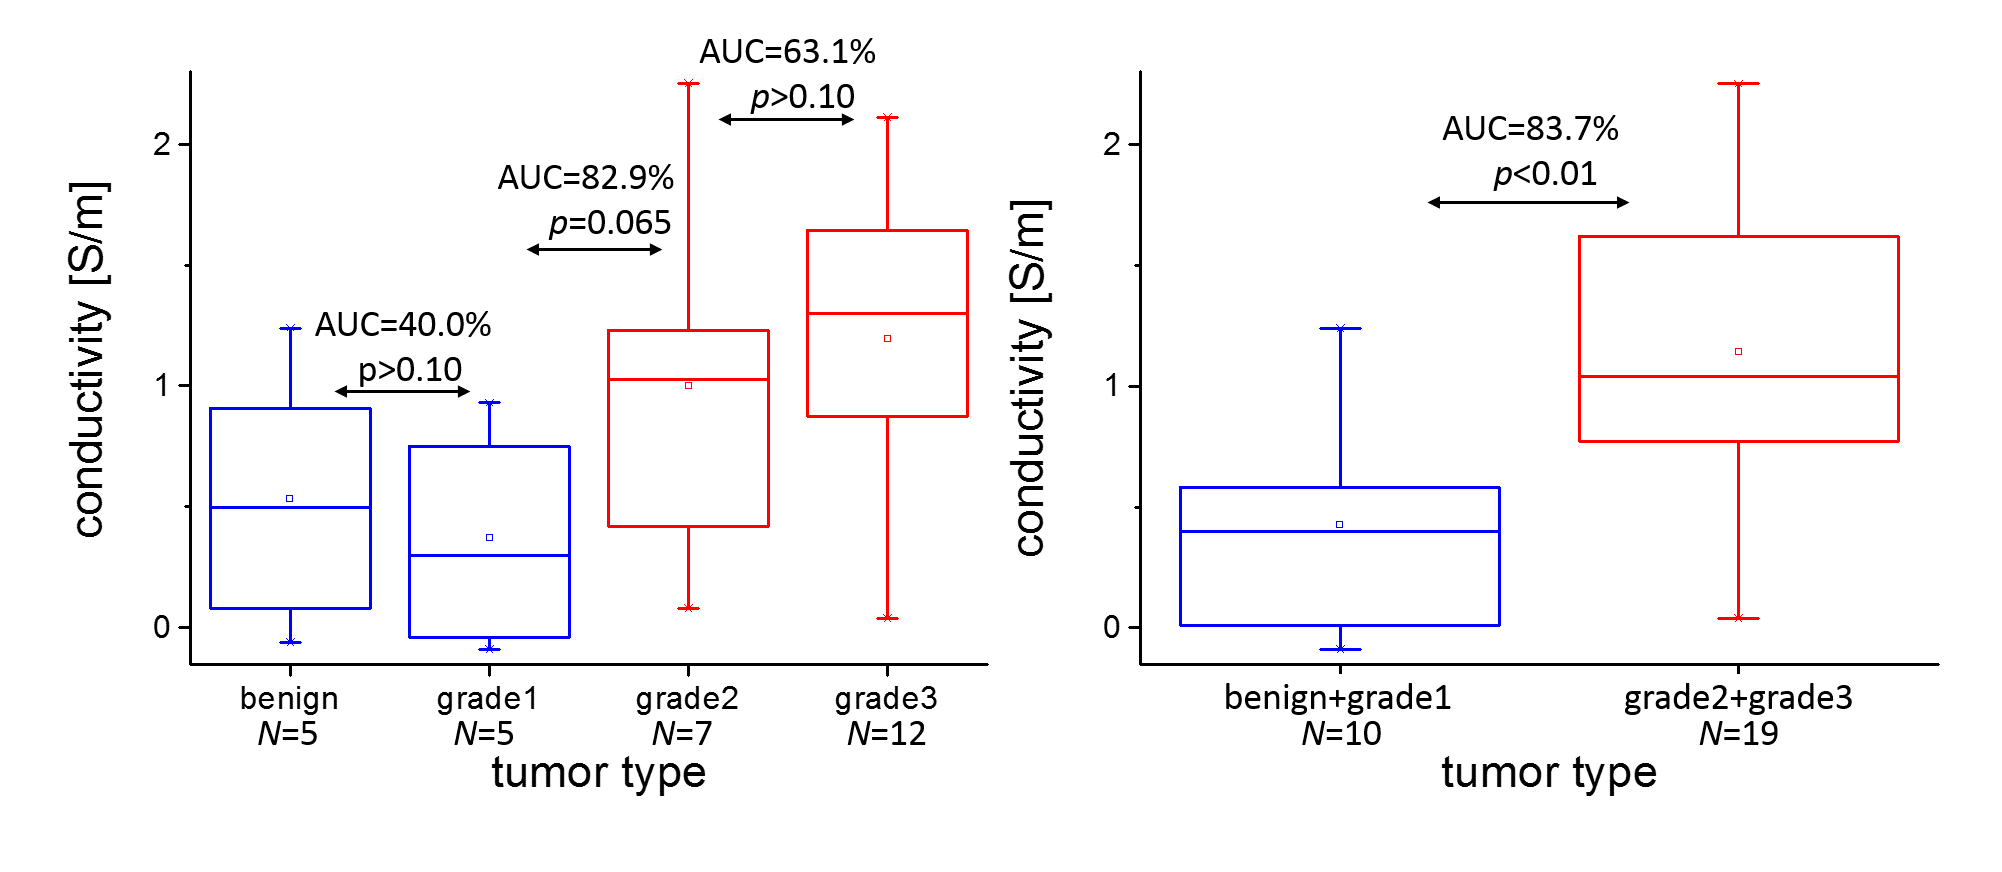
For an exemplary case (IDC grade 2), Fig. 1 shows the TSE magnitude and the subtraction image as well as the corresponding boundaries. The conductivity reconstructed inside the lesion shows a heterogeneous substructure according to these boundaries. Two box-whisker plots (median/upper+lower quartile/upper+lower extreme) are given in Fig. 2. The first plot compares all four different lesion types investigated. Fibroadenoma and IDC of grade 1 show comparable conductivity around or below 0.5 S/m. On the other hand, IDC of grade 2 and 3 show comparable conductivity around or above 1.0 S/m. The second plot compares the correspondingly combined groups of low and high malignancy, yielding an AUC of the ROC of 83.7% (p=0.001 based on Welch's t-test).Discussion / Conclusion
This study reveals a statistically significant difference between tumors of lower and higher malignancy. This difference might arise from different sodium concentration in benign and malignant lesions [6], since sodium concentration was reported as potential major determinant of electric tissue conductivity [7]. A trend towards higher conductivity of IDCs grade 3 in comparison with IDCs grade 2 is visible, but not with statistical significance, at least with the current, limited number of patients.Acknowledgements
No acknowledgement found.References
[1] Surowiec AJ et al., IEEE Trans Biomed Eng 35 (1988) 257
[2] Joines W et al., Med Phys 21 (1994) 547
[3] Katscher U et al., Comput Math Methods Med (2013) 546562
[4] Katscher U et al., ISMRM 21 (2013) 3372
[5] Shin J et al., JMRI 42 (2015) 371
[6] Ouwerkerk R et al., Breast Canc Res Treat 106 (2007) 151
[7] van Lier Al et al., ISMRM 21 (2013) 115
Figures