0661
Quantification of hepatocellular carcinoma tumor heterogeneity with multiparametric MRI1Translational and Molecular Imaging Institute, Icahn School of Medicine at Mount Sinai, New York, NY, United States, 2Department of Radiology, Icahn School of Medicine at Mount Sinai, New York, NY, United States, 3Immunology Institute, Icahn School of Medicine at Mount Sinai, New York, NY, United States, 4Department of Pathology, Icahn School of Medicine at Mount Sinai, New York, NY, United States, 5Oncological Science, Icahn School of Medicine at Mount Sinai, New York, NY, United States, 6Department of Medicine/Division of Liver Diseases, Icahn School of Medicine at Mount Sinai, New York, NY, United States
Synopsis
We assessed tumor heterogeneity in hepatocellular carcinoma using multiparametric MRI (mpMRI) combining DWI, BOLD-MRI, TOLD-MRI and DCE-MRI measurements. Histogram characteristics (central tendency parameters mean and median and heterogeneity parameters standard deviation, kurtosis and skewness) of mpMRI data were quantified in the lesions and correlated between MRI methods and with histopathology and gene expression levels in a subset of patients. We observed that central tendency and heterogeneity parameters were largely complementary in terms of the assessed correlations. The proposed histogram analysis is therefore promising for noninvasive HCC characterization on the functional, immunohistochemical and genomics level.
Purpose
Hepatocellular carcinoma (HCC) lesions are known to exhibit substantial intra- and inter-tumor heterogeneity, which poses a significant challenge for treatment stratification1. The goal of our study was to quantify tumor heterogeneity in HCC using multiparametric MRI (mpMRI), and to correlate quantitative MRI parameters with histopathology and gene expression in a subset of patients.
Methods
Patients
In this prospective IRB-approved study, 32 patients (M/F 26/6, mean age 59y) with HCC underwent mpMRI including DWI, blood-oxygenation-level-dependent (BOLD), tissue-oxygenation-level-dependent (TOLD) and DCE-MRI.
MRI acquisition and analysis
MRI was performed at 1.5T (Siemens Aera; n=19) or 3.0T [Siemens Skyra (n=5) or Siemens BioGraph mMR (n=8)]. DWI was performed using a diffusion-weighted single-shot SE-EPI sequence. For BOLD-MRI and TOLD-MRI, multi-gradient echo R2* and Look-Locker or variable flip angle R1 acquisitions were performed before and at the end of a respiratory oxygen challenge of 10-15 minutes2. DCE-MRI consisted of 100 dynamic 3D FLASH acquisitions during which 0.05 mmol/kg of Gd-BOPTA (Multihance) was administered. The following parameter maps were generated: ADC from DWI; arterial flow (Fa), portal flow (Fp), total flow (Ft), arterial fraction (ART), mean transit time (MTT) and distribution volume (DV) from DCE-MRI; R2* (before and after O2) and ΔR2* from BOLD-MRI and R1 (before and after O2) and ΔR1 from TOLD-MRI.
Histopathology and gene expression analysis
For a subset of patients (n=14) that underwent hepatic resection, advanced histopathology and gene expression analysis of the HCC lesions was performed. For histopathology, one paraffin-embedded section was used for sequential staining3 of CD31 (endothelial cells), CD68 (macrophages) and CD3 (T-cells). A separate slide was used for hypoxia-inducible factor 1-alpha (HIF1α) staining for detection of hypoxia. A threshold-based segmentation method was implemented to determine stained tumor fractions for each of the markers. For gene expression analysis, the following HCC marker genes were profiled: liver-specific Wnt target (GLUL), stemness markers (EPCAM, KRT19), early HCC markers (BIRC5, HSP70, LYVE1, EZH2), pharmacological target FGFR4, potentially targetable angiogenesis marker VEGFA and targetable immune checkpoints (CD274, PDCD1, CTLA4).
Statistical analysis
Histogram characteristics [central tendency (mean, median) and heterogeneity (standard deviation, kurtosis, skewness)] of the mpMRI parameters in HCC and liver parenchyma were compared using Wilcoxon signed-rank tests. Histogram data was correlated between MRI methods in all patients and with histopathology stained tumor fractions and gene expression levels in the subset of 14 patients using Spearman correlation analysis.
Results
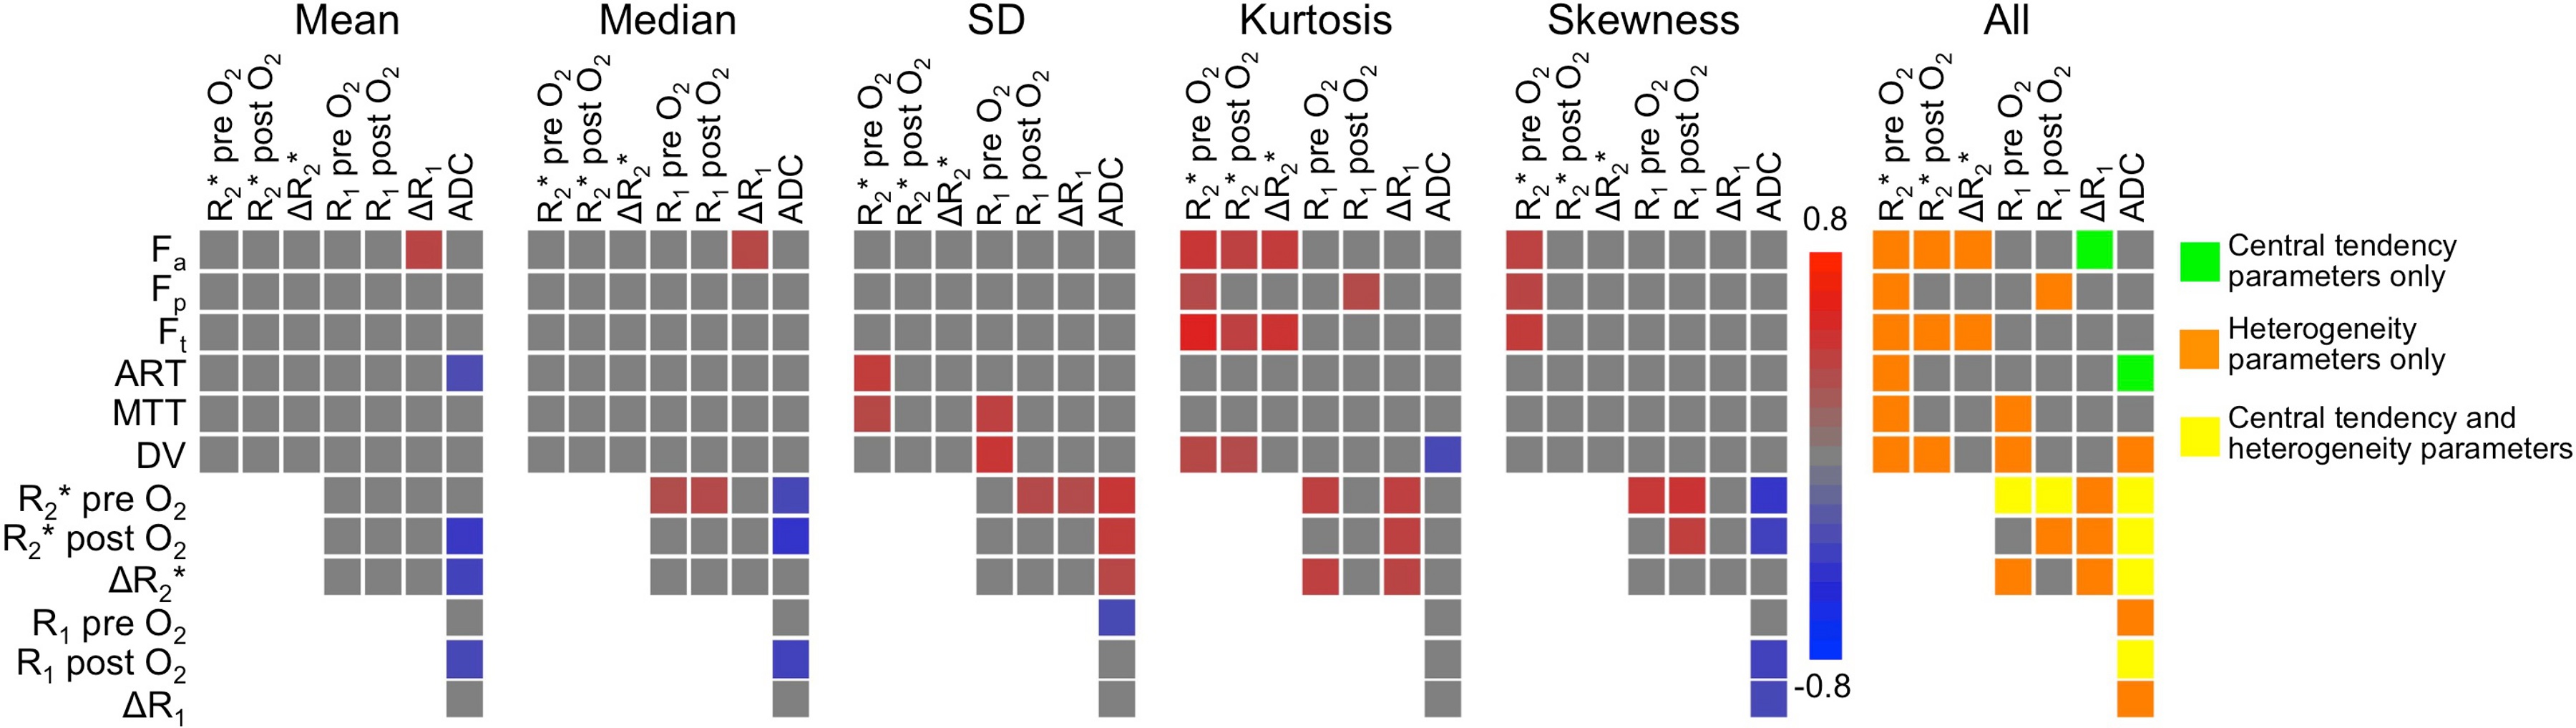
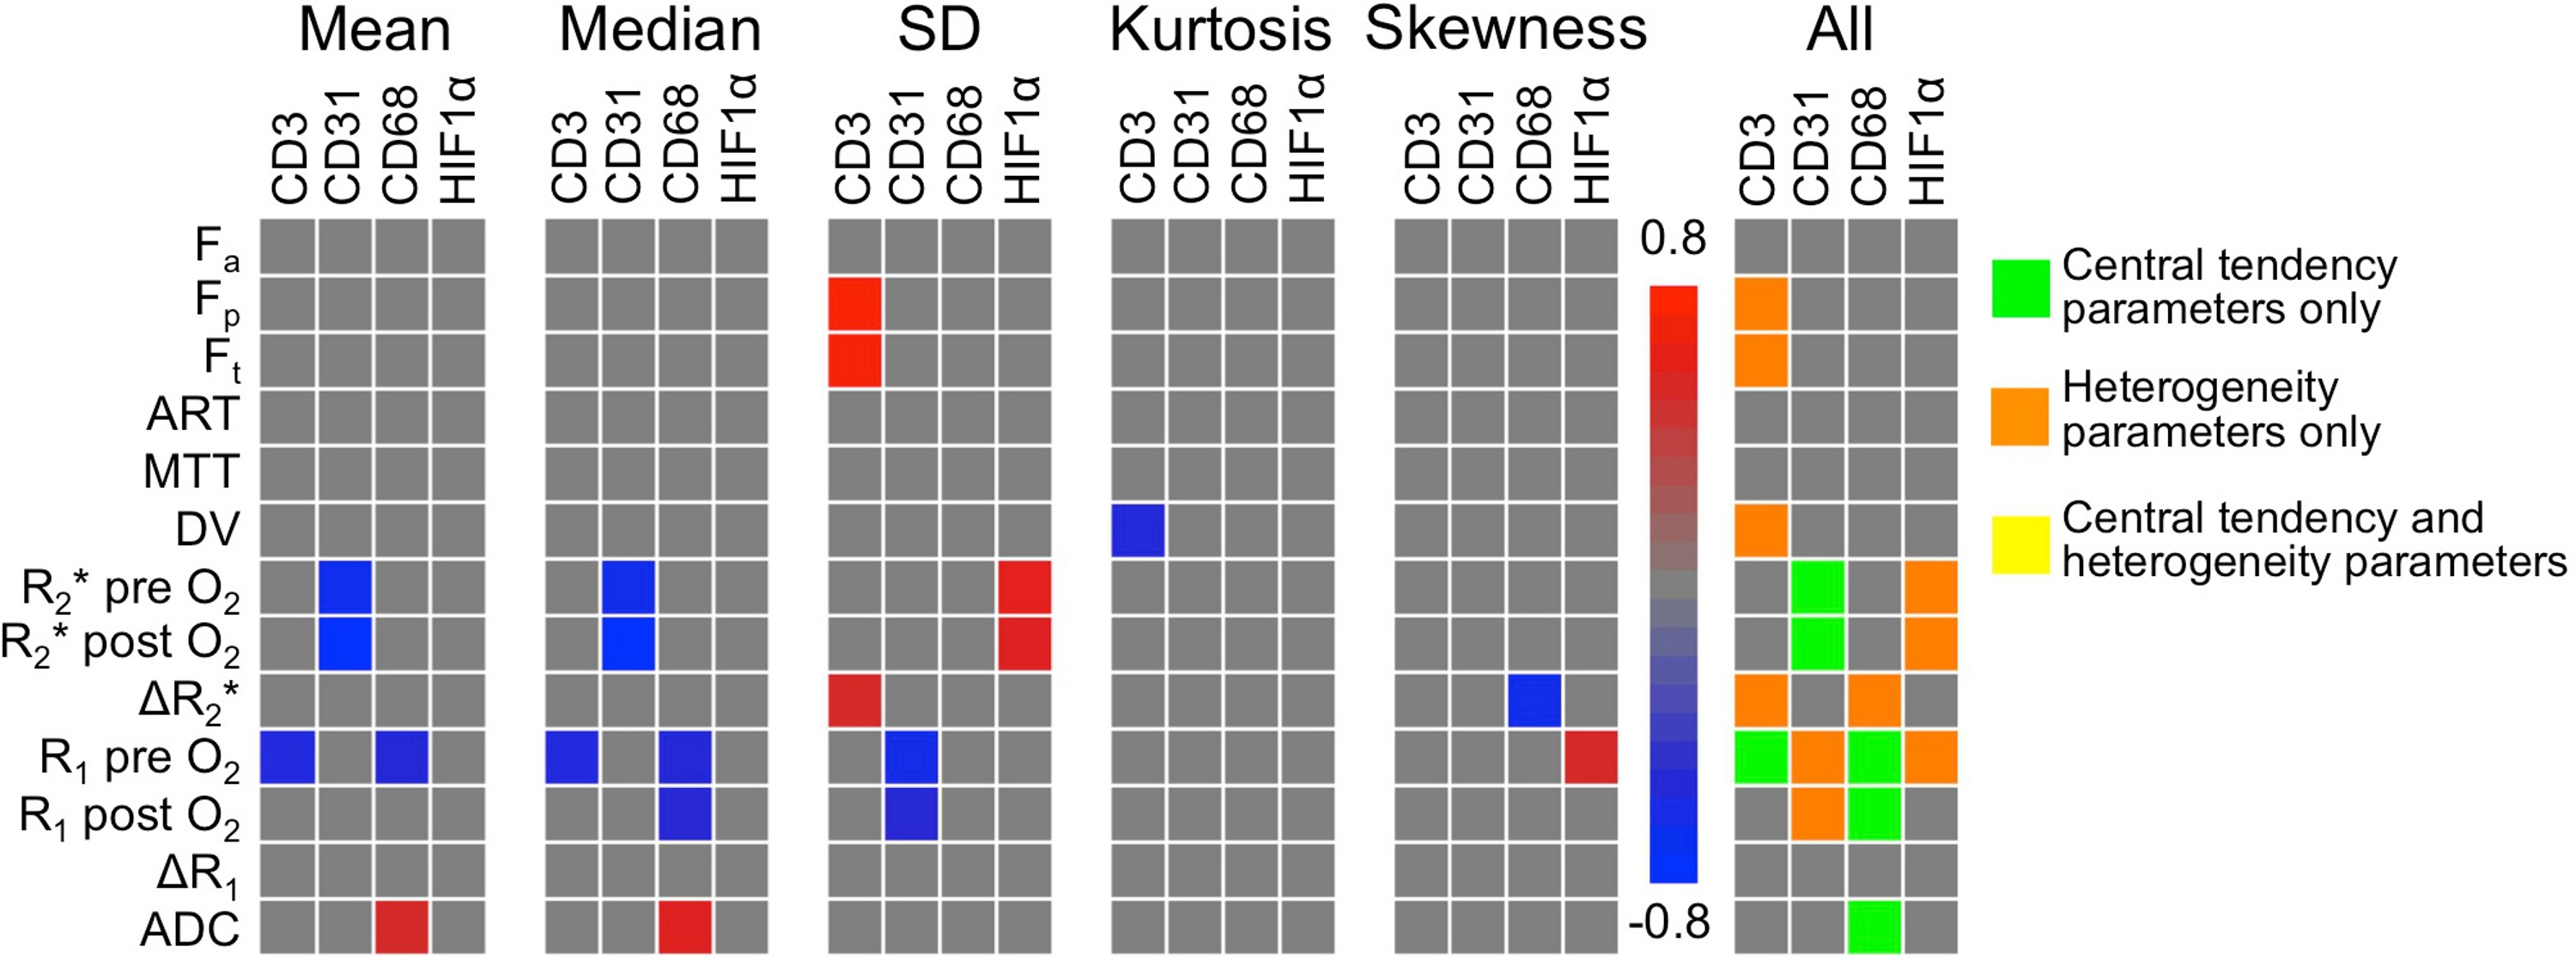
39 HCC lesions were assessed (mean size 4.4±3.3 cm). Representative mpMRI maps and histograms of an HCC lesion exhibiting substantial intra-tumor heterogeneity are shown in Figure 1. HCC lesions exhibited more intra-tissue heterogeneity compared to liver parenchyma: significantly higher SD (Fa, Fp, Ft, MTT, DV and R1 pre O2; P<0.008), kurtosis (Fp and ADC; P<0.030) and skewness (Fp and R2* pre O2; P<0.042) were observed in HCC vs. liver parenchyma. Figure 2 shows heatmaps of significant correlations found between MRI parameters in tumors. For central tendency parameters, significant correlations were found between ADC and parameters from all other sequences (DCE-MRI, BOLD and TOLD), between DCE-MRI and TOLD and between BOLD and TOLD values. However, no significant correlations were found between BOLD and DCE-MRI central tendency parameter values, while these parameters did show significant correlation with respect to their MRI heterogeneity features, indicating that these parameters exhibited similar intratumor heterogeneity, as illustrated in Figure 1. With respect to correlations with histopathology, CD3, CD31 and CD68 tumor fractions correlated moderately to strongly with both central tendency and heterogeneity parameter values, while HIF1α tumor fractions only correlated with heterogeneity features (Figure 3). MRI central tendency and heterogeneity features were also complementary in terms of correlations with gene expression levels, as illustrated in Figure 4. The expression level of CTLA4 only correlated with central tendency parameters, while expression of GLUL, FGFR4, tumor stemness markers KRT19 and EPCAM and immune checkpoint PDCD1 showed significant correlations with MRI heterogeneity parameters only.Discussion
Our findings may have substantial implications for HCC characterization and treatment stratification. Tumors with high intra-tumor heterogeneity generally have a poorer prognosis, which may be secondary to a more aggressive biology or treatment resistance4. The observed correlations between MRI features and the expression of potential therapeutic markers for targeted molecular or immunotherapy of HCC5 suggest that the proposed mpMRI histogram analysis could be used to noninvasively predict treatment outcome at baseline.Conclusion
Our results show that central tendency and heterogeneity features of mpMRI data of HCC tumors are complementary in terms of correlations between sequences, with histopathology and with gene expression levels. The proposed histogram analysis is therefore promising for noninvasive HCC characterization on the functional, immunohistochemical and genomics level.Acknowledgements
We would like to acknowledge the support of NCI grant 1U01CA172320-01.References
1 Anfuso B, El-Khobar KE, Sukowati CH, et al. The multiple origin of cancer stem cells in hepatocellular carcinoma. Clin Res Hepatol Gastroenterol. 2015;39 Suppl 1:S92-7.
2 Bane O, Besa C, Wagner M, et al. Feasibility and reproducibility of BOLD and TOLD measurements in the liver with oxygen and carbogen gas challenge in healthy volunteers and patients with hepatocellular carcinoma. J Magn Reson Imaging. 2016;43(4):866-76.
3 Remark R, Merghoub T, Grabe N, et al. In-depth tissue profiling using multiplexed immunohistochemical consecutive staining on single slide. Science Immunology. 2016;DOI: 10.1126/sciimmunol.aaf6925.
4 Davnall F, Yip CS, Ljungqvist G, et al. Assessment of tumor heterogeneity: an emerging imaging tool for clinical practice? Insights Imaging. 2012;3(6):573-89.
5 Connell LC, Harding JJ, Abou-Alfa GK. Advanced Hepatocellular Cancer: the Current State of Future Research. Curr Treat Options Oncol. 2016;17(8):43.
Figures