0659
Correlation of 7T gagCEST MRI with Electromechanical and Biochemical Properties of Femoral Articular Cartilage1Radiology, University Medical Center Utrecht, Utrecht, Netherlands, 2Orthopaedics, University Medical Center Utrecht, Utrecht, 3Biomomentum Inc., Laval, QC, Canada, 4MIRA Institute for Biomedical Technology and Technical Medicine, University of Twente, Enschede, Netherlands
Synopsis
The purpose of this study was to validate the 7T 3D gagCEST measurements obtained in patients in vivo, using correlation of MRI GAG values with electromechanical mapping of the articular cartilage and biochemical analyses. Five patients were scanned before their total knee replacement, after which the extracted cartilage samples were used for electromechanical mapping and biochemical analyses. GAG content as determined by gagCEST MRI shows to be significantly correlated with biochemically measured GAG dry weight and with electromechanical mapping. This work shows that the electromechanical properties of cartilage are correlated with gagCEST MRI values.
Purpose
Early stage osteoarthritis is characterized by compositional changes in the articular cartilage, mainly disorientation of the collagen content and loss of glycosaminoglycans (GAG). Chemical Exchange Saturation Transfer (CEST)-MRI is a promising technique for evaluation of GAG content in articular cartilage 1–3. The purpose of this study was to validate in vivo 7T 3D gagCEST assessments by establishing its correlation with electromechanical and biochemical properties of the articular cartilage.Methods
This study was approved by the institutional ethics review board and written informed consent was obtained from all participants. Five patients were included in this study (two males and three females, age 56 to 69 years), who underwent a total knee arthroplasty (TKA). The patients were scanned within 24 hours prior to their surgery. The experiments were carried out on a 7.0T whole body scanner (Achieva; Philips Healthcare, Best, Netherlands), using a wrap-around 32-channel receiver knee coil and volume transmit coil (MR Coils BV, Zaltbommel, the Netherlands). The pseudo-steady state gagCEST sequence was optimized for maximum sensitivity to GAG effect through Bloch-McConnell simulations 4. The optimized gagCEST MRI sequence consists of a pre-saturation pulse train of 25 ms sinc-shaped pulses (2 µT, N=20, duty cycle 62.5%), readout (sagittal orientation, TR = 2.75 ms, TE = 1.4 ms, FA = 5, FOV = 140 x 150 x 135, SENSE factor 2, TFE factor of 370, five shots and inter-shot T1 recovery time = 2s, k-space center-weighted acquisition), two dummy scans, scan time 6min 59s. CEST images were acquired with saturation offsets from -3 ppm to 3 ppm (±333 ppm for normalization).
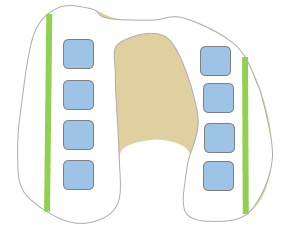
Cartilage samples from the femoral resurfacing cuts were collected for each TKA patient during the surgery. The entire surface of these cartilage samples were mapped ex-vivo using the Arthro-BST (Biomomentum Inc., Laval, QC, Canada), using a quantitative parameter (QP) as a measure for electromechanical properties5. After electromechanical mapping, a DiMethylMethylene Blue assay (DMMB) was used to quantify the actual GAG content in the samples (eight samples per knee joint, as shown in figure 1).
The gagCEST effect size was quantified as the area under the curve from 0.6 ppm to 1.2 ppm by fitting a three pool (water, GAG and magnetization transfer) Lorentzian model to CEST spectra 6. The articular cartilage was segmented in Matlab (Version 2015B, The Mathworks). These segmentations were manually co-registered to the locations of both QP and DMMB measurements.
Results
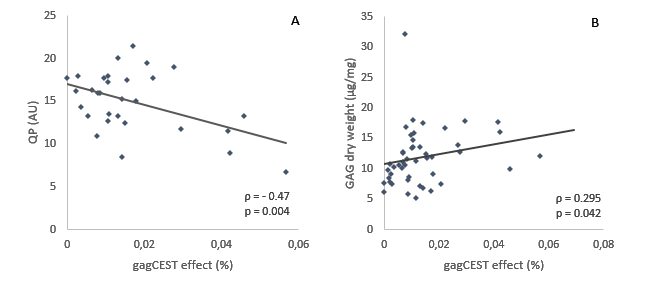
gagCEST effect size was found to be significantly correlated (ρ = 0.295, p < 0.05) with biochemically measured GAG dry weight (figure 2A). As observed in figure 2B, a significant negative correlation was also found between gagCEST effect size and QP (ρ = -0.47, p << 0.05).Discussion
To the best of our knowledge, this study is the first to show the correlation of in vivo gagCEST MRI assessments with biochemical and electromechanical analyses. The results of this work demonstrate that non-invasive gagCEST MRI is a good indicator of cartilage GAG content and its electromechanical properties. The correlation of electromechanical properties of articular cartilage with both biochemical analyses and gagCEST MRI show that electromechanical properties are indeed dependent on GAG content 7. In conclusion, non-invasive GAG measurement by gagCEST-MRI may find its application as a valuable tool for osteoarthritis research, clinical evaluation and outcome measurements in regenerative strategies.Acknowledgements
No acknowledgement found.References
1. Schmitt B, Zbýn S, Stelzeneder D, et al. Cartilage Quality Assessment by Using Glycosaminoglycan Chemical Exchange Saturation Transfer and 23 Na MR Imaging at 7 T 1. Radiology. 2011;260(1):257-264. doi:10.1148/radiol.11101841/-/DC1.
2. Krusche-Mandl I, Schmitt B, Zak L, et al. Long-term results 8 years after autologous osteochondral transplantation: 7 T gagCEST and sodium magnetic resonance imaging with morphological and clinical correlation. Osteoarthr Cartil. 2012;20(5):357-363. doi:10.1016/j.joca.2012.01.020.
3. Kogan F, Hargreaves B a., Gold GE. Volumetric multislice gagCEST imaging of articular cartilage: Optimization and comparison with T1rho. Magn Reson Med. 2016;00:n/a - n/a. doi:10.1002/mrm.26200.
4. Khlebnikov V, Geades N, Klomp DWJ, Hoogduin H, Gowland P, Mougin O. Comparison of pulsed three-dimensional CEST acquisition schemes at 7 tesla: steady state versus pseudosteady state. Magn Reson Med. July 2016. doi:10.1002/mrm.26323.
5. Sim S, Chevrier A, Garon M, et al. Non-destructive electromechanical assessment (Arthro-BST) of human articular cartilage correlates with histological scores and biomechanical properties. Osteoarthr Cartil. 2014;22(11):1926-1935. doi:10.1016/j.joca.2014.08.008.
6. Zaiss M, Schmitt B, Bachert P. Quantitative separation of CEST effect from magnetization transfer and spillover effects by Lorentzian-line-fit analysis of z-spectra. J Magn Reson. 2011;211(2):149-155. doi:10.1016/j.jmr.2011.05.001.
7. Légaré A, Garon M, Guardo R, Savard P, Poole AR, Buschmann MD. Detection and analysis of cartilage degeneration by spatially resolved streaming potentials. J Orthop Res. 2002;20(4):819-826. doi:10.1016/S0736-0266(02)00002-5.
Figures