0658
Correlation Time Mapping of Articular Cartilage: correlation with tissue composition and structure1Medical Research Center, University of Oulu and Oulu University Hospital, Oulu, Finland, 2Research Unit of Medical Imaging, Physics and Technology, University of Oulu, Oulu, Finland, 3Department of Applied Physics, University of Eastern Finland, Kuopio, Finland, 4Diagnostic Imaging Center, Kuopio University Hospital, Kuopio, Finland, 5Department of Diagnostic Radiology, Oulu University Hospital, Oulu, Finland
Synopsis
Correlation time ($$$\tau_c$$$) is a physical property of the tissue that describes the dynamics of water molecules in their microenvironment. In this study, $$$\tau_c$$$ and T2 maps were obtained from enzymatically digested bovine samples. To evaluate the relationship between $$$\tau_c$$$and macromolecular components of cartilage, depth-wise $$$\tau_c$$$ profiles were correlated with quantitative histological measurements. The same comparison was performed for T2 data. Our results suggest that $$$\tau_c$$$ is sensitive to the laminar architecture of cartilage and to the proteoglycan content in the radial zone. $$$\tau_c$$$ provides complementary information to conventional T2 mapping.
Purpose
Correlation time ($$$\tau_c$$$) is a fundamental physical property that describes the dynamics of
water molecules in the musculoskeletal tissues.1
The aim of this study was to statistically evaluate the relationship between $$$\tau_c$$$ and macromolecular components of cartilage that were evaluated with quantitative
histological measurements, such as parallelism index (PI), orientation angle
(OR) and optical density (OD).Methods
Sample Preparation
Bovine osteochondral cylinders (d=25mm, N=6) were prepared from intact patellae, and cut to three sections.2 To induce a collagen and proteoglycan (PG) depletion, one section was digested in 30U/ml collagenase and the other in 0.1U/ml chondroitinase ABC, respectively. The remaining section was used as control. All sections were incubated at +37ºC for 44 hours and subsequently frozen. Finally, a smaller osteochondral cylinder-shaped (d= 7.2mm) sample was drilled from the center of each section for MR imaging.
Quantitative Histology
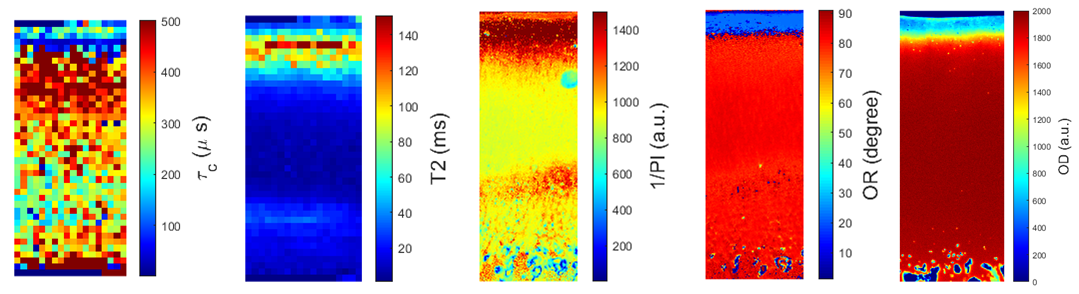
Polarized light microscopy (PLM) measurements were done on 5-$$$\mu m$$$m-thick unstained sections at multiple orientations of the crossed polarizers to determine the PI, a measure of collagen fibril anisotropy in the sample; and OR, the orientation of the collagen fibrils (Fig.1). 1/PI was calculated since the variations in its profile are similar to those in T2 profile. Digital densitometry was carried out to measure OD of the samples by staining 3-$$$\mu m$$$m-thick microscopic sections with Safranin-O, which binds to PGs. Thus the obtained OD is linearly proportional to the cartilage PG content.
MRI Measurements and Statistical Analysis
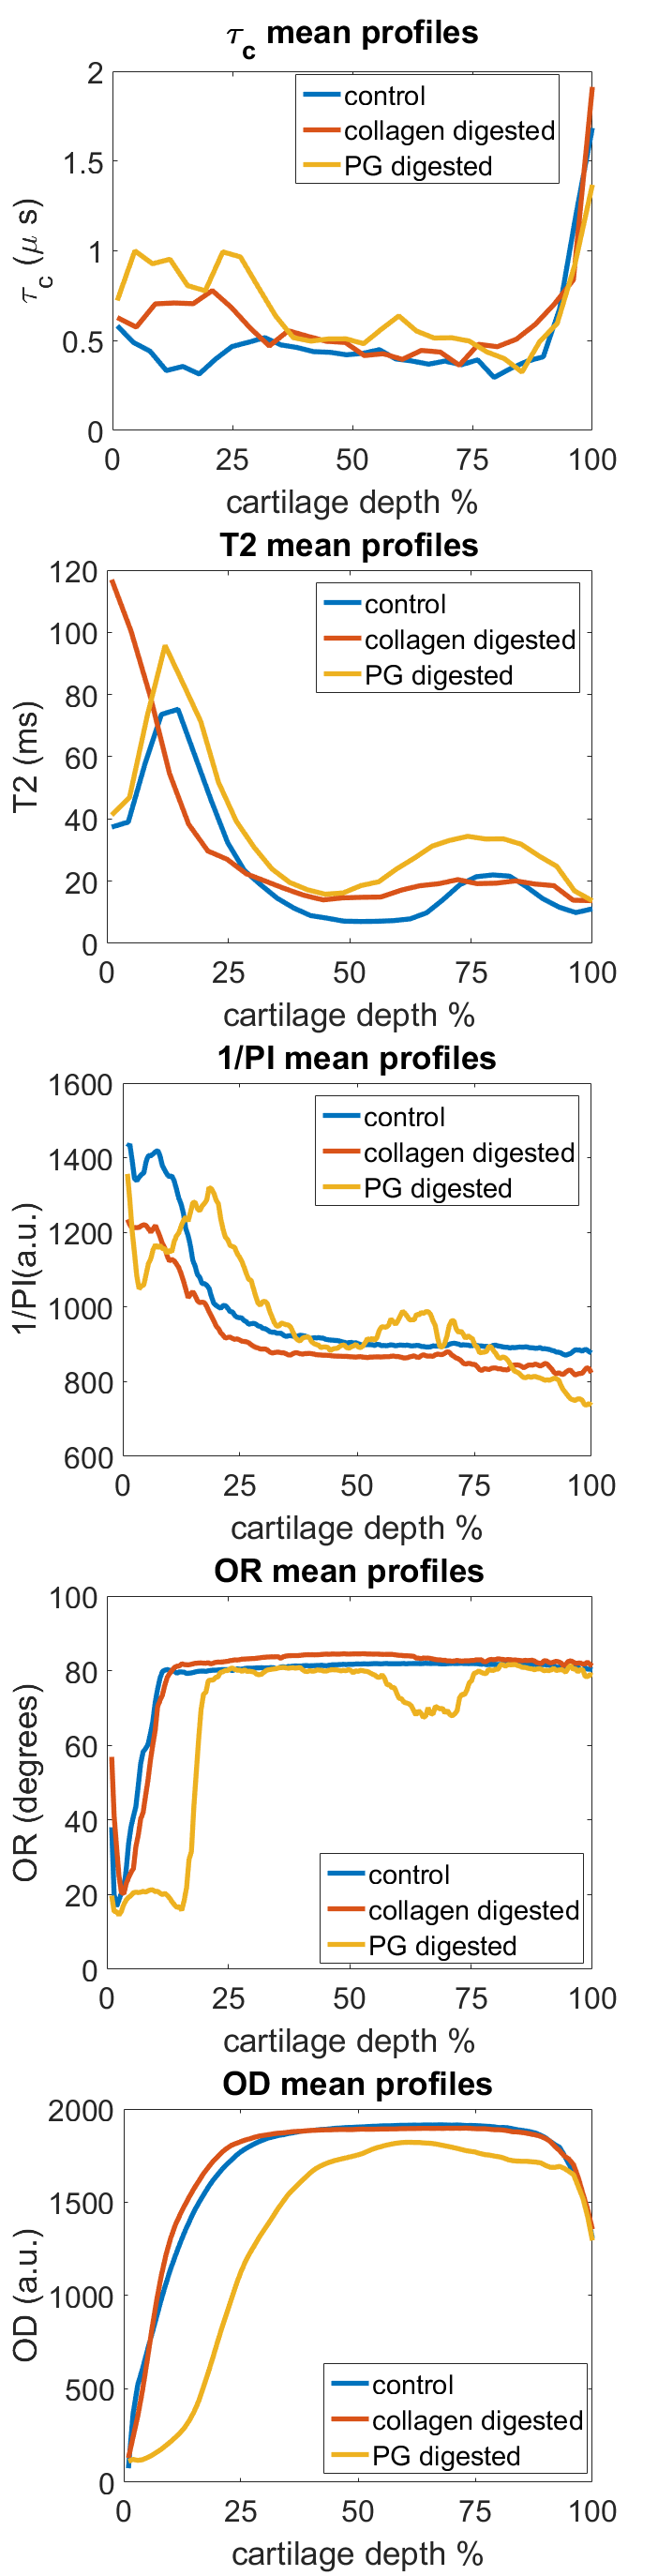
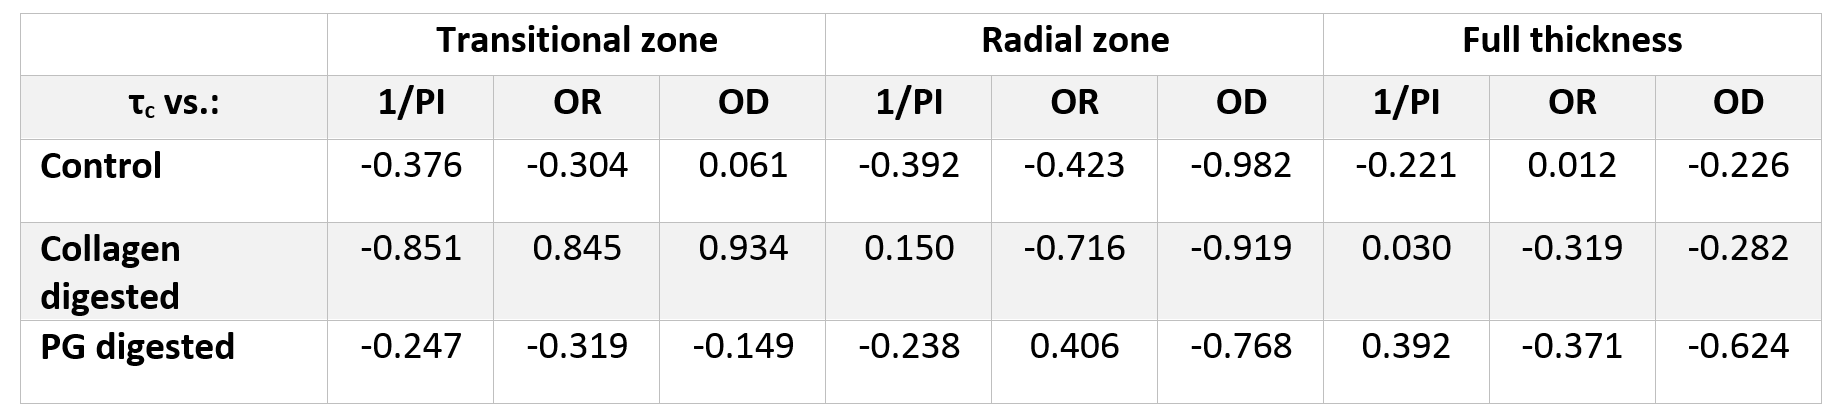
MRI was performed at 9.4 T with a 19-mm quadrature transceiver RF coil and a Varian DirectDrive console. Continuous wave T1rho dispersion measurements with four different spin-lock (SL) fields (125, 250, 500 and 1000 Hz) and a fast spin echo readout (TR/TE= 5000/5ms, 256$$$\times $$$128 matrix size, slice thickness 1 mm, FOV of 16$$$\times $$$16$$$mm^2$$$, depth-wise resolution= 62.5$$$\mu m$$$) were recorded. For T2 map calculation, a series of spin echo images (TEs= 4, 8, 16, 32, 64, 128ms) was acquired.2 $$$\tau_c$$$ maps were calculated by fitting T1rho relaxation dispersion measurements of bovine cartilage specimens to following function3 $$\frac{1}{T_{1\rho}} = \frac{3A \tau_c}{1+4\omega_{SL}^{2}\tau_c^{2}}+B$$ In all $$$\tau_c$$$ and T2 maps (Fig.1), 1-mm wide regions of interest (ROI) from the center of the cartilage sample were used for analysis. The ROIs were averaged to depth-wise profiles (Fig.2) which were divided into four sections: superficial, transitional, radial and full-thickness (5%, 20%, 75% and 100% of the cartilage thickness, respectively). The mean $$$\tau_c$$$ and T2 profiles were calculated by taking the average of the individual profiles after down-sampling all profiles to the shortest profile. The histological profiles were down-sampled to match the size of the corresponding $$$\tau_c$$$ and T2 profiles (Fig.2). The association between $$$\tau_c$$$, T2 and quantitative histological parameters was evaluated using Pearson’s correlation analysis of individual sample profiles and the mean profiles of all samples per group (Table 1, 2). Due to the small number of profile points in the superficial zone, the statistical analysis was carried out only for transitional, radial and full-thickness cartilage. Correlation coefficients (r) were defined as strong (|r|≥0.7), moderate (0.5≤|r|<0.7), weak (0.2≤|r|<0.5) and no correlation (|r|<0.2).
Results
Interestingly, $$$\tau_c$$$ increases
when approaching cartilage-bone interface (Fig.2).
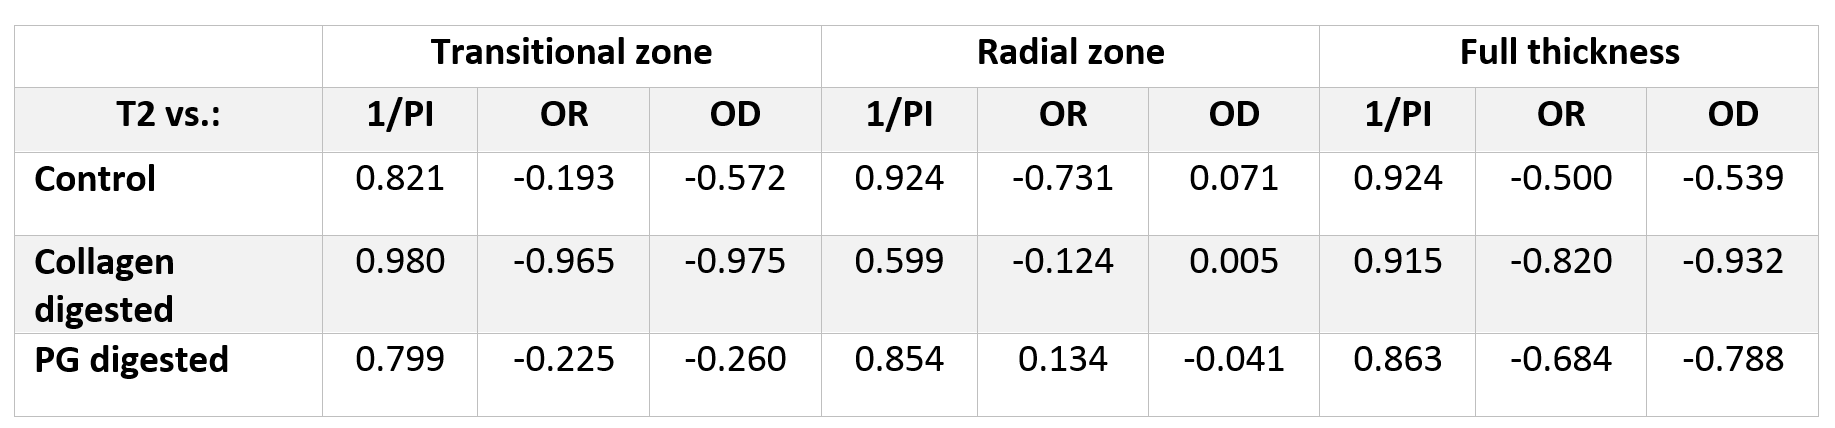
While strong positive correlation was found between T2
and 1/PI in different zones and in different cartilage groups, the correlation between
$$$\tau_c$$$
and 1/PI ranged from strong negative to weak positive (Table 1, 2). The correlation between $$$\tau_c$$$ and OR in the full-thickness cartilage ranged from no correlation to
weak negative, while the correlation between T2 and OR was moderate negative or
strong negative. Although strong negative correlation was observed between $$$\tau_c$$$ and OD in the radial zone of all cartilage groups, no correlation
was found between T2 and OD in the same zone (Table 1, 2).Discussion
Observed increase of $$$\tau_c$$$ values close to cartilage-bone interface suggests very restricted motion of water molecules due to the increase in macromolecular content. Similarly to T2 maps, $$$\tau_c$$$ maps also reveal the laminar structure of the cartilage. Presented correlations between T2 and histological evaluations are in agreement with results reported in previous studies.4,5 Our results suggest that $$$\tau_c$$$ is sensitive to the changes in PG and collagen content, and to the collagen orientation in the cartilage. The largest differences were found when comparing $$$\tau_c$$$ and T2 data to PI values.Conclusion
Presented results suggest that $$$\tau_c$$$ is sensitive to the changes in PG and collagen content, and to the collagen orientation in cartilage. Moreover, $$$\tau_c$$$ seems to provide complementary information when compared to T2 mapping. Therefore $$$\tau_c$$$ may be viewed as a novel MRI contrast that is related to the tissue structure and composition.Acknowledgements
Jane and Aatos Erkko foundation is acknowledged for financial support.
Support from the Academy of Finland (grants #285909, #293970 and #297033) is gratefully acknowledged
References
1. Hanni M, et al. Determination of correlation time in articular cartilage by T1rho relaxation dispersion. Proc. Intl. Soc. Mag. Reson. Med. 2015; 23:0117.
2. Nissi MJ, et al. Multi-parametric MRI characterization of enzymatically degraded articular cartilage. Journal of Orthopaedic Research. 2016.
3. Blicharska B, et al. Hydration water dynamics in biopolymers from NMR relaxation in the rotating frame. Journal of Magnetic Resonance. 2010;207(2):287-293.
4. Xia, Y., et al. Quantitative in situ correlation between microscopic MRI and polarized light microscopy studies of articular cartilage. Osteoarthritis Cartilage 9, 393-406 (2001).
5. Nieminen MT, et al. T2 relaxation reveals spatial collagen architecture in articular cartilage: A comparative quantitative MRI and polarized light microscopic study. Magnetic resonance in medicine. 2001;46(3):487-493.
Figures