0657
Pile up correction for 3D-Multi Spectral Imaging using Gaussian Spectral Modeling and Bin Expansion1MR Applications and Workflow, GE Healthcare, Waukesha, WI, United States, 2Radiology, Medical College of Wisconsin, Milwaukee, WI, United States
Synopsis
The difficulty of imaging around metal implants has been overcome using pulse sequences such as MAVRIC SL and SEMAC. While the images are largely artifact-free, subtle intensity fluctuations, or ‘pile up’ artifacts still remain. The post-processing approach presented here uses information extracted from a spectral-domain model to identify and correct local fluctuations in image intensity. In these regions, the spectral bins are expanded using a moving average filter. When the expanded bins are combined, the pile up is significantly reduced. This pile up correction can improve the aesthetic quality of the images, and significantly improve their diagnostic ability.
Introduction
The high susceptibility of metal implants has rendered conventional Magnetic Resonance imaging pulse sequences inadequate for imaging around orthopedic implants. This difficulty has been overcome using three dimensional multi-spectral imaging sequences (3D-MSI) such as MAVRIC SL1 and SEMAC2. These sequences overcome the broadened frequency distribution around the metal implants by combining several sub images – or spectral bins – acquired at distinct frequency offsets from the Larmor frequency. While this imaging approach produces diagnostically relevant images around metal implants by correcting a large portion of any artifacts, one subtle artifact still remains. In MAVRIC SL images, these ‘pile up’ artifacts are subtle fluctuations in the signal intensity in close proximity to the implants surface which arise due to local induction gradients in that exceed the frequency encoding gradient strength3. In fact, the spectral bin intensities show a subtle spatial discontinuity in relation to the neighboring bin. These discontinuities manifest themselves as ripple like artifacts in the combined images. The post processing approach presented here takes advantage of the information extracted from a spectral domain model to accurately identify and correct local fluctuations in image intensity. In these regions, the spectral bins are expanded using a moving average filter to minimize the discontinuity between the outer boundaries of the different bins. When the expanded bins are combined, the pile up is significantly reduced. This pile up correction can not only improve the aesthetic quality of the 3D-MS images, but significantly improve their diagnostic ability. More importantly, this correction may also afford an increase in the spectral bin separation that will significantly accelerate 3D-MSI acquisitions.Methods
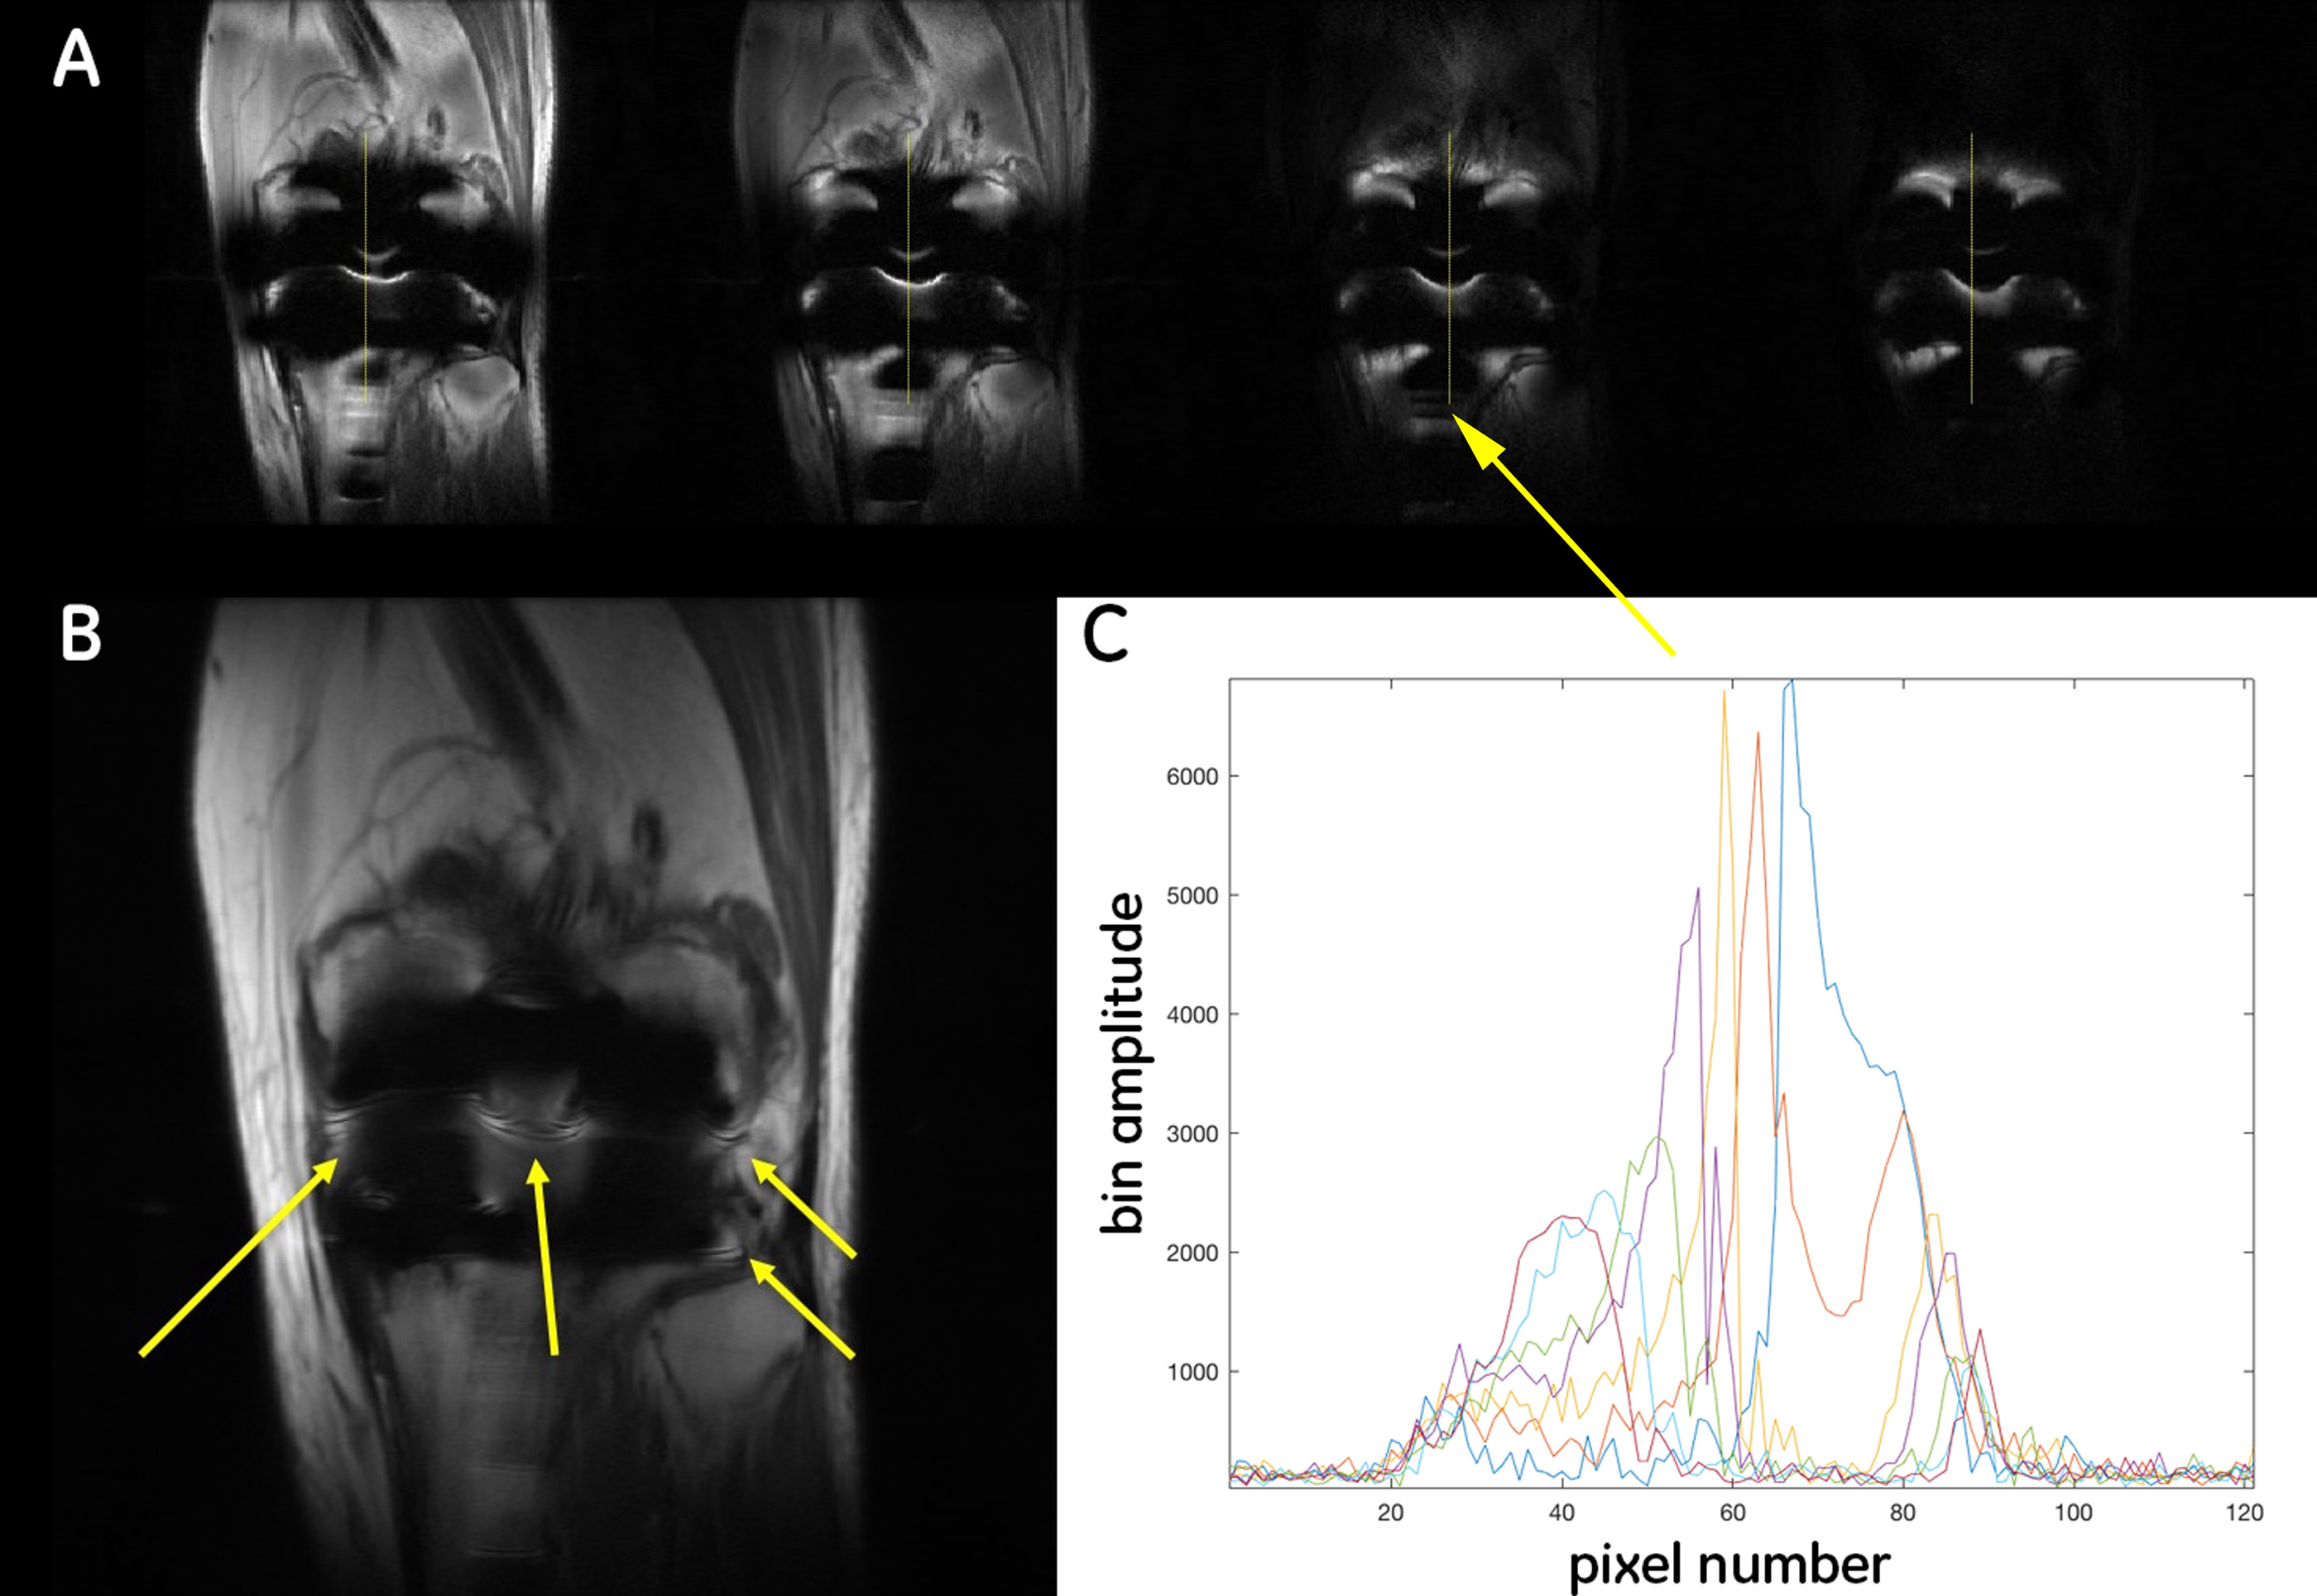
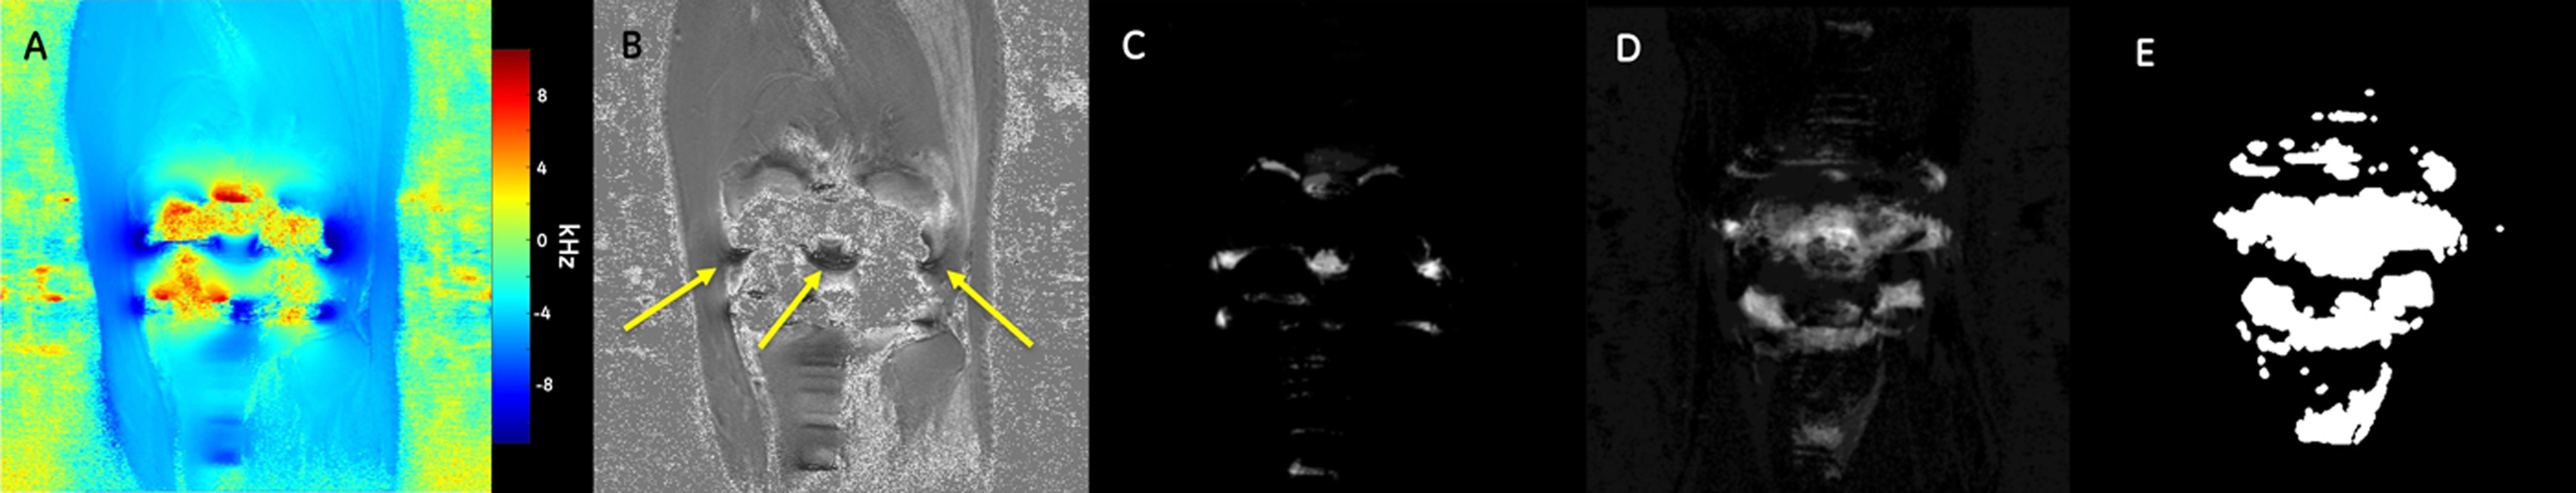
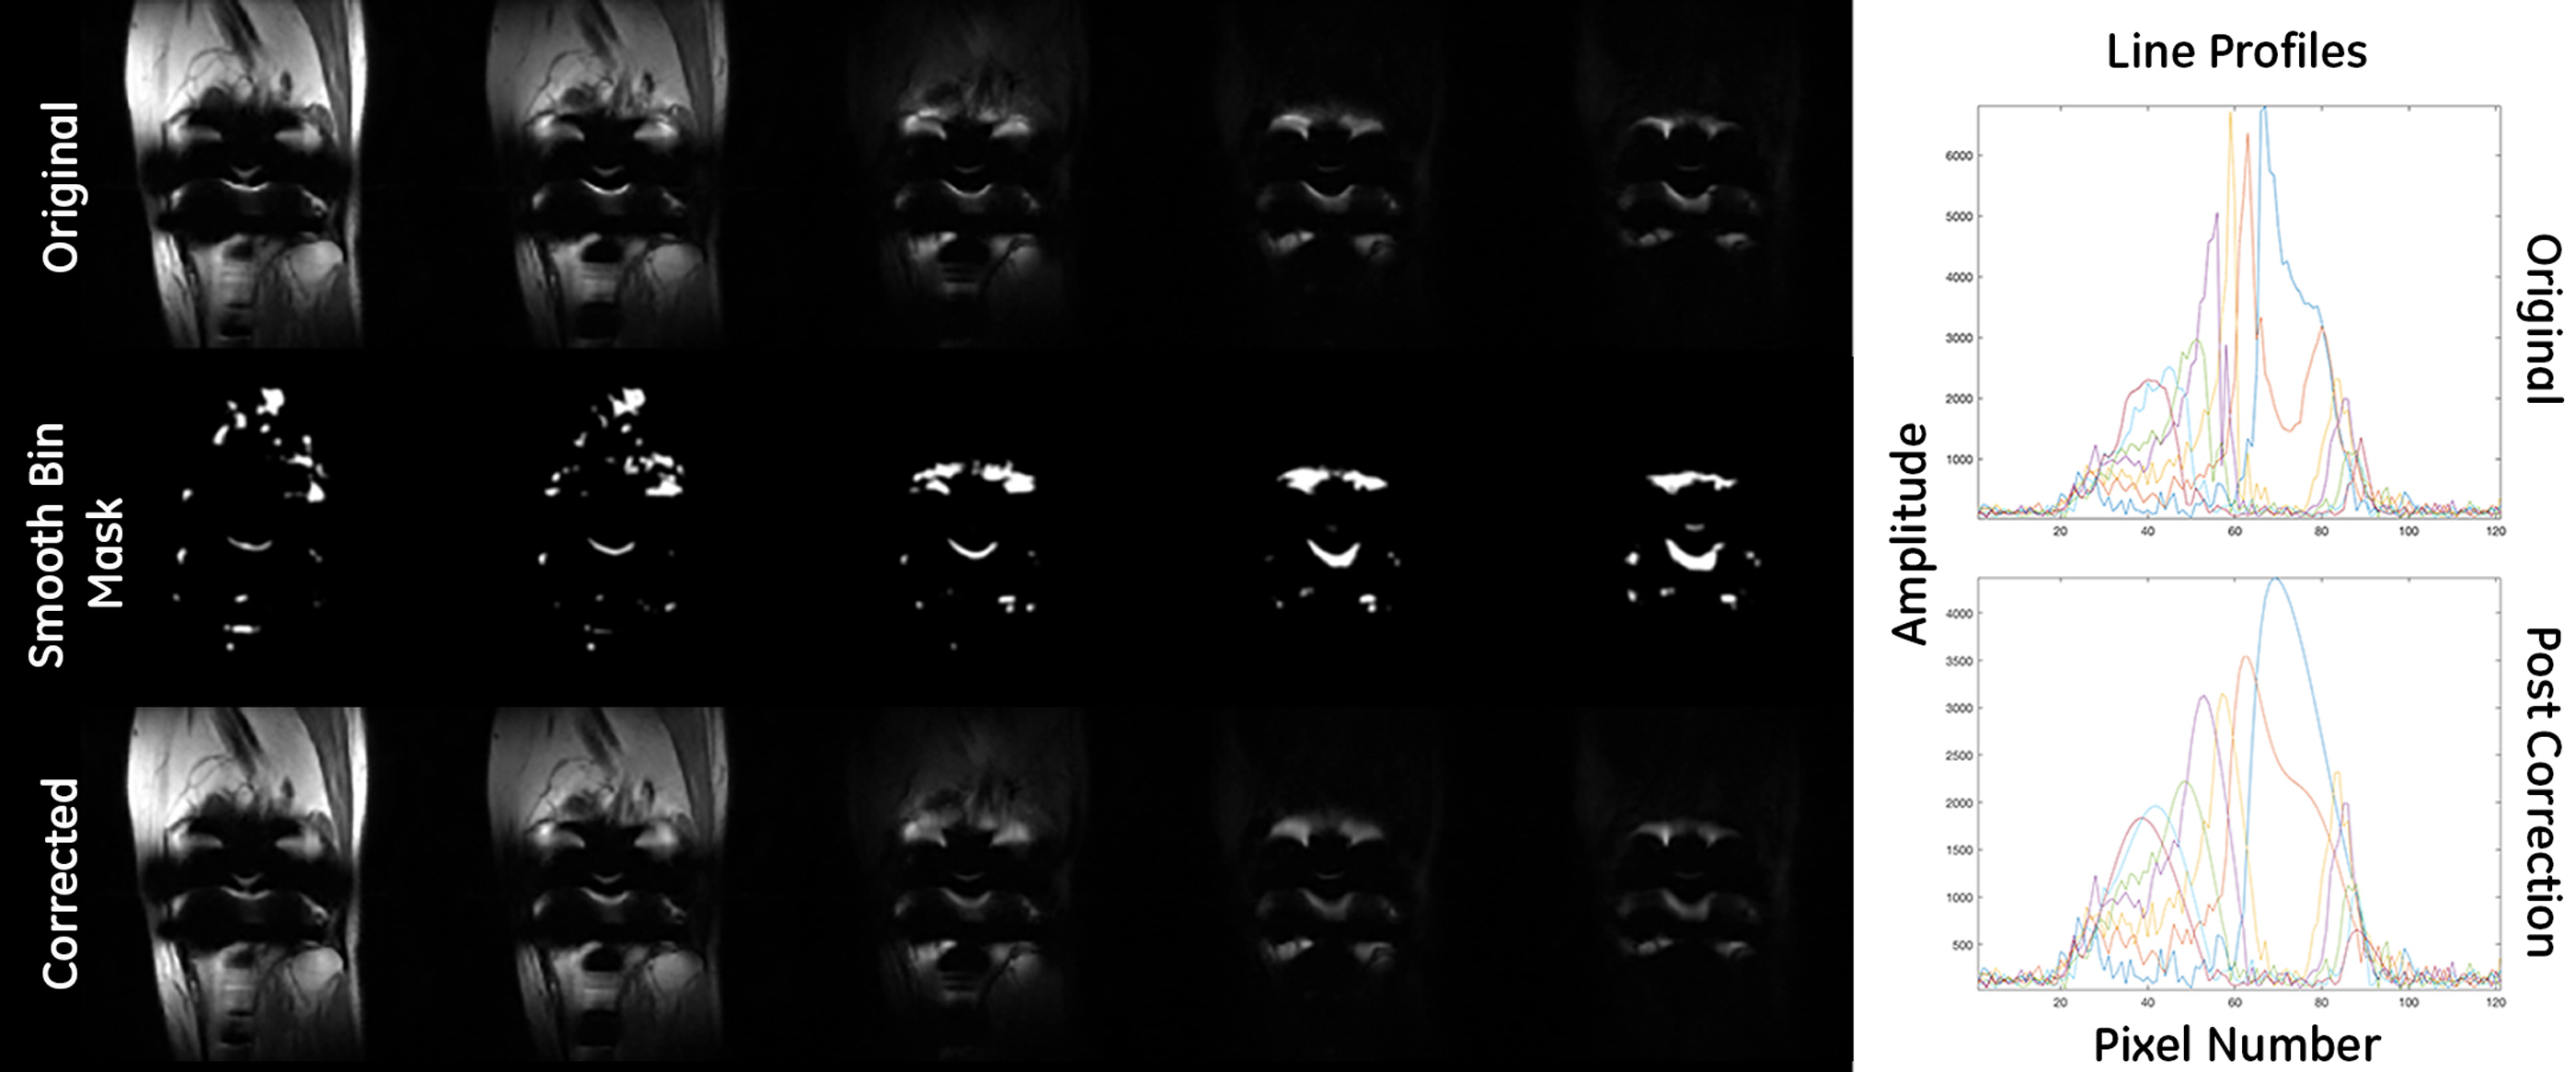
The 3D-MSI spectral domain was modeled as a Gaussian and fit to extract the amplitude, frequency, and standard deviation (SD) at every voxel. In this SD map, regions that have high local induction gradients (pile up), undergo ‘bin compression’3 resulting in low standard deviation values. These areas can be easily segmented to create a SD mask. To improve its robustness, this SD mask was summed in the slice domain to yield a collapsed SD Pile Up image, which was thresholded to yield a 2D SD Mask. This 2D SD mask helped constrain regions in the MAVRIC SL spectral bins where there should be pile up, and improve segmentation of the spectral bins. First, the high intensities that arise due to J-coupling in the fat (4) are isolated and intensity corrected such that non-fat regions and those that comprise fat, have the same mean intensity in every bin. For each slice-bin combination, each 2D image was multiplied by the 2D SD mask, and intensities greater than an empirical 88th percentile were thresholded to signify signals that will lead to pile up in the sum of squares images – bin mask. This bin mask was then smoothed in plane using a 2D Gaussian filter. Regions indicated by this smooth bin mask are subjected to a 5-pixel moving average filter in the frequency encoding direction. The corrected bins are then combined in a sum of squares fashion to yield the corrected MAVRIC SL images.Results
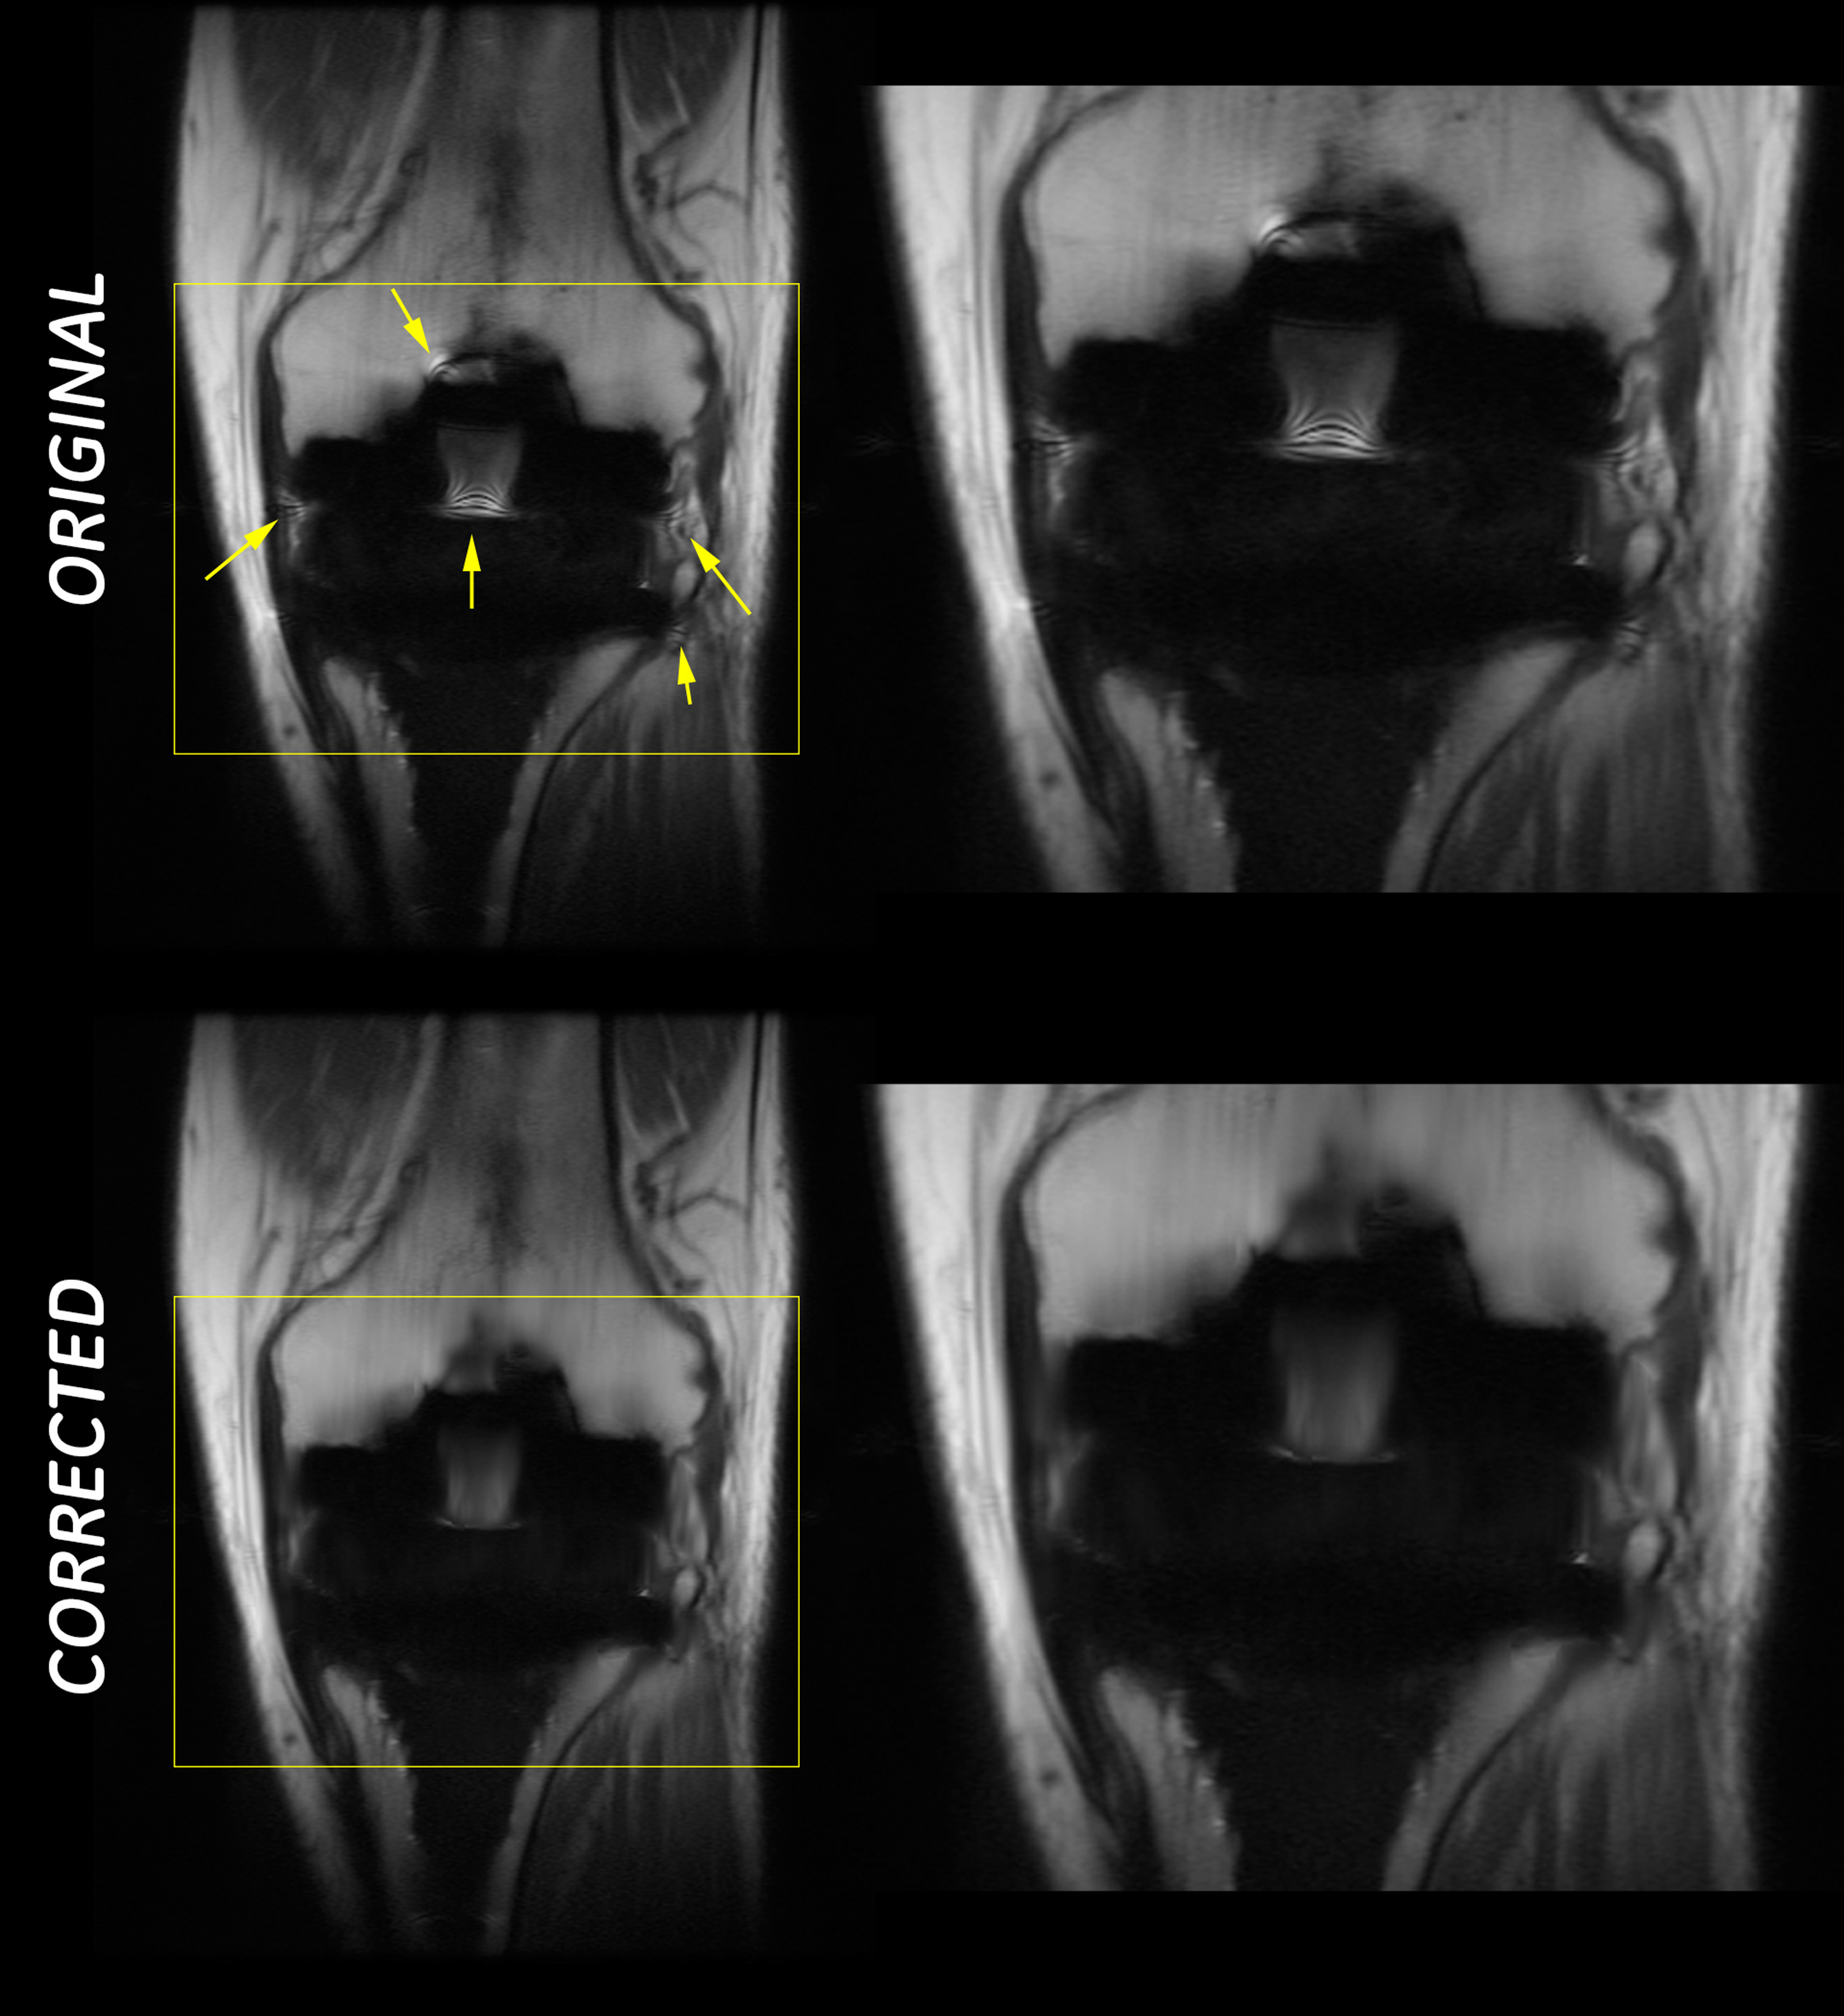
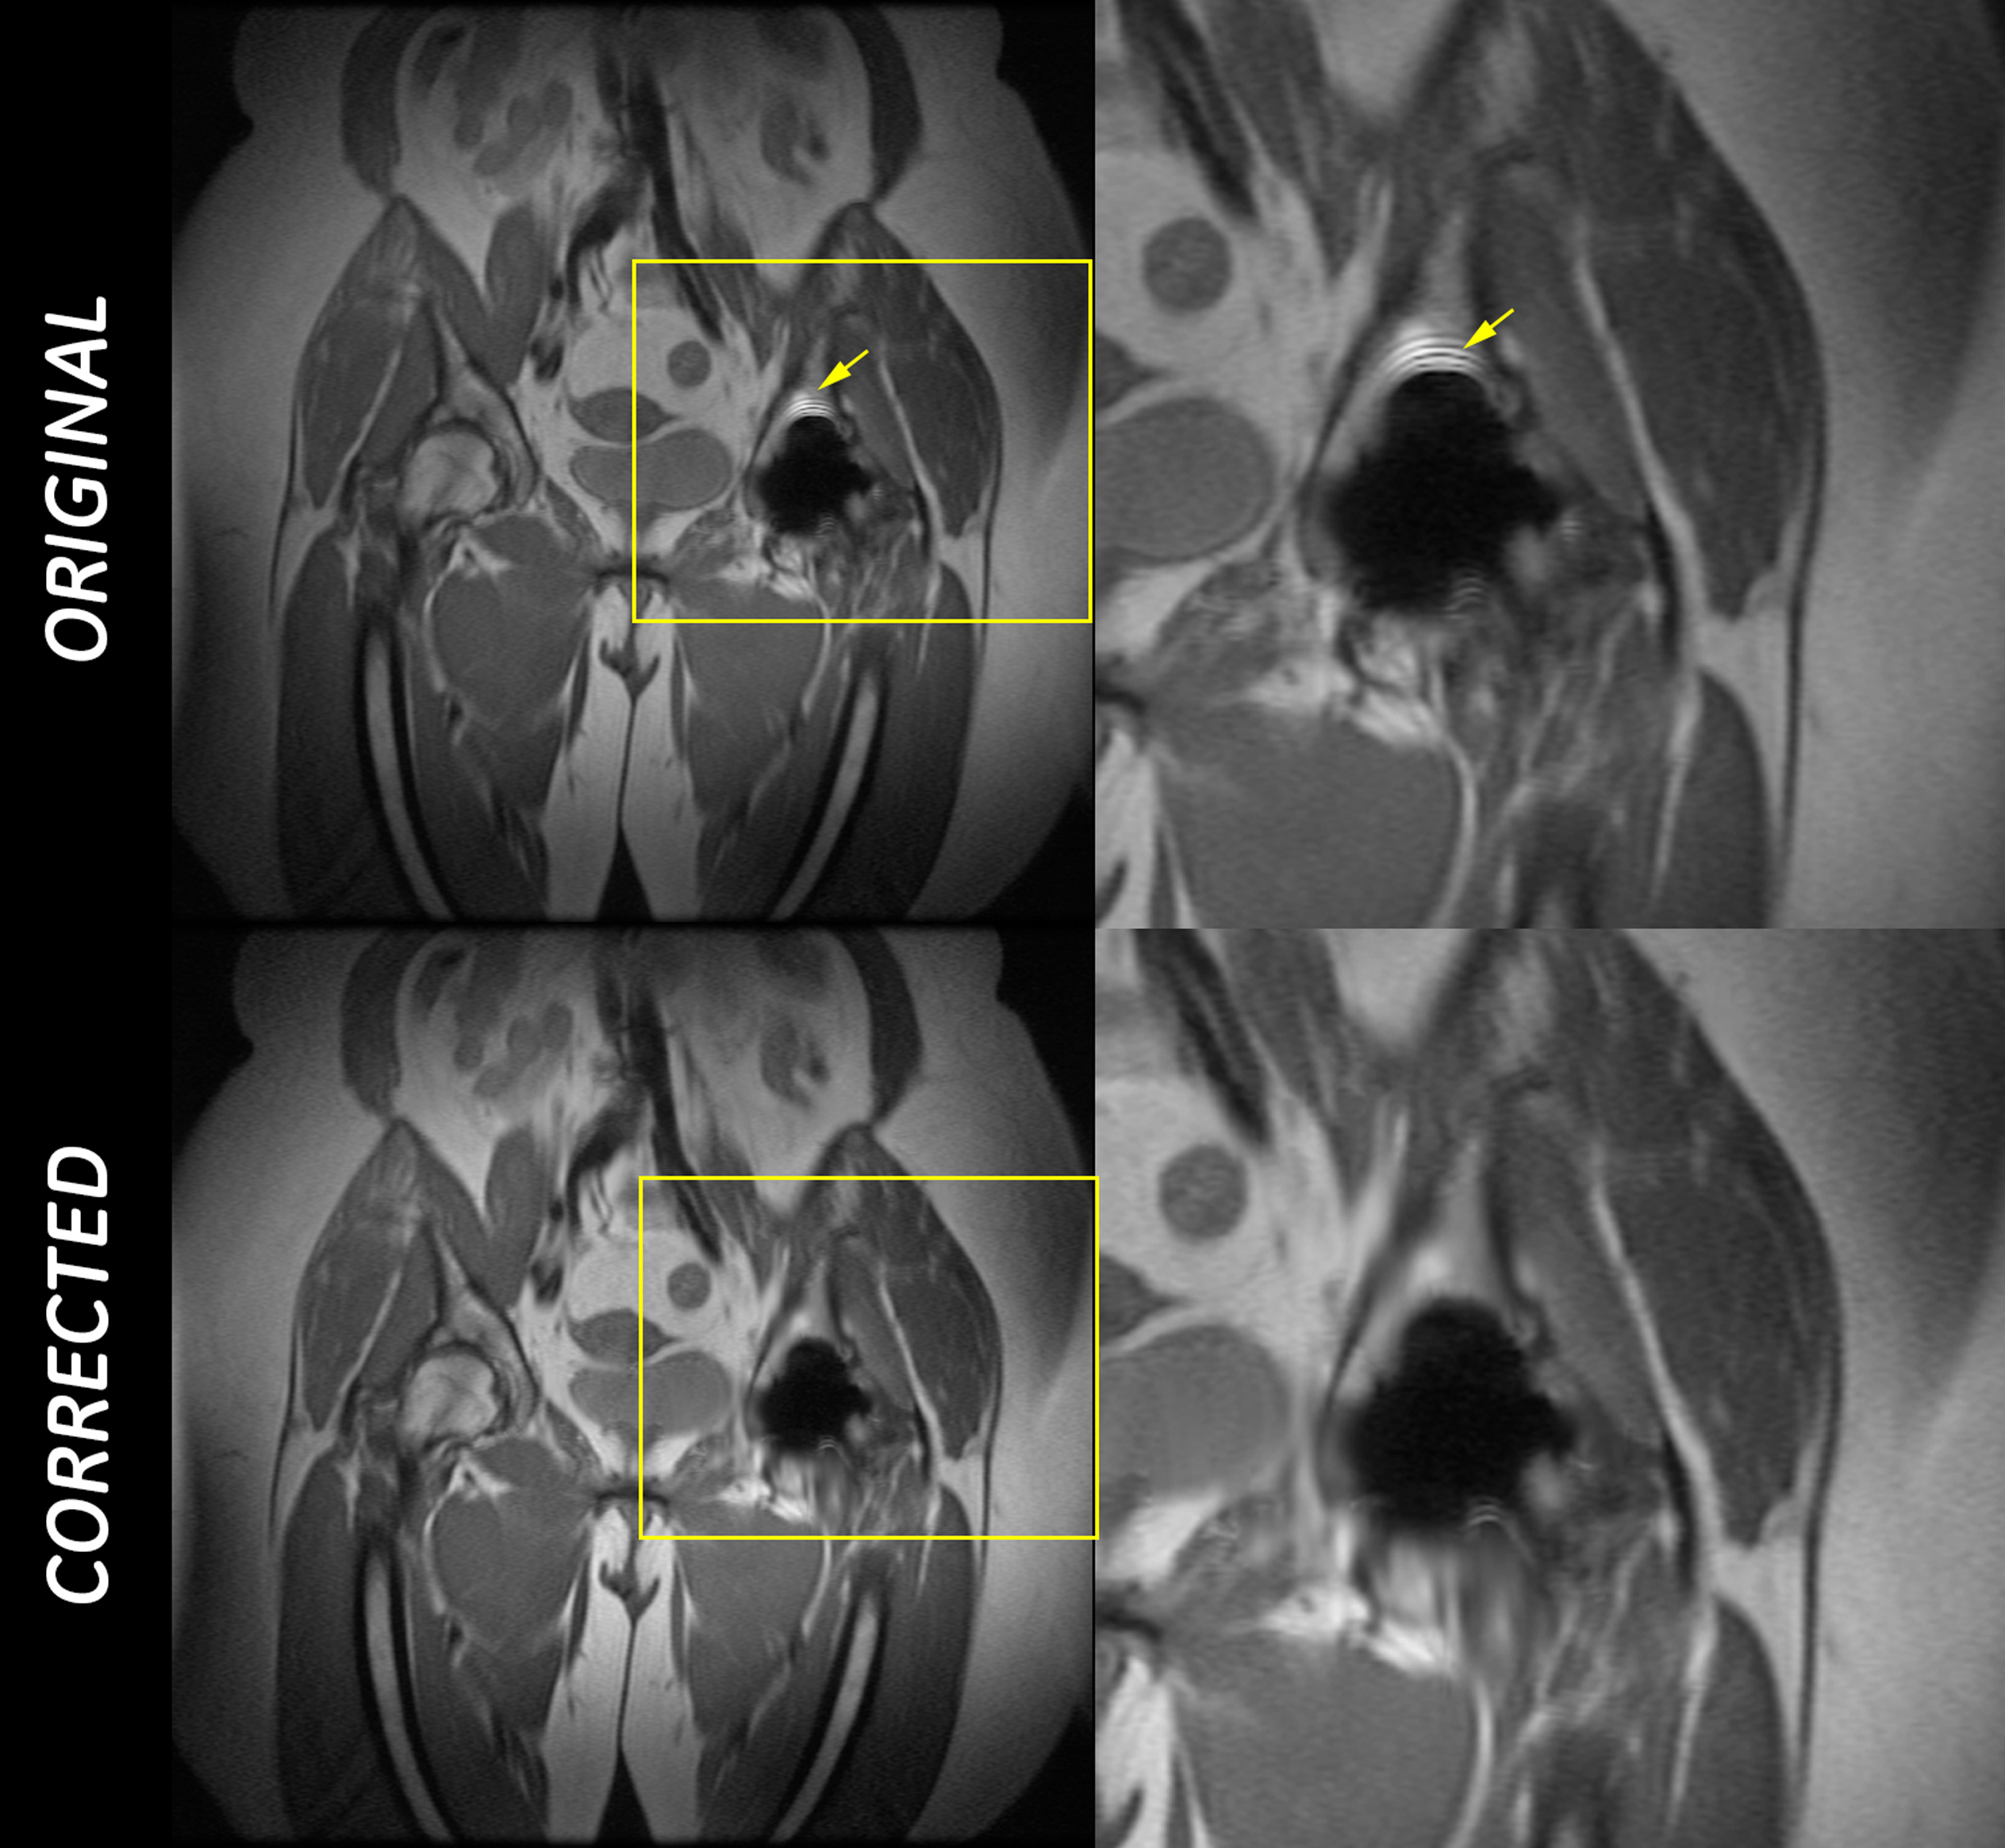
Figure 1 shows an example of the pile up artifact in a subject with a total knee arthroplasty, and the line profiles show the bin-discontinuity which lead to pile up. The results of the spectral model are shown in figure 2A and B. Figure 2C shows the SD mask, which was summed up to yield the final 2D SD Mask (2D – E). The final bin mask, and the bins post-correction are shown in Figure 3. The line profiles after the pile up correction show reduced discontinuity between the neighboring bins. Figure 4 and 5 compares the sum of squares images, pre and post correction. The regions of pile up are indicated by yellow arrows, and the corrected images show no such pile up. Furthermore, the correction has no impact on clinically relevant information in the surrounding regions.Discussion and Conclusions
The algorithm serves to correct regions of pile up in the MAVRIC SL images. Beyond just the aesthetic appeal, this approach could aid in accelerating the MAVRIC SL acquisition. Increasing the bin separation would require fewer bins to sample the same spectral range, but will introduce pile-up like artifacts in the images. This algorithm could afford a greater bin separation while maintaining no change in the image quality. Furthermore, the increased bin separation could minimize minimize the amount of blurring seen in the final MAVRIC SL images.Acknowledgements
No acknowledgement found.References
1. Koch et al., ‘Imaging with a MAVRIC-SEMAC Hybrid’, Magnetic Resonance in Medicine 65:71–82, 2011.
2. Lu et al., ‘SEMAC: Slice Encoding for Metal Artifact Correction in MRI’, Magnetic Resonance in Medicine 62:66–76, 2009.
3. Koch et al., ‘Imaging near Metal: The Impact of Extreme Static Local Field Gradients on Frequency Encoding Processes’, Magnetic Resonance in Medicine 71:2924–2034, 2014.
4. Henkelman et al., ‘Why Fat is Bright in RARE and Fast Spin Echo Imaging’, Journal of Magnetic Resonance Imaging 2:533–540, 1992.
Figures