0654
1-year Follow-Up of T1ρ for Assessing Radiocarpal Cartilage Matrix Changes after Anti-TNF treatment for Rheumatoid Arthritis: Preliminary Results1Department of Radiology and Biomedical Imaging, UCSF, San Francisco, CA, United States, 2Department of Medicine, UCSF, San Francisco, CA, United States
Synopsis
MR T1ρ is used to investigate biochemical changes in cartilage composition, but few studies have looked at its application in radiocarpal wrist cartilage. In this study, we assess 1-year changes in T1ρ following rheumatoid arthritis treatment and its relationship with changes in clinical disease activity scores and patient-reported outcomes. Changes between 1-year and baseline T1ρ values correlated significantly with disease activity score changes and approached significance with patient-reported outcome changes during the same period. Changes in T1ρ values at 3-months also correlated significantly with 1-year changes in metacarpophalangeal and wrist bone erosion volume measured with high-resolution peripheral quantitative CT (HR-pQCT).
Introduction
A recent study reports that cartilage damage is more associated with physical disability in rheumatoid arthritis (RA) than bone erosions 1. Assessment of cartilage damage in RA relies on semi-quantitative joint space narrowing scores (JSN) such as in the Outcome Measures in RA Clinical Trials RA MRI Scoring system (OMERACT-RAMRIS) 2, which is not sensitive to early changes in cartilage biochemistry 3. Quantitative MR T1ρ has been used to investigate early knee cartilage changes in osteoarthritis 4, few groups have evaluated its feasibility in human wrist cartilage and application towards tracking RA treatment response 5,6. While previous results have been encouraging, analysis of additional follow-up MRI is necessary to better understand treatment-related changes in radiocarpal cartilage. The purpose of our current study were: 1) to quantify T1ρ at 1-year follow-up and to see if longitudinal changes in T1ρ reflect changes in disease activity as measured by clinical scores and patient-reported outcomes (PRO) 1-year post-treatment initiation; 2) and to investigate if earlier changes in T1ρ (from baseline to 3-month follow-up) could predict other measures of disease activity at 1-year.Methods
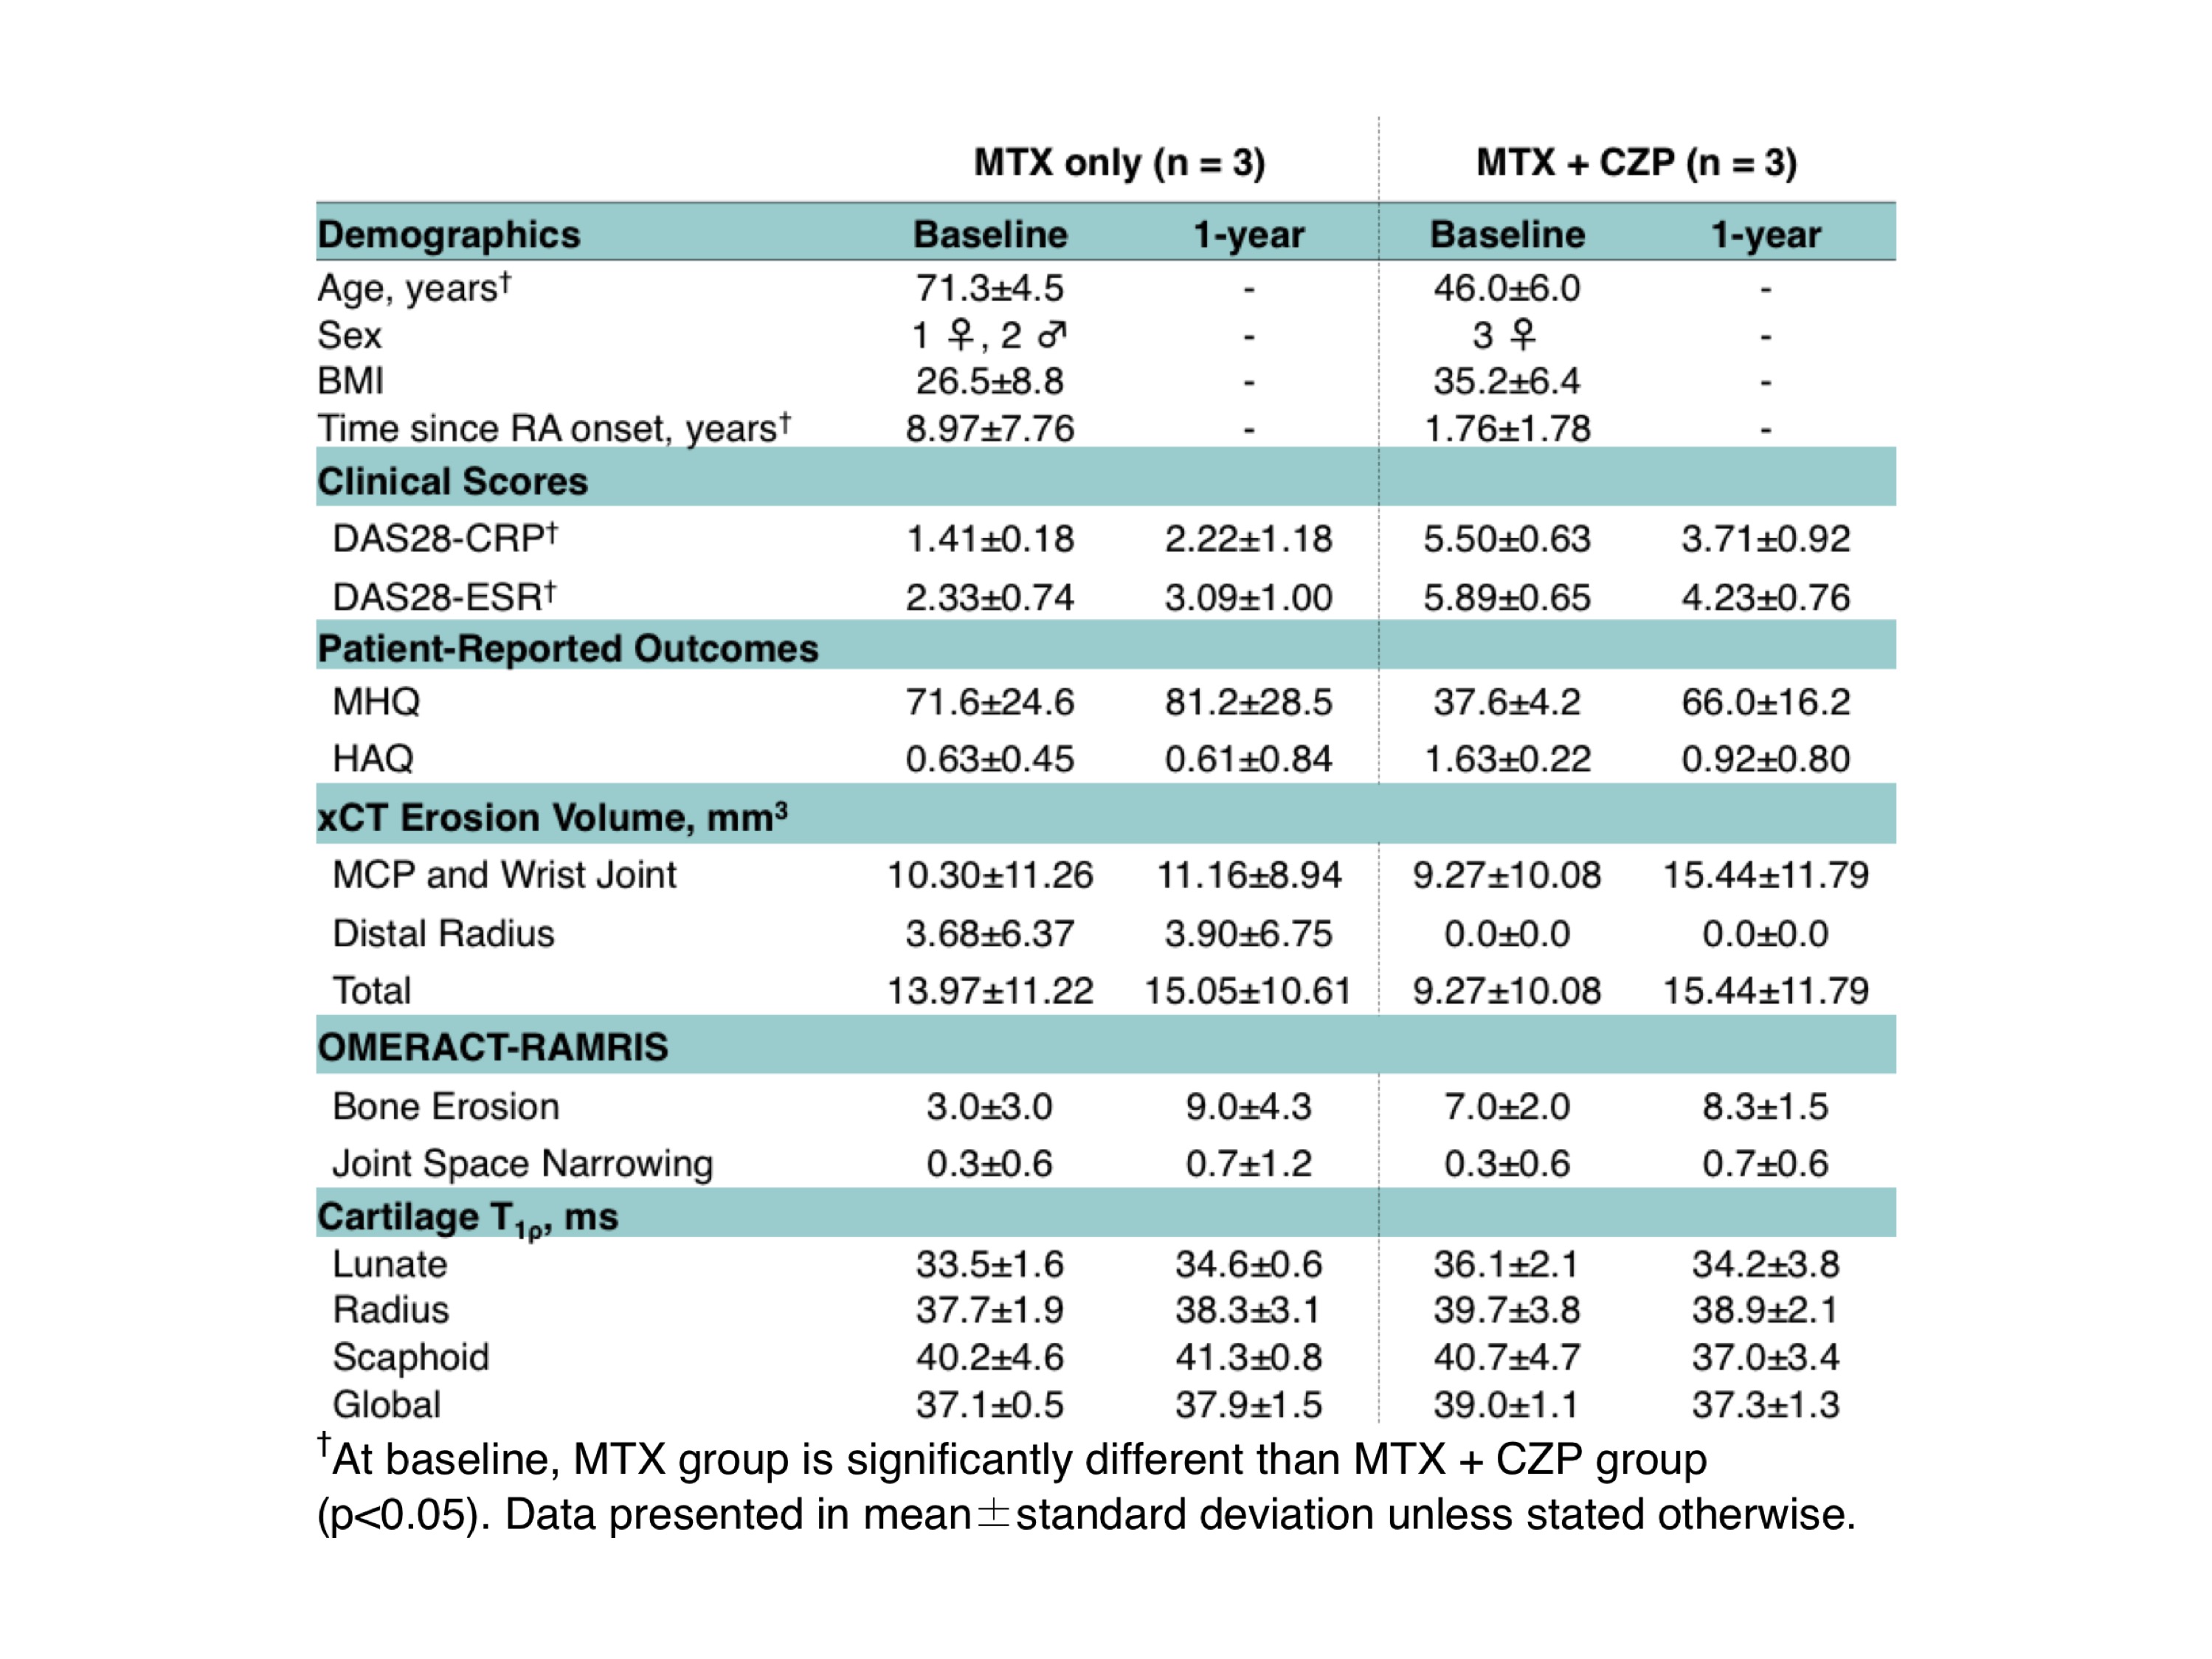
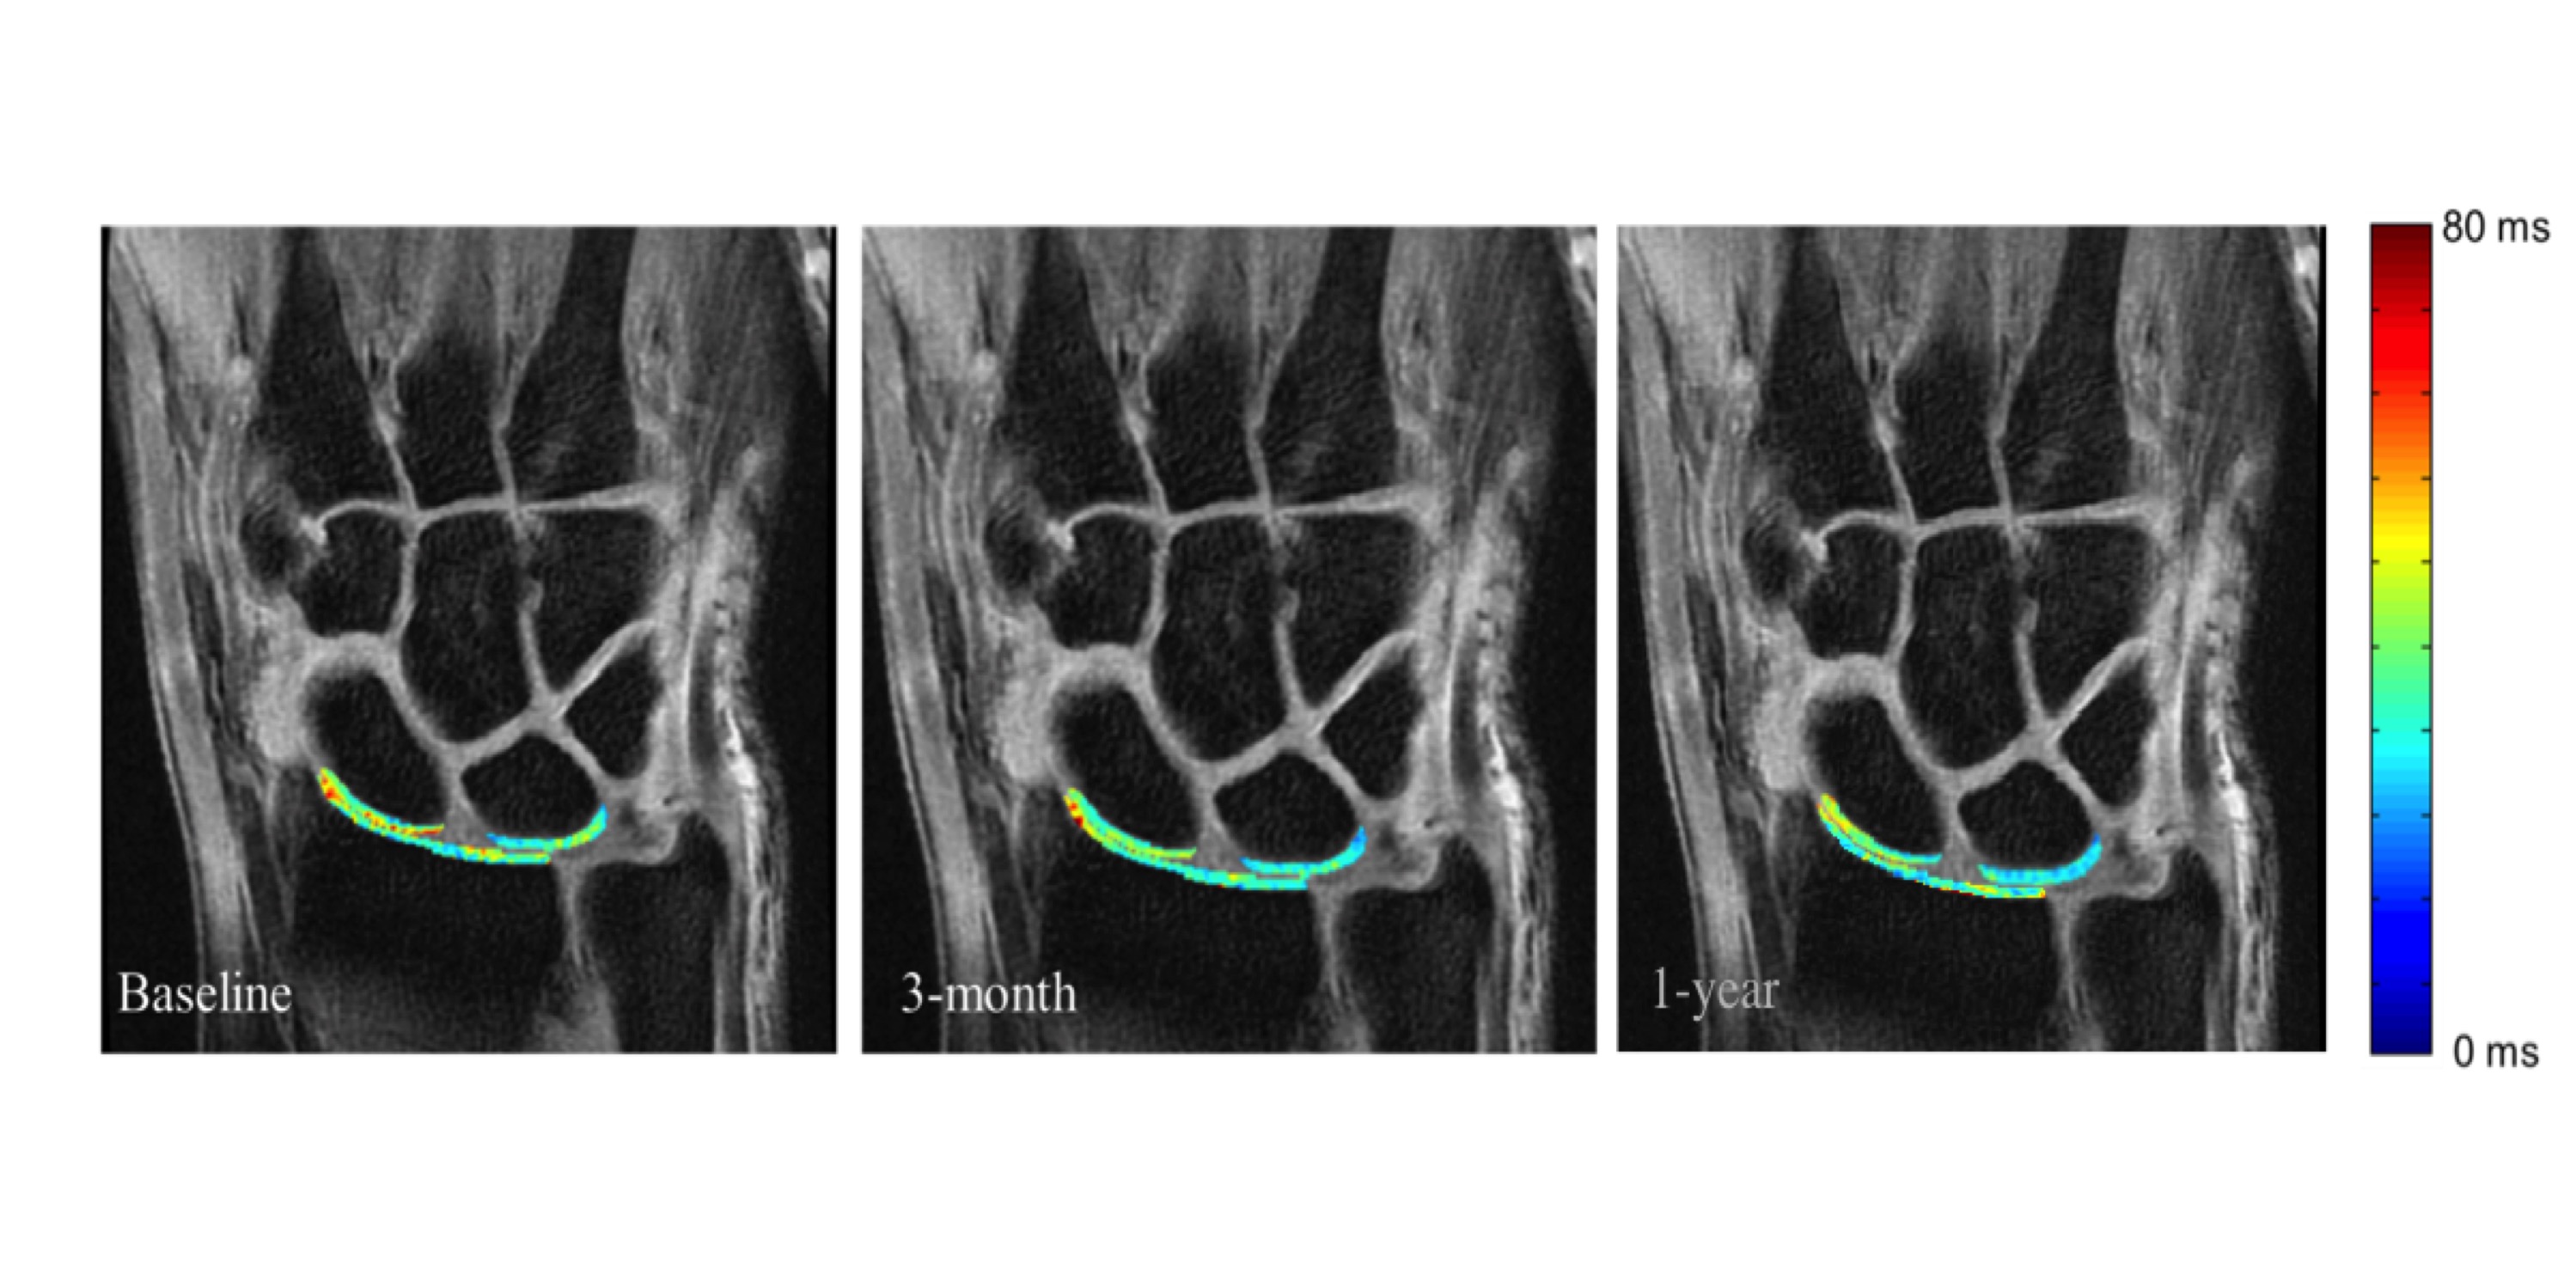
Six patients, three RA patients with active disease despite methotrexate (MTX) treatment were started on anti-TNF certolizumab pegol (CZP) therapy and three RA patients with low disease on MTX treatment alone, were followed for this study (Table 1). MRI, high-resolution peripheral quantitative CT (HR-pQCT), Disease Activity of 28 joints (DAS28), Michigan Hand Questionnaires (MHQ), and Stanford Health Assessment Questionnaires (HAQ) were taken at baseline, 3-months and 1-year after treatment initiation. MR Imaging was performed on a 3T scanner (GE Healthcare) with an eight-channel phase array receive-only wrist coil (Invivo). Coronal T1ρ images (TR/TE = 6.4/2.1 ms; in-plane resolution = 0.23mm; slice thickness = 3mm, time of spin-lock = 0/10/20/50 ms; spin-lock frequency = 500 Hz) were collected for lunate, scaphoid, and radius cartilage semi-automatic segmentation using the first echo images of T1ρ (Figure 1). Piecewise rigid registration using individual bone masks and longitudinal registration were used prior to pixel-by-pixel mono-exponential fitting to reconstruct T1ρ maps 5. Previous studies reported excellent intra-reader (coefficient variation [CV] < 1.5%), inter-reader (CV < 2.0%), and scan-rescan (CV< 3.8%) reproducibility 5. Coronal and axial T1-weighted IDEAL SPGR images (TR/TE = 15.3/2.9 ms; in-plane resolution = 0.2 mm; slice thickness = 1mm) were used to assess cartilage morphologic changes and loss based on a previously developed scoring system with intra- and inter-reader intra-class correlation (ICC) > 0.98 7. HR-pQCT imaging (82μm isotropic resolution, Scanco) of the metacarpophalangeal (MCP) and wrist joints were performed, and erosion volume was quantified using previously developed methods 8. Spearman rho was used for correlation analysis of changes in T1ρ, clinical scores (DAS28), patient-reported outcomes (MHQ and HAQ), and HR-pQCT erosion volumes.Results
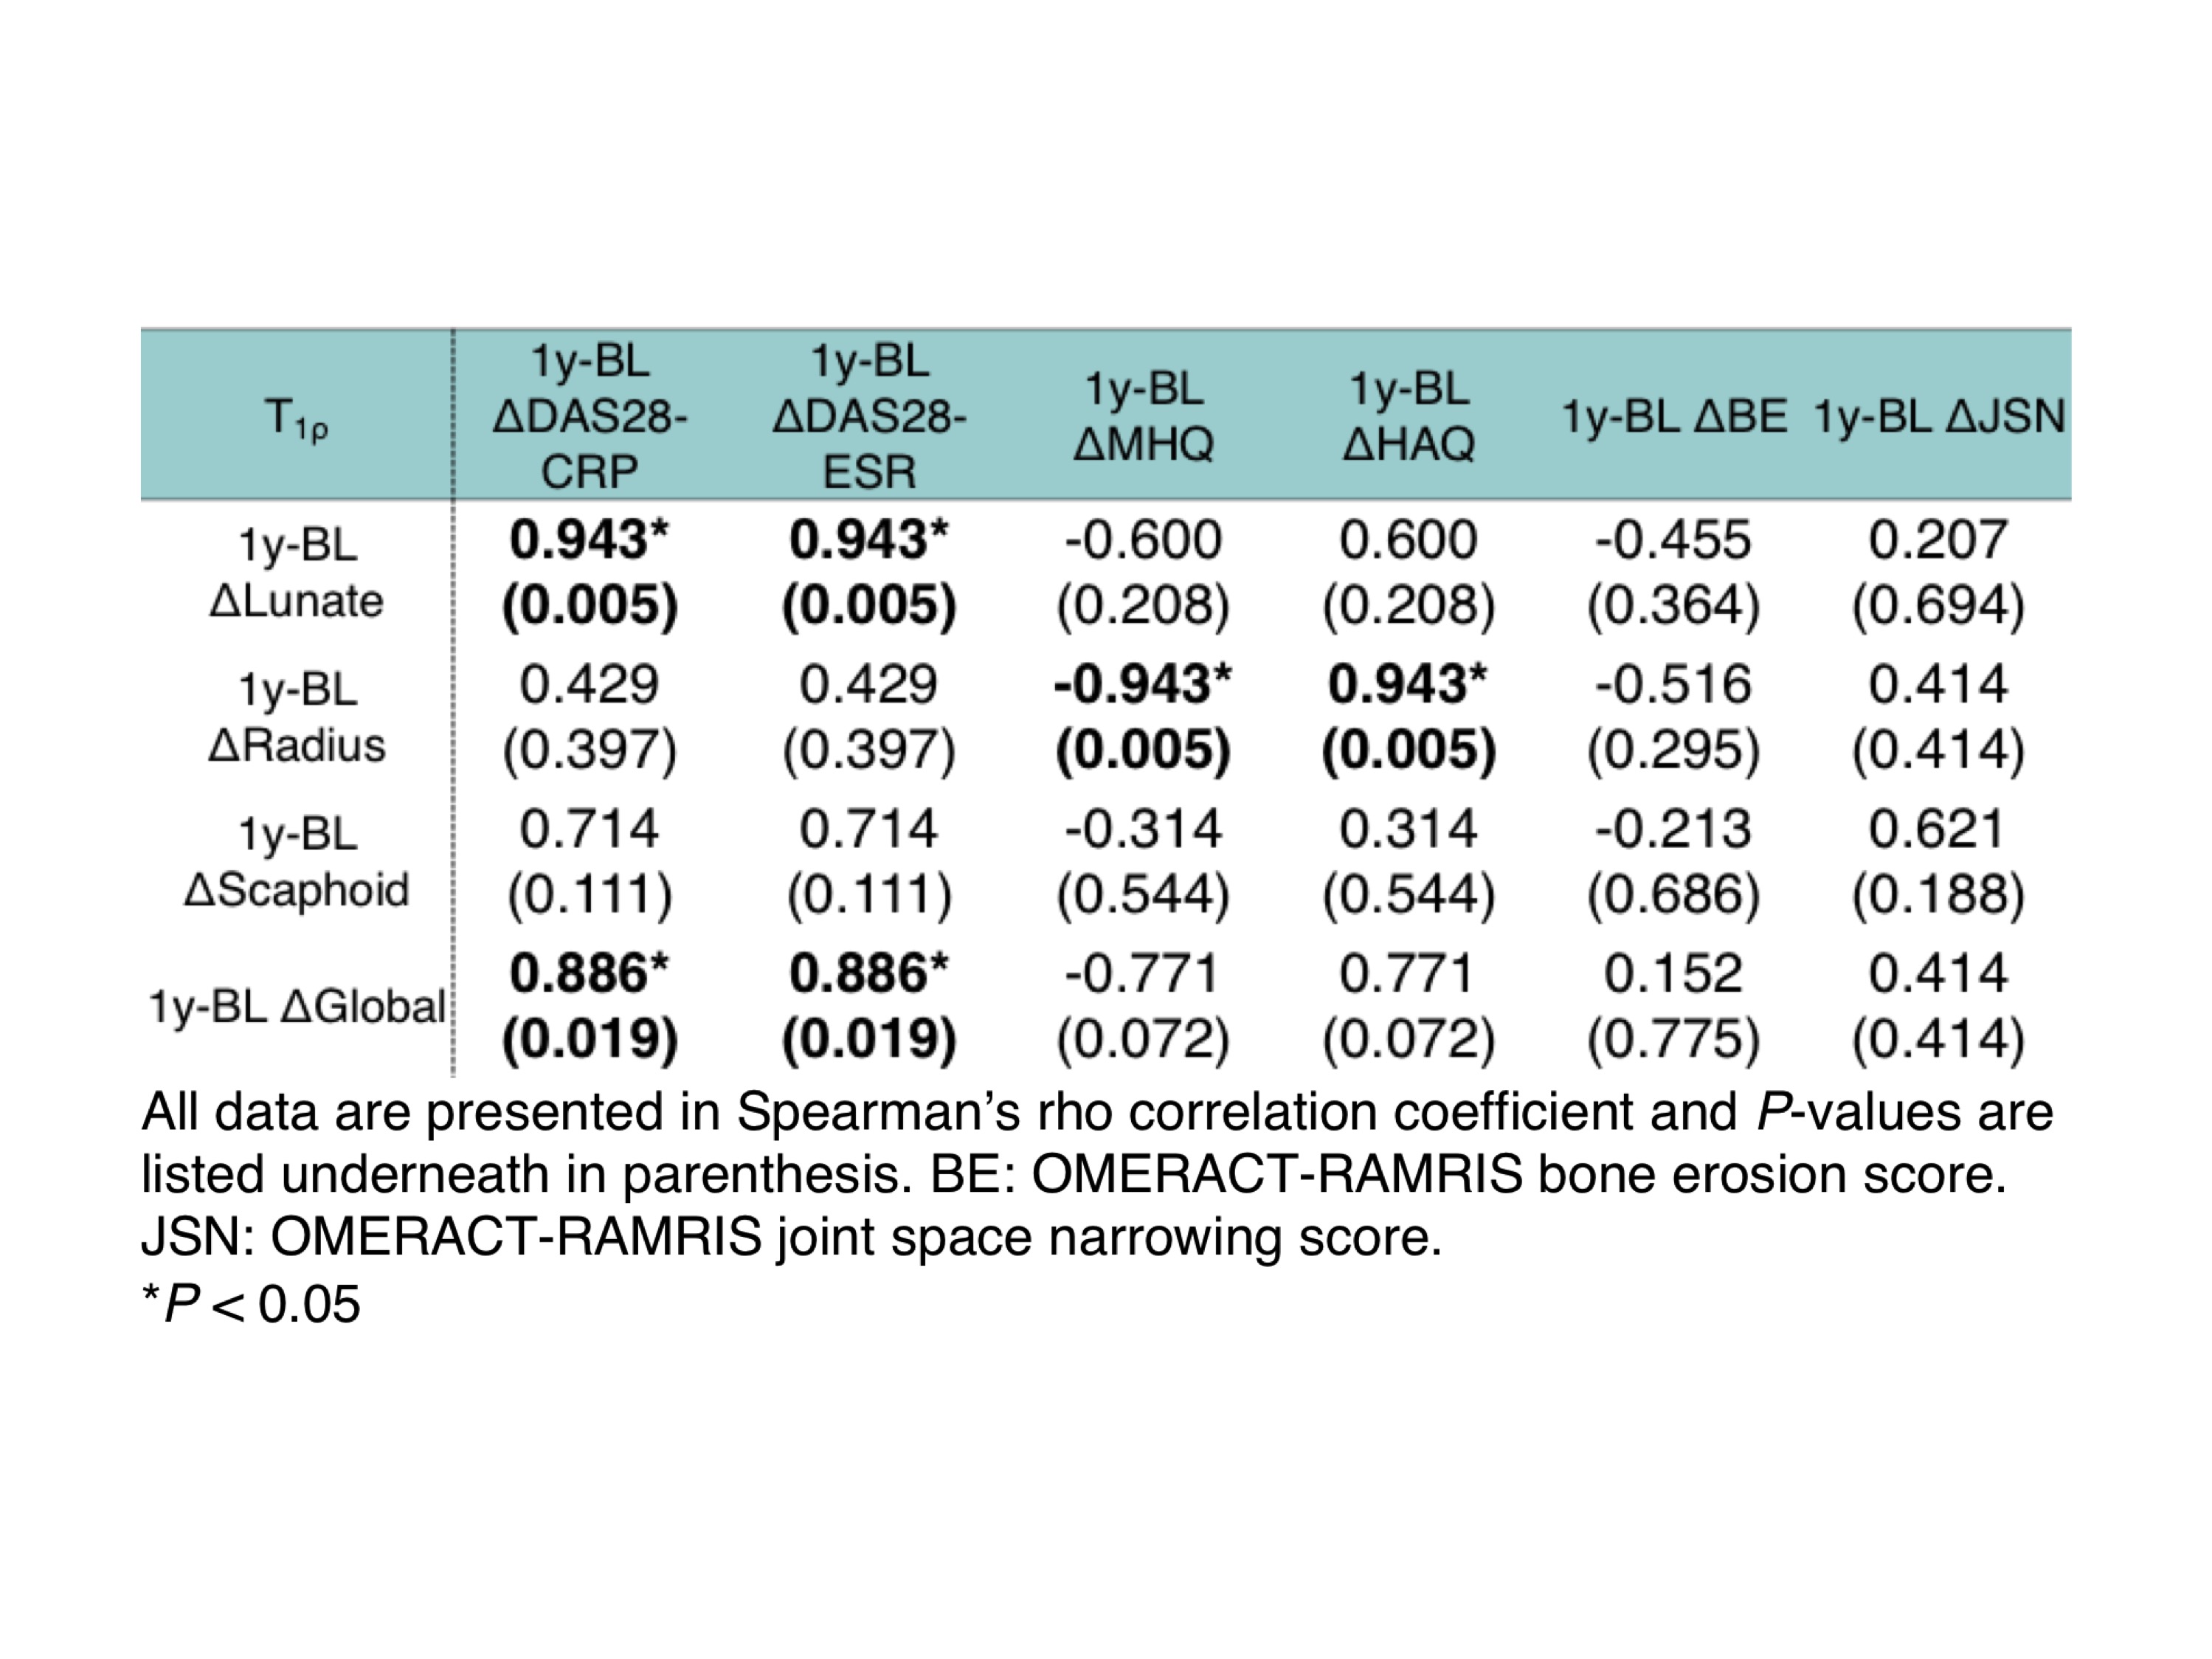
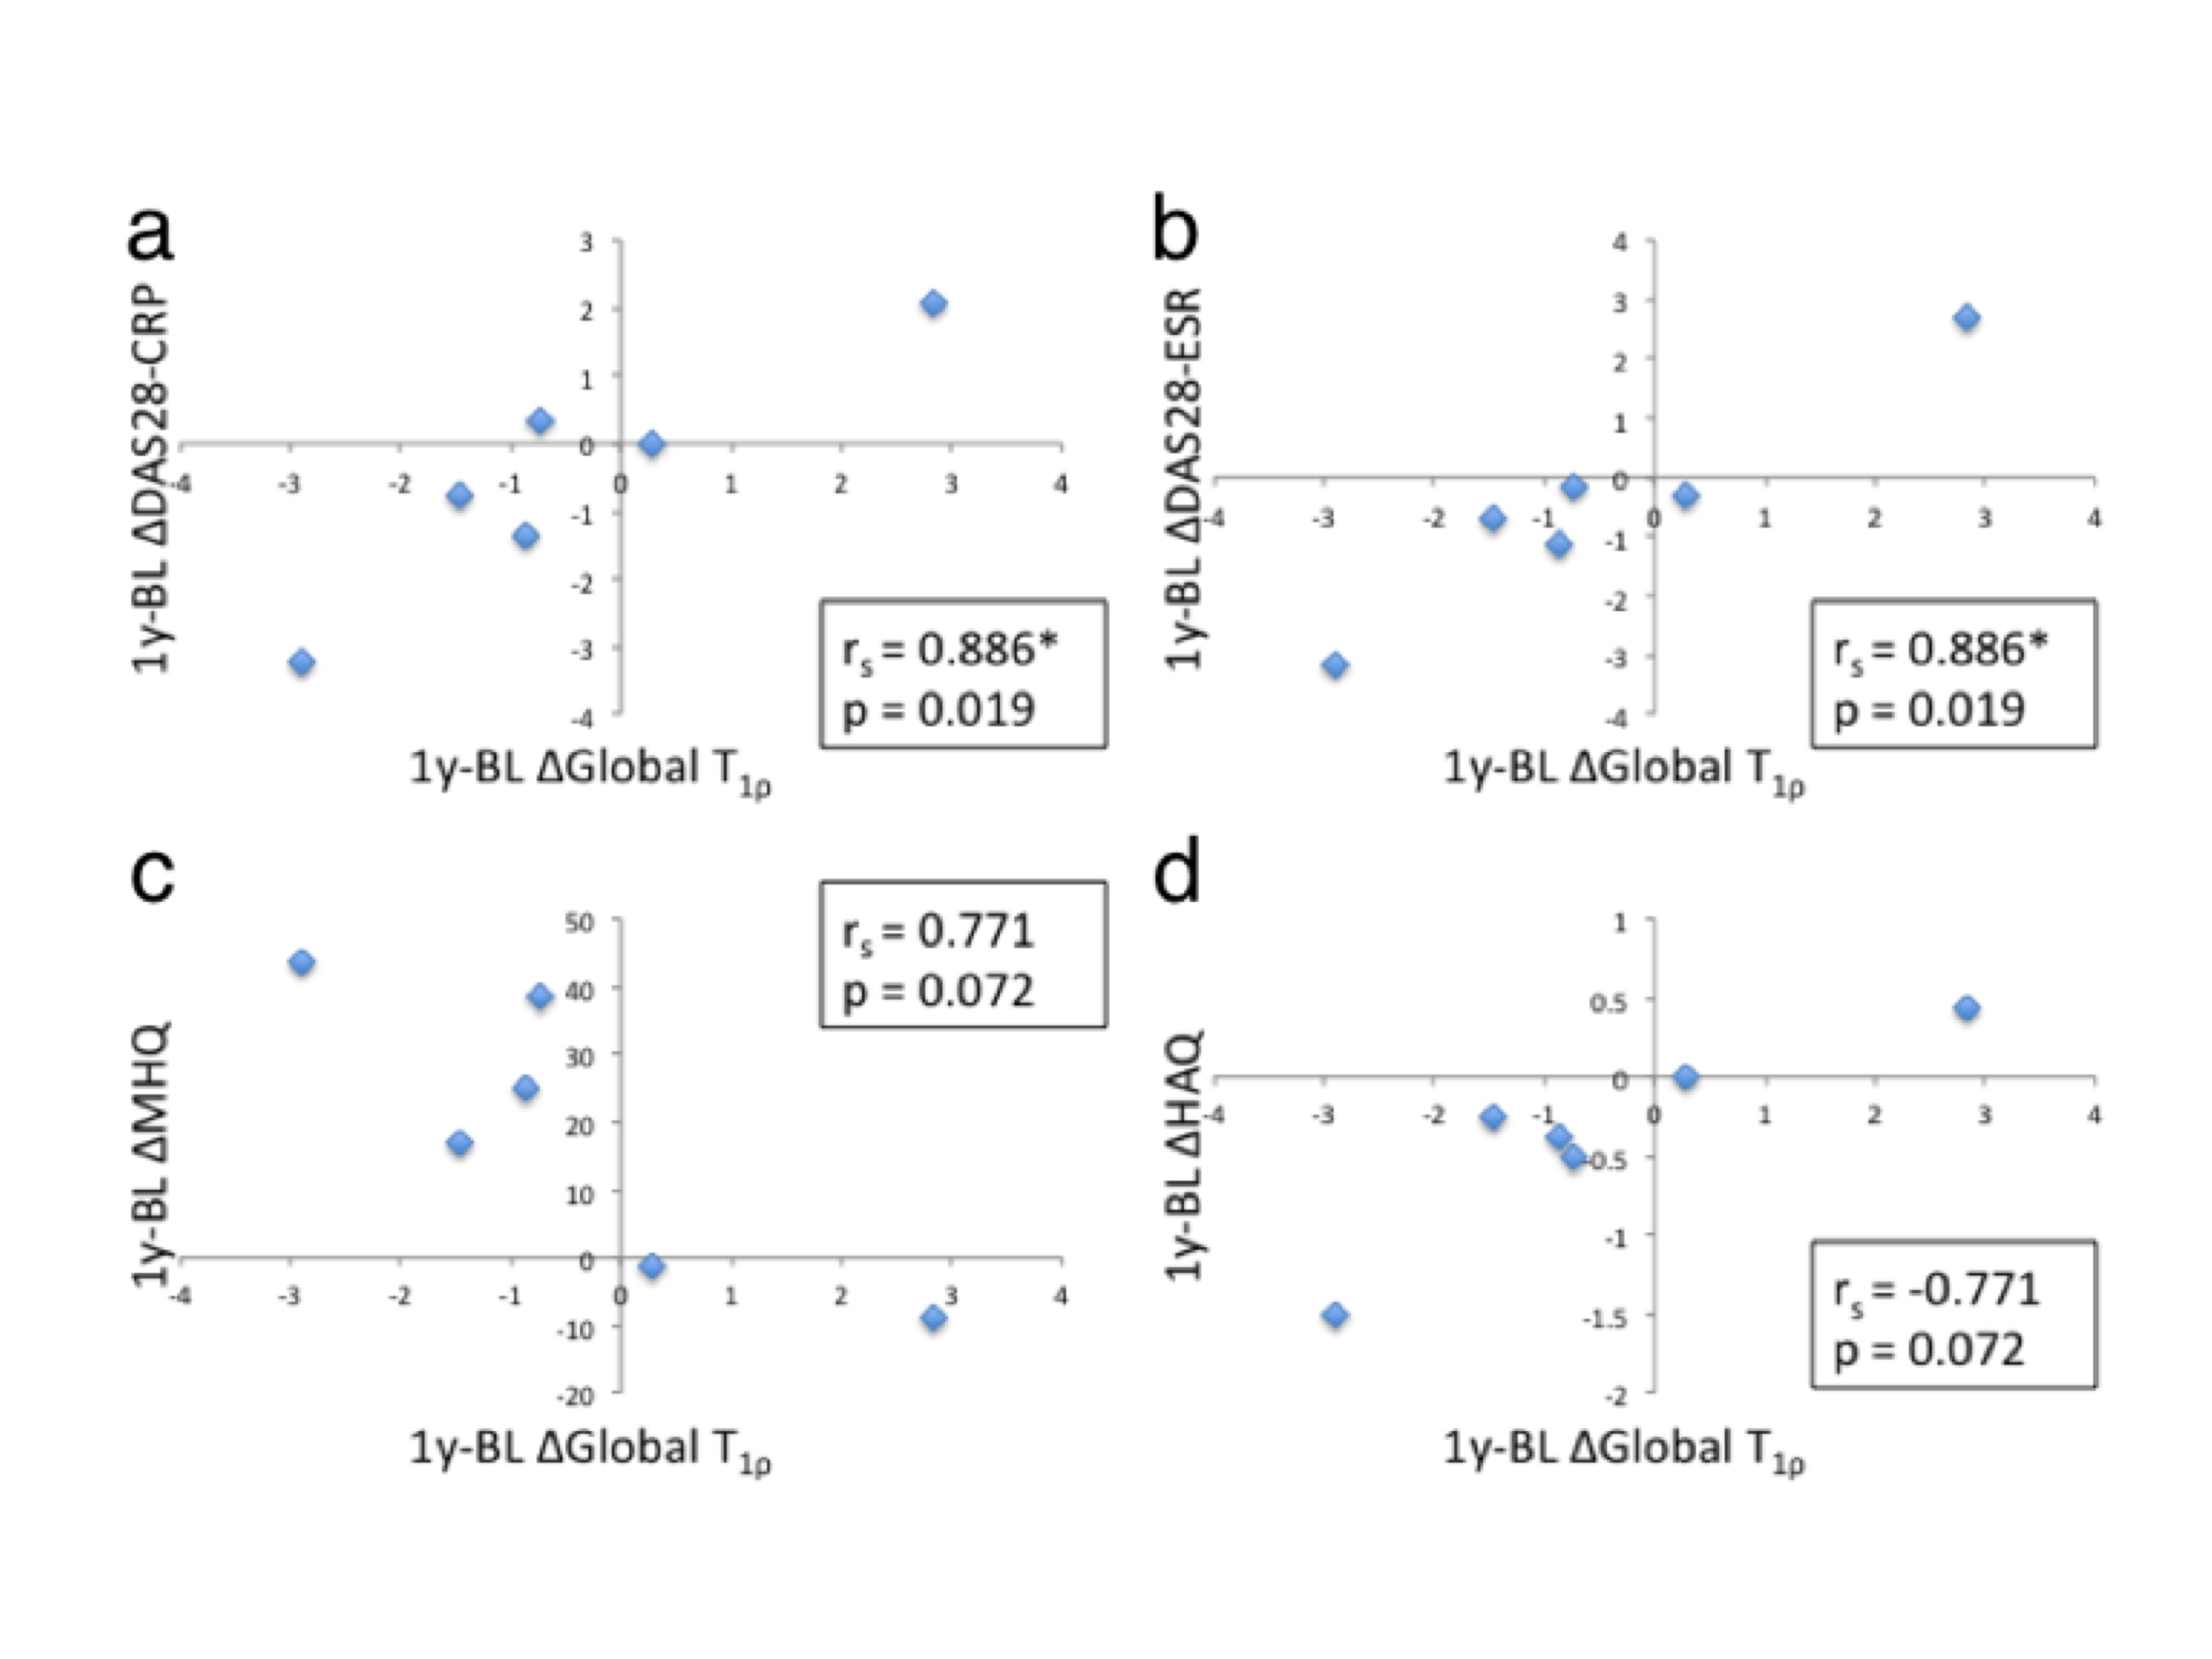
Change in global T1ρ between 1-year follow-up and baseline (1y-BL Δglobal T1ρ) and 1y-BL Δlunate T1ρ correlated significantly with 1y-BL ΔDAS28-CRP and ΔDAS28-ESR (rs = 0.886, p = 0.019 and rs = 0.943, p = 0.005, respectively, Table 2 and Fig. 2a and 2b). 1y-BL Δradius T1ρ correlated significantly (rs = -0.943, p = 0.005 and rs = 0.943, p = 0.005, respectively) while 1y-BL Δglobal T1ρ approached significance (rs = -0.771, p = 0.072 and rs = 0.771, p = 0.072, respectively, Fig. 2c and 2d) with 1y-BL ΔMHQ and Δ1y-BL HAQ. Changes in global T1ρ between 3-month follow-up and baseline (3m-BL Δglobal T1ρ) correlated significantly with 1y-BL ΔHR-pQCT MCP erosion volume (rs = 0.786, p = 0.036) and approached significance with 1y-BL ΔHR-pQCT total erosion volume (rs = 0.714, p = 0.071). No correlation was found between cartilage loss grading and DAS, MHQ, HAQ and erosion volumes.Discussion and Conclusion
Our study showed significant correlations between 1-year changes in T1ρ and 1-year changes in DAS28. This data is consistent with previous findings showing significant correlations between 3-month changes in T1ρ with both DAS28 and PRO 5. In contrast, we did not see any significant correlations with changes in 1-year cartilage loss scores, this supports T1ρ as potentially more sensitive to cartilage health changes after long-term treatment than MRI grading alone. Interestingly, we also observed a significant correlation between 3-month changes in T1ρ and 1-year changes in HR-pQCT quantified bone erosion, which suggests halting of erosion progression by anti-TNF therapy may be mediated through cartilage health improvement and supports T1ρ as a potential marker for predicting erosion progression. Despite limitations, which include small sample size and low out-of-plane resolution, our results support further research into T1ρ as a useful tool for assessing longitudinal changes in radiocarpal cartilage matrix health after RA treatment.Acknowledgements
This study was supported by UCB Pharma Inc.References
1. Aletaha D, Funovits J, Smolen JS. Physical disability in rheumatoid arthritis is associated with cartilage damage rather than bone destruction. Ann Rheum Dis 2011;70:733-739
2. Døhn UM, Conaghan PG, Eshed I, et al. The OMERACT-RAMRIS rheumatoid arthritis magnetic resonance imaging joint space narrowing score: intrareader and interreader reliability and agreement with computed tomography and conventional radiography. J Rheumatol. 2014 Feb; 41(2): 392-7.
3. Goldring SR. Pathogenesis of bone and cartilage destruction in rheumatoid arthritis. Rheumatol Oxf Engl. 2003; 42(Suppl 2):ii11-ii16.
4. Li X, Ma CB, Link TM, et al. In vivo T1rho and T2 mapping of articular cartilage in osteoarthritis of the knee using 3 T MRI. Osteoarthritis Cartilage. 2007 Jul; 15(7): 789–797.
5. Ku E, Pedoia V, Tanaka M, et al. Evaluating Radiocarpal Cartilage Matrix changes 3-months after anti-TNF treatment for Rheumatoid Arthritis using MR T1ρ Imaging. J Magn Reson. 2016 Sep 23. doi: 10.1002/jmri.25448. [Epub ahead of print]
6. Akella SVS, Regatte RR, Borthakur A, et al. T1rho MR imaging of the human wrist in vivo. Acad Radiol. 2003;10:614-619.
7. Yang H, Rivoire J, Hoppe M, et al. Computer-aided and manual quantifications of MRI synovitis, bone marrow edema-like lesions, erosion and cartilage loss in rheumatoid arthritis of the wrist.Skeletal Radiol. 2015 Apr;44(4):539-47.
8. Srikhum W, Virayavanich W, Burghardt AJ, et al. Quantitative and semiquantitative bone erosion assessment on high-resolution peripheral quantitative computed tomography in rheumatoid arthritis. J Rheumatol. 2013 Apr;40(4):408-16.
Figures