0653
Soft Tissue Tumors: Use of Intravoxel Incoherent Motion MR Imaging for Assessment of Diffusion and Perfusion for the Differentiation of Benign from Malignant Tumors1Department of Radiology, Guangdong General Hospital, Guangdong Academy of Medical Sciences, Guangzhou, People's Republic of China
Synopsis
The apparent diffusion coefficient (ADC) had better diagnostic performance than other Intravoxel incoherent motion (IVIM)-derived parameters did for differentiating malignancies from benign soft-tissue tumors. The f values of intermediate soft-tissue tumors are significantly lower than those of benign and malignant soft-tissue tumors. The combination of ADC and f values is significantly better than other IVIM parameters at differentiating soft-tissue tumors.
Introduction and Purpose
Soft-tissue tumors represent an uncommon heterogeneous group of mesenchymal lesions and MR imaging remains the mainstay for the evaluation of a soft-tissue mass based on several morphological imaging characteristics. However, the differentiation between benign and malignant soft-tissue tumors often poses significant diagnostic challenges to radiologists on conventional MRI. Although authors of several studies (1-6) have revealed the use of DWI for the differentiation between benign and malignant soft-tissue tumors, little information is available regarding the usefulness of IVIM parameters for evaluation of soft-tissue tumors (2). The purpose of this study was to determine the diagnostic potential of apparent diffusion coefficient (ADC) and intravoxel incoherent motion (IVIM)-derived parameters for the differentiation of benign, intermediate, and malignant soft-tissue tumors.Materials and Methods
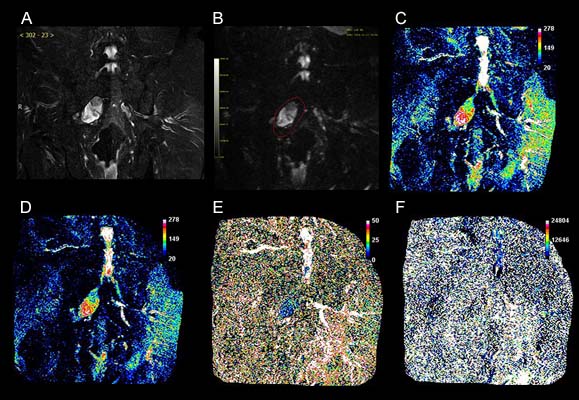
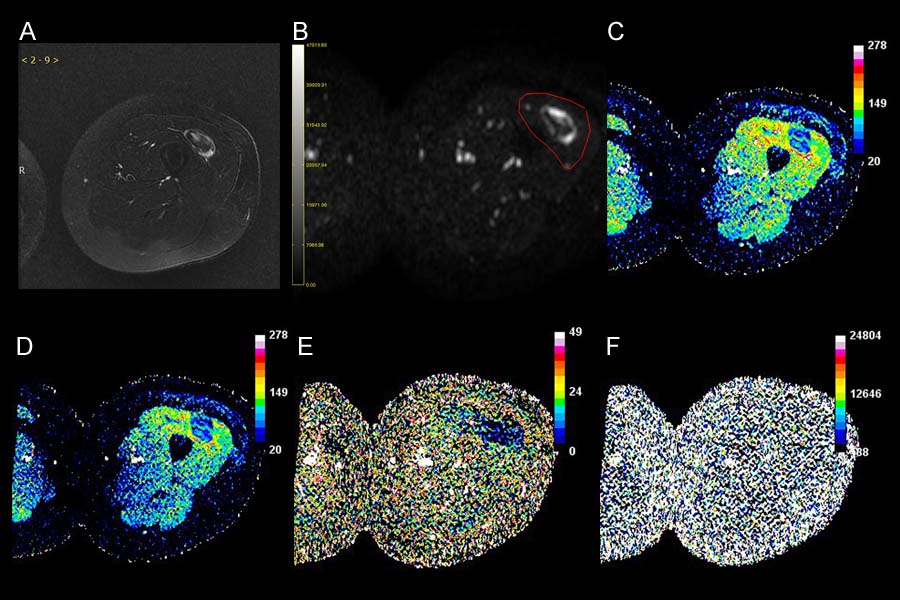
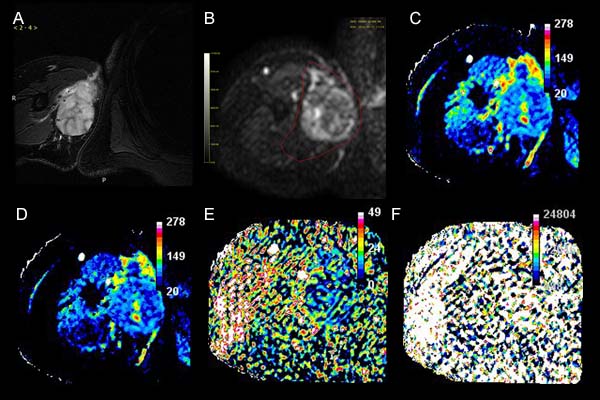
The institutional review board approved this prospective study, and informed consent was waived. IVIM imaging was performed in 64 patients including 44 benign, 6 intermediate, and 14 malignant soft-tissue tumors by using a 1.5-T MR imaging system (Achieva 1.5 T, Philips Healthcare, Best, Netherlands). IVIM DW images were obtained by using a free-breathing single-shot echo-planar imaging pulse sequence with diffusion gradients applied in three orthogonal directions with the following parameters: 4500 /65; section thickness, 5 mm; field of view, 38 × 38 cm2; matrix, 128 × 136; number of excitations (NEX), 6; and 12 different b values( b= 0, 10, 20, 30, 40,50, 75, 100, 150, 300, 500, and 800 s/mm2). DW imaging data were transferred to a computer equipped with a manufacturer-supplied software (PRIDE DWI Tool, version 1.5, Philips Healthcare) and workstation (Extended Workspace, Philips Healthcare) to extract the ADC and IVIM parameters, including the true diffusion coefficient (D), the pseudodiffusion coefficient (D*), and the perfusion fraction (f). Image J software (National institute of Health, Bethesda, MD) was used to manually draw ROI on each lesion at the level of maximum transverse diameter of lesions. The IVIM measurements of the soft-tissue tumors were assessed by using the Kruskal-Wallis test. The diagnostic performance of the parameters was evaluated by using receiver operating characteristic (ROC) analysis.Results
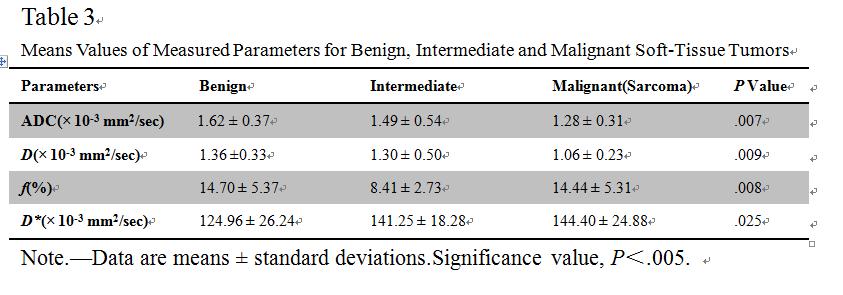
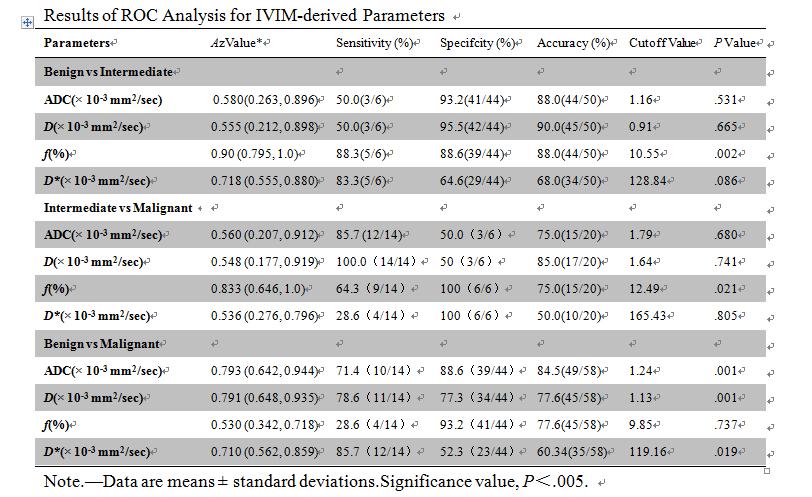
Mean values of ADC, D, D*, and f values of benign, intermediate and malignant soft-tissue tumors are described in Table 1. Although measurements of ADC, D, D*, and f in benign, intermediate and malignant soft-tissue tumors had significant differences (p = .007, p = .009, p = .025, and p = .008, respectively), only the ADC value and D value for the three types of soft-tissue tumors demonstrated a gradual decrease. In ROC analysis, for differentiation of intermediate from benign, and malignant soft-tissue tumors, f showed the highest Az value. The discrimination of malignant from benign soft-tissue tumors, however, ADC demonstrated the highest Az value, followed by D, D*, and f (Table 2). In the pairwise comparison of ROC curves between the parameters for differentiating intermediate soft-tissue tumors from the other groups, f showed significantly higher Az values than those of ADC, D and D* (P = .002 and P = .021, respectively). Furthermore, the difference of the Az values among the parameters of ADC, D and D* was not significant. In addition, for differentiating malignant (sarcoma) from benign soft-tissue tumors, ADC and D (P = .001 and P = .001, respectively) showed significantly higher Az values than those of D* (P = .019) and f (P = .737). By using the maximum ADC as a discriminative index for the discrimination of malignant from benign soft-tissue tumors, the sensitivity, specificity and accuracy were 71.4%, 88.6% and 84.5%, respectively. By using the f as a discriminative index for the discrimination of benign from intermediate soft-tissue tumors and of malignant from intermediate soft-tissue tumors, the respective sensitivity, specificity and accuracy were 88.3%, 88.6% and 88.0% for the former and 64.3%, 100.0% and 75.0% for the latter.Discussion and Conclusion
ADC had better diagnostic performance than IVIM parameters did at IVIM imaging for differentiating malignancies from benign soft-tissue tumors. The f values of intermediate soft-tissue tumors are significantly lower than those of benign and malignant soft-tissue tumors. The combination of ADC and f values is significantly better than other IVIM parameters at differentiating soft-tissue tumors.Acknowledgements
The authors would like to thank Yingjie Mei, B.S. (Philips China) for image post-processing and Xiuhui Li, MS, for image editing.References
1. Galant J, Martí-Bonmatí L, Sáez F, Soler R, Alcalá-Santaella R, Navarro M. The value of fat-suppressed T2 of STIR sequences in distinguishing lipoma from well-differentiated liposarcoma. Eur Radiol 2003; 13(2):337–343.
2. Fayad LM, Jacobs MA, Wang X, Carrino JA, Bluemke DA. Musculoskeletal tumors: how to use anatomic, functional, and metabolic MR techniques. Radiology 2012; 265(2): 340–56.
3. Zhao F, Ahlawat S, Farahani SJ, et al. Can MR imaging be used to predict tumor grade in soft-tissue sarcoma? Radiology 2014; 272(1): 192–201.
4. Subhawong TK, Jacobs MA, Fayad LM. Insights into quantitative diffusion-weighted MRI for musculoskeletal tumor imaging. AJR Am J Roentgenol 2014; 203(3): 560–572.
5. Oka K, Yakushiji T, Sato H, et al. Ability of diffusion-weighted imaging for the differential diagnosis between chronic expanding hematomas and malignant soft tissue tumors. J Magn Reson Imaging 2008; 28(5):1195–1200.
6. Namimoto T, Yamashita Y, Awai K, et al. Combined use of T2-weighted and diffusion-weighted 3-T MR imaging for differentiating uterine sarcomas from benign leiomyomas. Eur Radiol 2009; 19(11):2756–2764.
Figures