0652
Simultaneous T2 Relaxometry and Morphometry of Cartilage and Meniscus with Double-Echo in Steady-State in Five Minutes1Radiology, Stanford University, Stanford, CA, United States
Synopsis
Quantitative MRI parameters such as T2 relaxation times and morphometry are potential biomarkers for tracking spatial and temporal changes in musculoskeletal diseases and injuries. While cartilage has been widely studied, the short-T2 of meniscus makes it challenging to quantify in short scan times. In this study, we optimized the double-echo steady-state (DESS) pulse sequence to produce high-resolution and high signal-to-noise ratio images in five minutes. We compared the relaxometry and morphometry measures against established methods and found no significant differences. This suggests that a five-minute DESS scan could be used for simultaneous relaxometry and morphometry of the cartilage and meniscus.
Purpose
Osteoarthritis (OA) is one of the leading causes of disability amongst older populations1. Quantitative MRI parameters of T2 relaxation times and morphometry for cartilage and meniscus are potential biomarkers for tracking spatial and temporal changes in OA2,3. While the cartilage is well studied, the short-T2 of meniscus makes it challenging to image and quantify. Morphometry requires high-resolution imaging while relaxometry requires high-SNR imaging, which are challenging to achieve concurrently in clinically feasible scan times. In this study, we utilize the double-echo steady-state (DESS) sequence to perform simultaneous morphometry and T2 relaxometry of both, cartilage and meniscus, in only five minutes.Methods
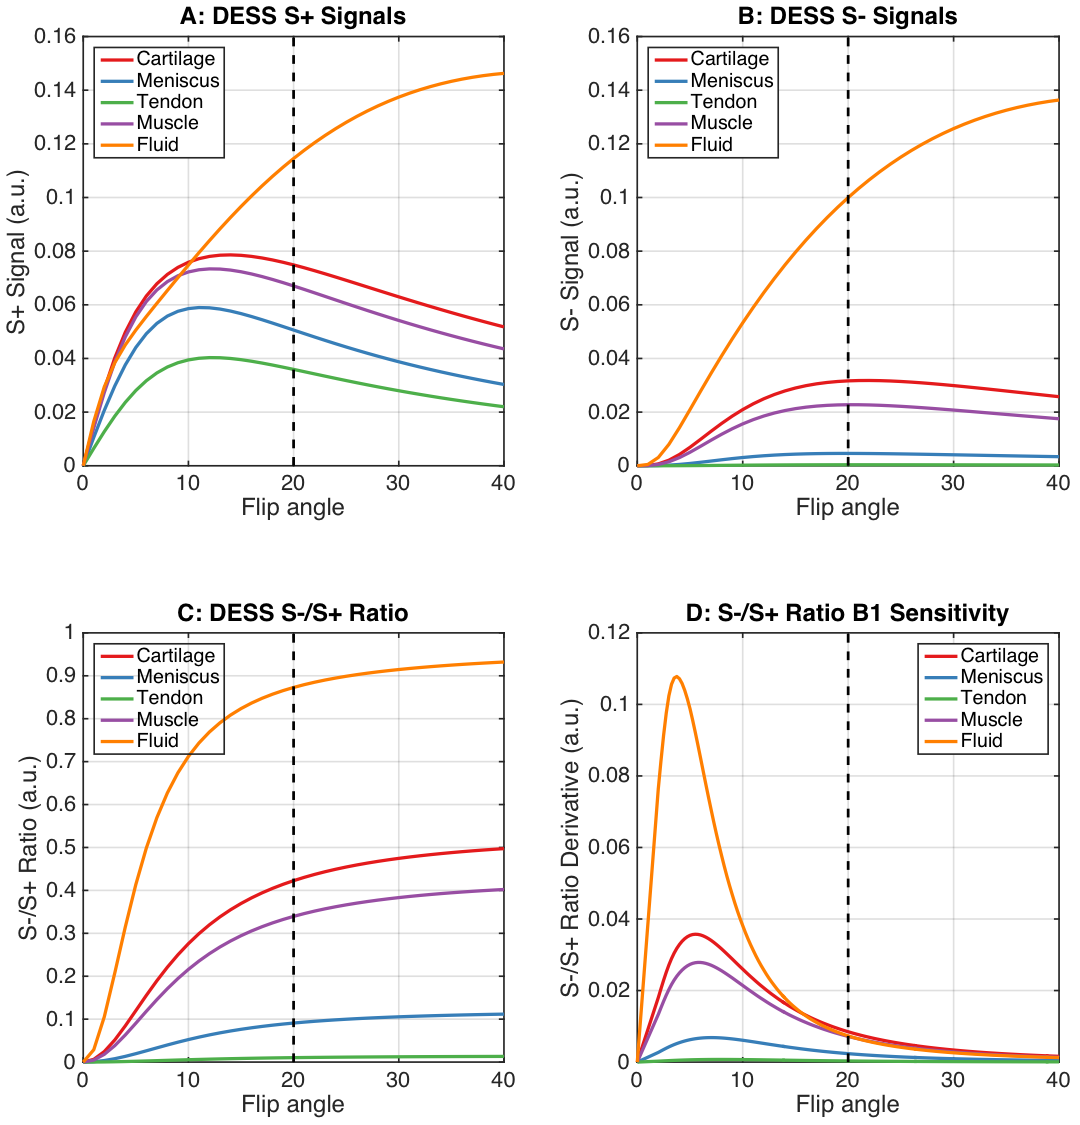
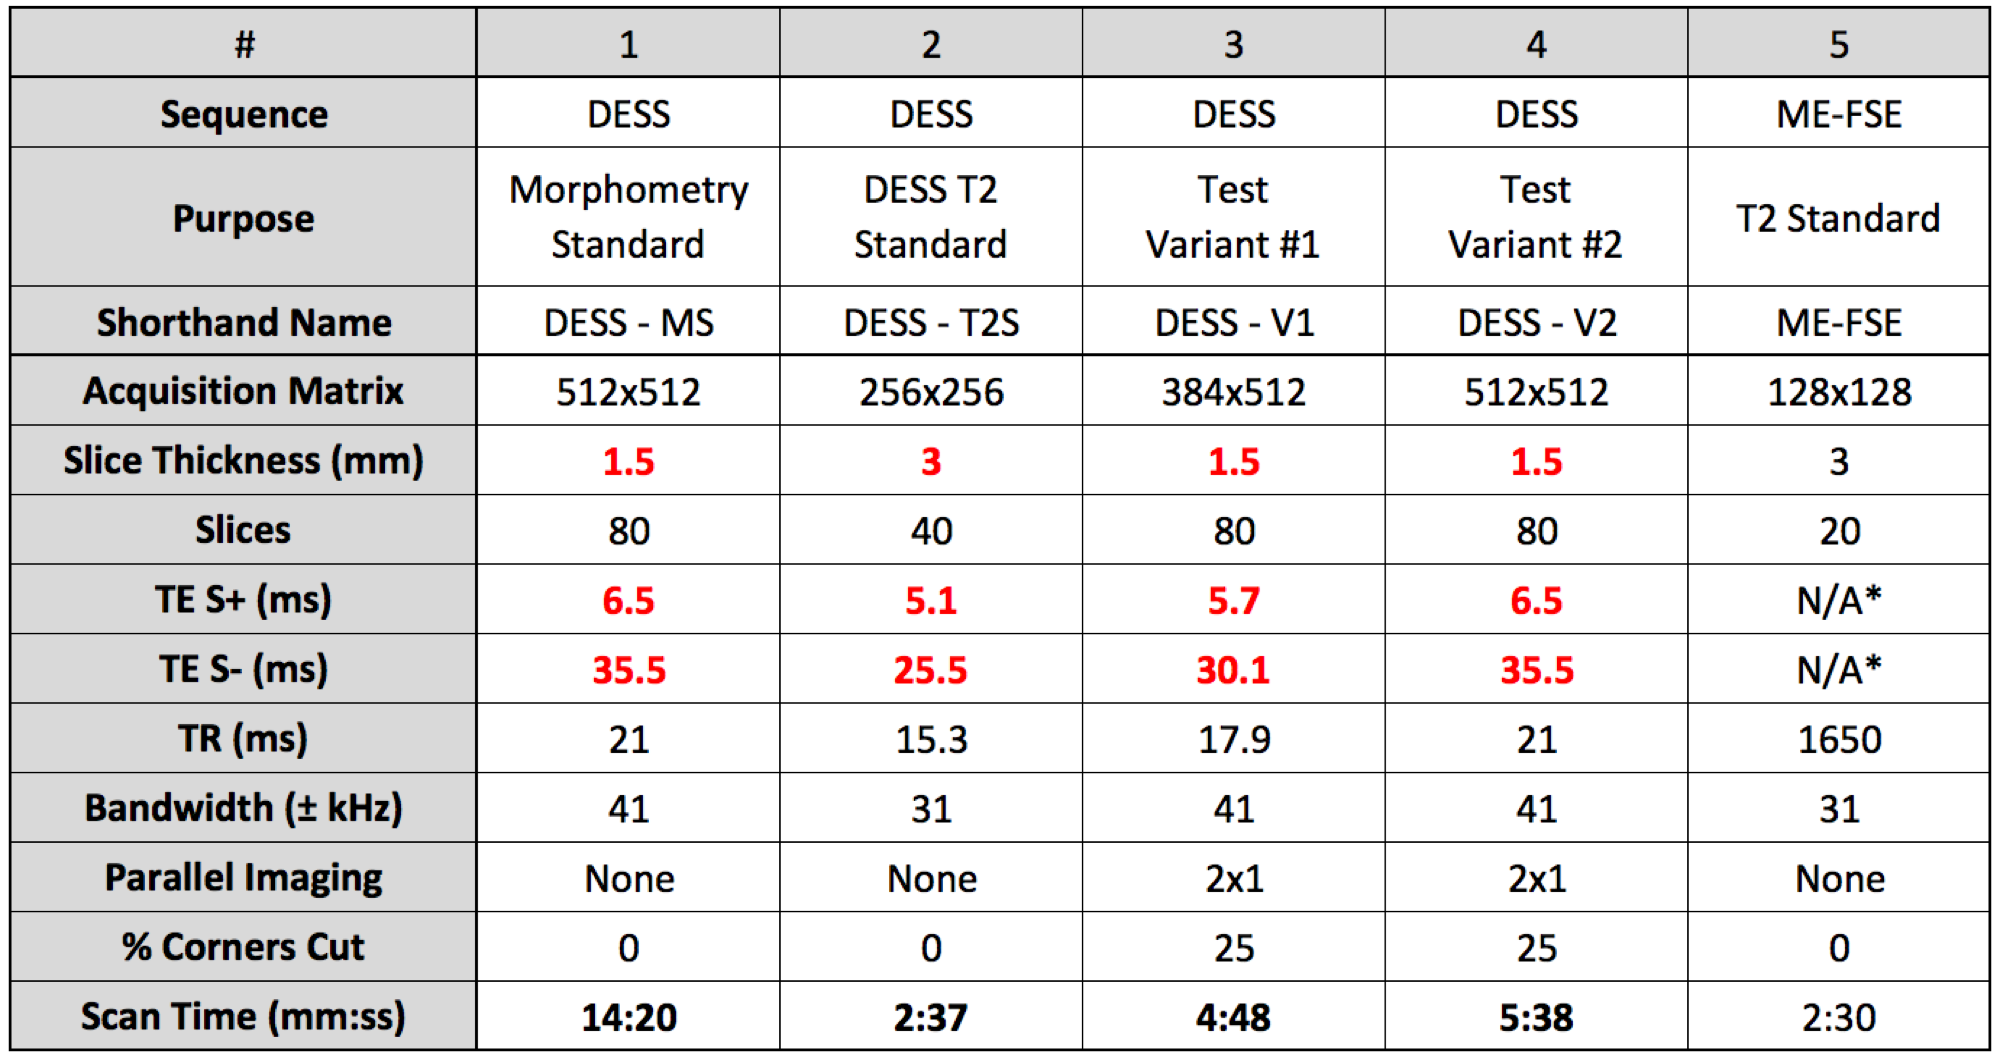
DESS produces two images, S+ (T1/T2-weighted) and S- (T2-weighted), and the S-/S+ ratio can be used to measure the T24,5,6. Despite using only two echoes, DESS produces accurate T2 measurements due to limited T1 and B1 sensitivity4,7. The flip angle sensitivity of DESS signals for various tissues was simulated with extended phase graphs8,9. 10 healthy volunteers were scanned with four variations of DESS (listed in Table 1) with a 16-channel receive-only knee coil.
Based on previously established methods, cartilage and meniscus morphometry was assessed with a high-resolution morphometry-standard scan (DESS-MS) while T2 relaxation times were calculated with a high-SNR T2-standard scan (DESS-T2S)5,10. Two additional DESS variant scans, differing their readout length (384 in DESS-V1 vs 512 in DESS-V2), were used for performing both, relaxometry and morphometry. The two DESS variant scans were compared with DESS-MS for morphometry and with DESS-T2S for relaxometry, in cartilage and meniscus.
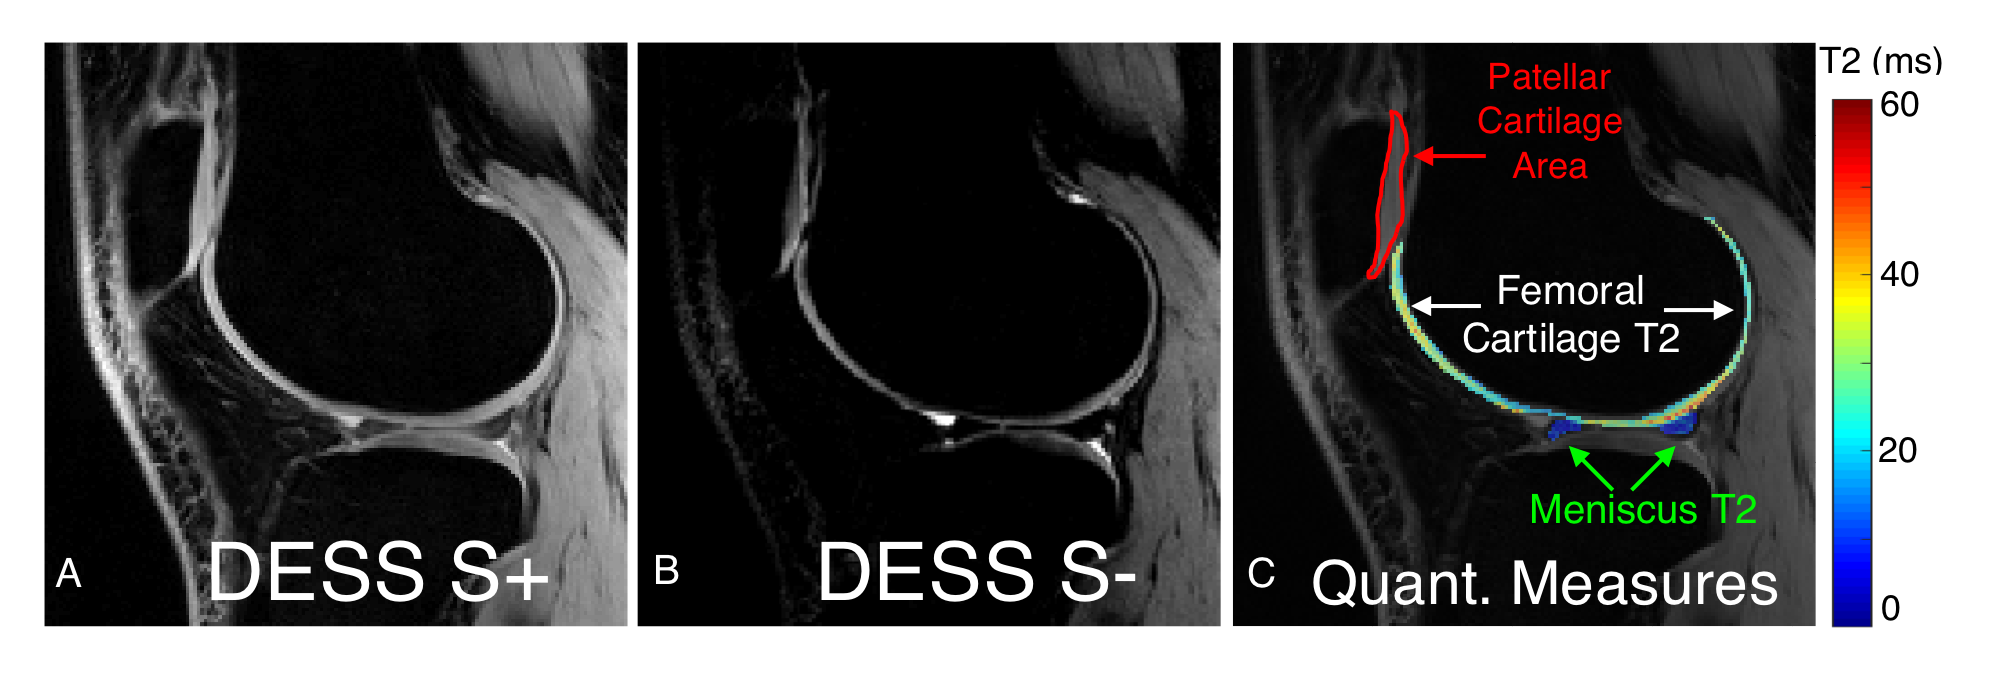
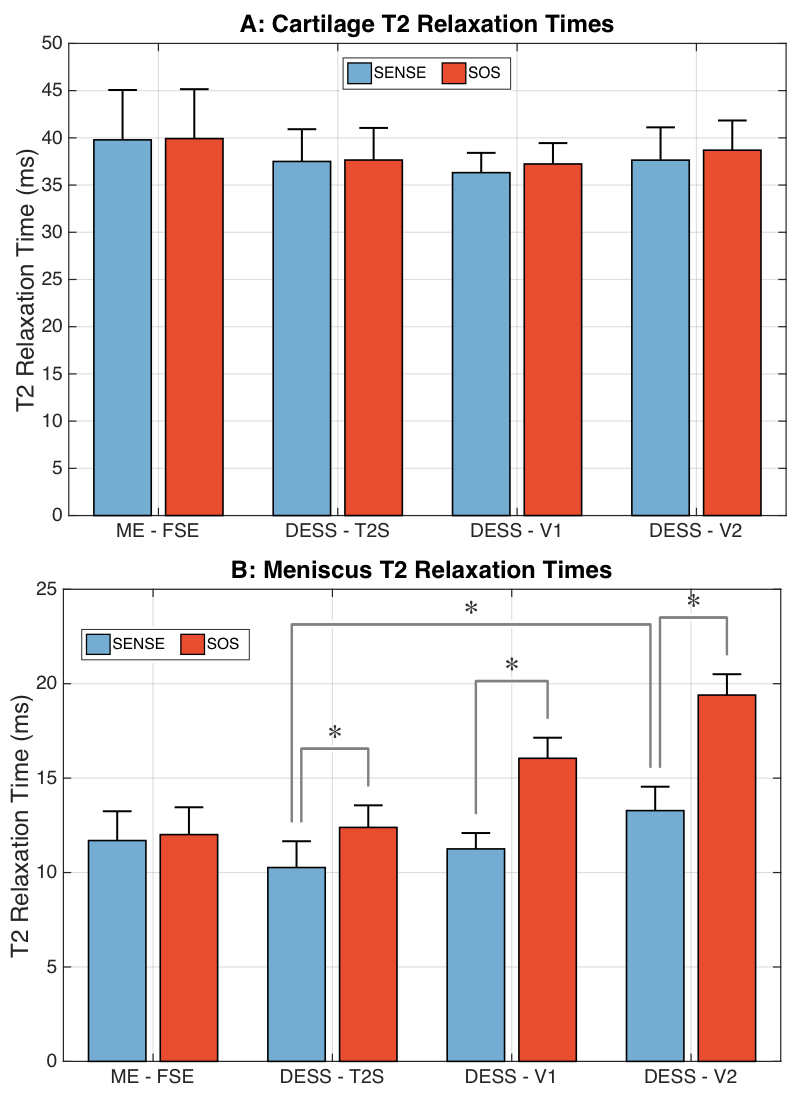
The total volume of the patellar cartilage and the posterior horn of the medial meniscus was measured with manual segmentation. Intra-reader variability was assessed by measuring the coefficient of variation (CV) for the same volume segmented on three separate days. For relaxometry, images were downsampled to a 0.6x0.6x3.0mm resolution to increase SNR. T2 was calculated in regions of interest (ROIs) in the medial femoral cartilage and the medial posterior meniscal horn where SNR was also estimated using background ROIs. Coil-combination was performed with both, sum-of-squares (SOS), and with an R=1 sensitivity encoding (SENSE) to evaluate noise biases. The DESS T2 was additionally compared to T2 measured with a monoexponential fit from a fast-spin-echo sequence (parameters in Table 1) in the segmented tissues. Morphometry and relaxometry differences from the variant scans were compared to DESS-MS and DESS-T2S respectively, in the same volunteers with a Wilcoxon signed-rank test (significance level of p=0.01) and using CVs.
Results and Discussion
A flip angle of 20° was chosen for DESS as it provided high cartilage and meniscus signal for T2 measurements (Fig. 1a-b) with limited B1 sensitivity (Fig. 1c-d). Moreover, this flip angle provided segmentation contrast for cartilage and the surrounding fluid, meniscus, and muscle (Fig. 2). SOS and SENSE T2 values were only statistically significant different in the meniscus, possibly due to SOS-induced noise biases (Fig. 3b). While FSE is commonly used for T2 measurements, it can over-estimate T2 due to stimulated echoes7, thus, T2 measurements were compared to DESS-T2S. The only significant variation between sequences was in DESS-V2, in the meniscus (Fig. 3b), possibly since S- meniscus SNR in DESS-V2 was 10% lower than DESS-V1, and 30% lower than DESS-T2S. Despite not being entirely accurate11, background-ROI-based SNR can be a useful comparison metric.
For morphometry, only the CVs and differences compared to DESS-MS are reported since there was large inter-subject variation. There was minimal inter-sequence variation (Figure 5) with the CVs under 4% for both variants in meniscus and cartilage, comparable to the intra-reader CVs of 2.9% and 2.6% respectively. Meniscus morphometry had slightly larger variations as the posterior boundary of the red zone was occasionally unclear during segmentation. DESS (with combined S+ and S-) with 0.7mm thick slices is used in the Osteoarthritis Initiative (OAI) for multi-planar reconstructions10, but 1.5mm slices are shown to be adequate for precise morphometry12. In total, the OAI requires 21 minutes of scan time for cartilage T2 measurements and morphometry. However, the DESS-V1 sequence, with SENSE coil combination, has the potential to provide relaxometry and morphometry for cartilage and the meniscus, in only five minutes.
It is important to note that this study included a small homogeneous sample size of healthy adults. Scanning a larger and heterogeneous OA population may still engender variations between the techniques in this study since the lack of statistical difference does not imply equivalence.
Conclusion
We have demonstrated the feasibility of performing five-minute simultaneous relaxometry and morphometry of the cartilage and meniscus with DESS, which may benefit longitudinal studies and routine clinical imaging.Acknowledgements
Research support was provided by NIH AR0063643, NIH EB002524, NIH AR062068, and GE Healthcare.References
1. Johnson, Victoria L., and David J. Hunter. "The epidemiology of osteoarthritis." Best practice & research Clinical rheumatology 28.1 (2014): 5-15.
2. Braun, Hillary J., and Garry E. Gold. "Diagnosis of osteoarthritis: imaging." Bone 51.2 (2012): 278-288.
3. Bloecker, Katja, et al. "Longitudinal change in quantitative meniscus measurements in knee osteoarthritis—data from the Osteoarthritis Initiative." European radiology 25.10 (2015): 2960-2968.
4. Staroswiecki, Ernesto, et al. "Simultaneous estimation of T2 and apparent diffusion coefficient in human articular cartilage in vivo with a modified three-dimensional double echo steady state (DESS) sequence at 3 T." Magnetic resonance in medicine 67.4 (2012): 1086-1096.
5. Sveinsson B, Gold, G., Hargreaves, B. Quantification and artifact reduction from simple modeling of DESS signals. In: Proceedings of the 24th Annual Meeting of ISMRM, Singapore, Singapore 2016:p. 788.
6. Welsch GH, Scheffler K, Mamisch TC, Hughes T, Millington S, Deimling M, Trattnig S. Rapid estimation of cartilage T2 based on double echo at steady state (DESS) with 3 Tesla. Magnetic resonance in medicine 2009;62(2):544-549. 7. Matzat, Stephen J., et al. "T2 Relaxation time quantitation differs between pulse sequences in articular cartilage." Journal of Magnetic Resonance Imaging 42.1 (2015): 105-113.
8. Weigel, Matthias. "Extended phase graphs: Dephasing, RF pulses, and echoes-pure and simple." Journal of Magnetic Resonance Imaging 41.2 (2015): 266-295.
9. Jordan, Caroline D., et al. "Musculoskeletal MRI at 3.0 T and 7.0 T: a comparison of relaxation times and image contrast." European journal of radiology 82.5 (2013): 734-739.
10. Peterfy, C. G., E. Schneider, and M. Nevitt. "The osteoarthritis initiative: report on the design rationale for the magnetic resonance imaging protocol for the knee." Osteoarthritis and Cartilage 16.12 (2008): 1433-1441.
11. Eckstein, Felix, et al. "Double echo steady state magnetic resonance imaging of knee articular cartilage at 3 Tesla: a pilot study for the Osteoarthritis Initiative." Annals of the rheumatic diseases 65.4 (2006): 433-441.
12. Dietrich O, Raya JG, Reeder SB, Reiser MF, Schoenberg SO. Measurement of signal-to-noise ratios in MR images: influence of multichannel coils, parallel imaging, and reconstruction filters. Journal of magnetic resonance imaging : JMRI 2007;26(2):375-385.
Figures