0647
Longitudinal characterization of deformation-induced skeletal muscle damage by T2-mapping, DWI and MRE1Biomedical NMR, Eindhoven University of Technology, Eindhoven, Netherlands, 2Preclinical and Translational MRI, Academic Medical Center, Amsterdam, Netherlands, 3Biomechanics of Soft Tissues, Eindhoven University of Technology, Eindhoven, Netherlands, 4Division of Imaging Sciences & Biomedical Engineering, King's College London, London, United Kingdom, 5Radiology, Academic Medical Center, Amsterdam, Netherlands, 6Department of Radiology, University Medical Center Utrecht, Utrecht, Netherlands
Synopsis
Skeletal muscle injury is often accompanied by fibrosis, fatty infiltration, and edema. There is great need for imaging readouts to detect and quantify such compositional changes, which would aid understanding and greatly assist in the development of emerging therapies. The goal of this work was to use a multi-modality approach, combining magnetic resonance elastography (MRE; muscle stiffness, fibrosis) with diffusion-weighted imaging (DWI; myocyte integrity) and T2-mapping (edema, inflammation) to provide a comprehensive assessment of muscle injury development and regeneration. The multi-modality assessment provided differential readouts of the deformation-induced muscle injury development and regeneration process.
Purpose
Skeletal muscle injury is often accompanied by fibrosis, fatty infiltration, and edema. There is great need for imaging readouts to detect and quantify such compositional changes, which would aid understanding and greatly assist in the development of emerging therapies. The goal of this work was to use a multi-modality approach, combining magnetic resonance elastography (MRE; muscle stiffness, fibrosis) with diffusion-weighted imaging (DWI; myocyte integrity) and T2-mapping (edema, inflammation) to provide a comprehensive assessment of muscle injury development and regeneration. To that aim, MRE, DWI and T2-mapping were performed before, during, and up to 14 days after damage-inducing indentation of the tibialis anterior muscle (TA) of Sprague Dawley rats.Materials & Methods
Rat model: For this study 11-week-old SD rats (female,n=5) were used. A previously
described MR Compatible indentation and MRE setup was used to apply mechanical
loading to the TA [1]. The right leg of the rat
was fixated with alginate molding substance, while keeping the TA accessible
for the indentor and the MRE-piston. The MRE piston was placed against the tendon
at the distal side of the TA. Indentation of the TA muscle, for a period of 2h,
took place in the MR scanner. Damage was induced at day 0. Measurements were performed
pre-indentation, during-indentation and at 3,5,7,10 and 14 days post-indentation.
In vivo MRI:
A Bruker 7.0 T scanner was used with either a 2 or 3 cm diameter receive
surface coil. The coil was placed on top of the TA muscle inside the MR
compatible indentation setup, in combination with an 86 mm diameter excitation
coil. Skeletal muscle edema was assessed with T2-mapping (Spin-Echo,
axial and coronal, FOV=3x6cm2, MTX=256x512, TE=10.2–203.6ms, 20 echoes,
TR=4s, fat suppression), changes in mechanical properties with an SE-EPI-MRE
sequence (coronal, FOV=3x6cm2, MTX=96x192, 8 MRE-frames, NEX=4, s|p|f|ref-directions),
and diffusion in 3-orthogonal directions with a SE-EPI-DWI sequence (axial, FOV=6x3cm2,
MTX=128x64, b-values=2-5-10-15-20-25-50-100-200-400-600-800 s/mm2)
Data
Analysis:
MRE
elastograms representing the real part of the complex shear modulus Gd
were calculated with a direct inversion algorithm of Sinkus et al. implemented in ROOT (ROOT 5.34/17) [2,3]. Quantitative T2-maps and mean diffusivity
(MD) were calculated with Mathematica 10.4 (Mathematica
10, Wolfram, USA) using DTITools of Froeling et al. [4]. Region-of-interest (ROI)
based analysis was performed. Mean values of Gd, MD and T2
were determined.
Results and Discussion
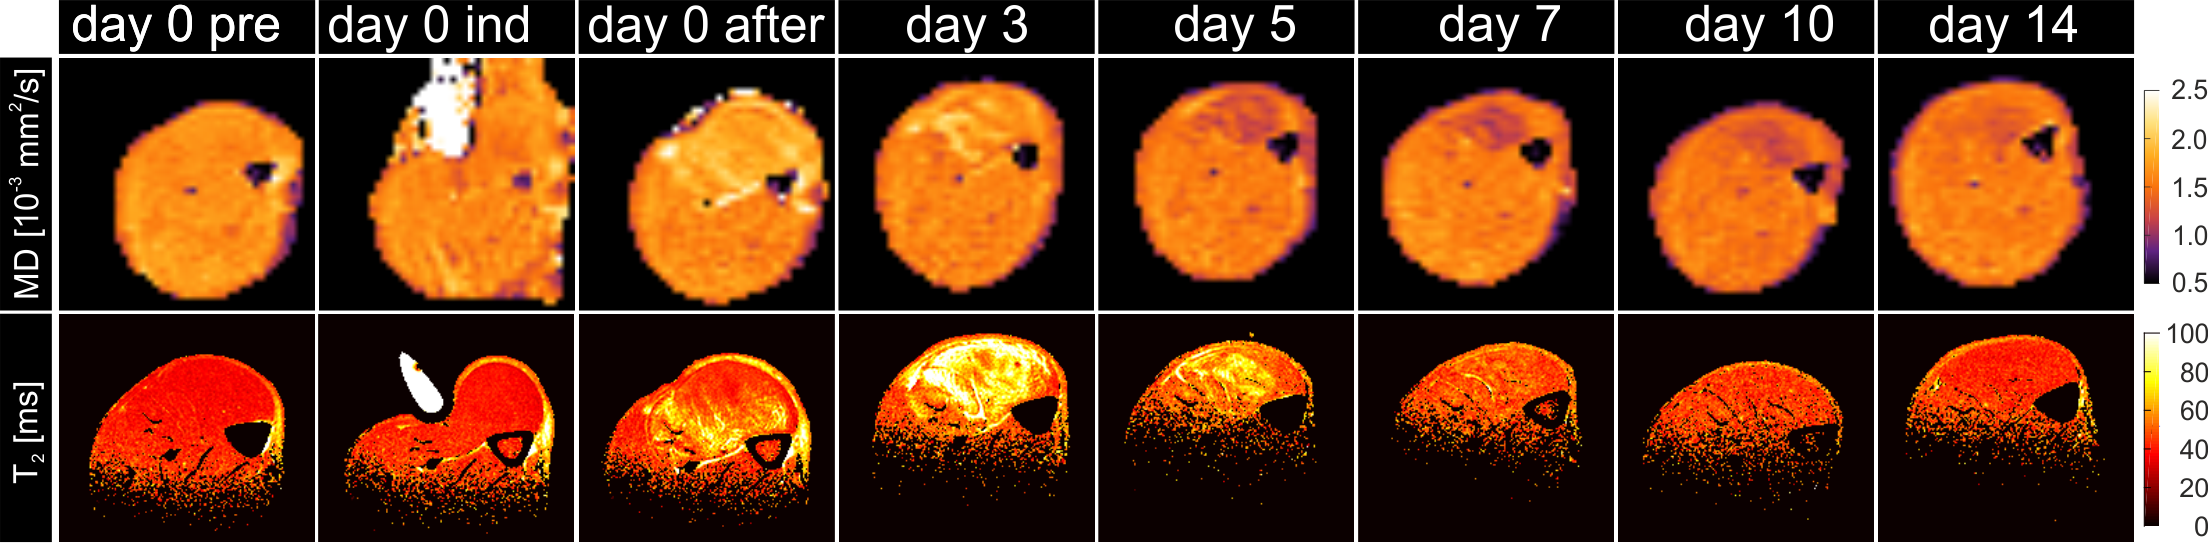
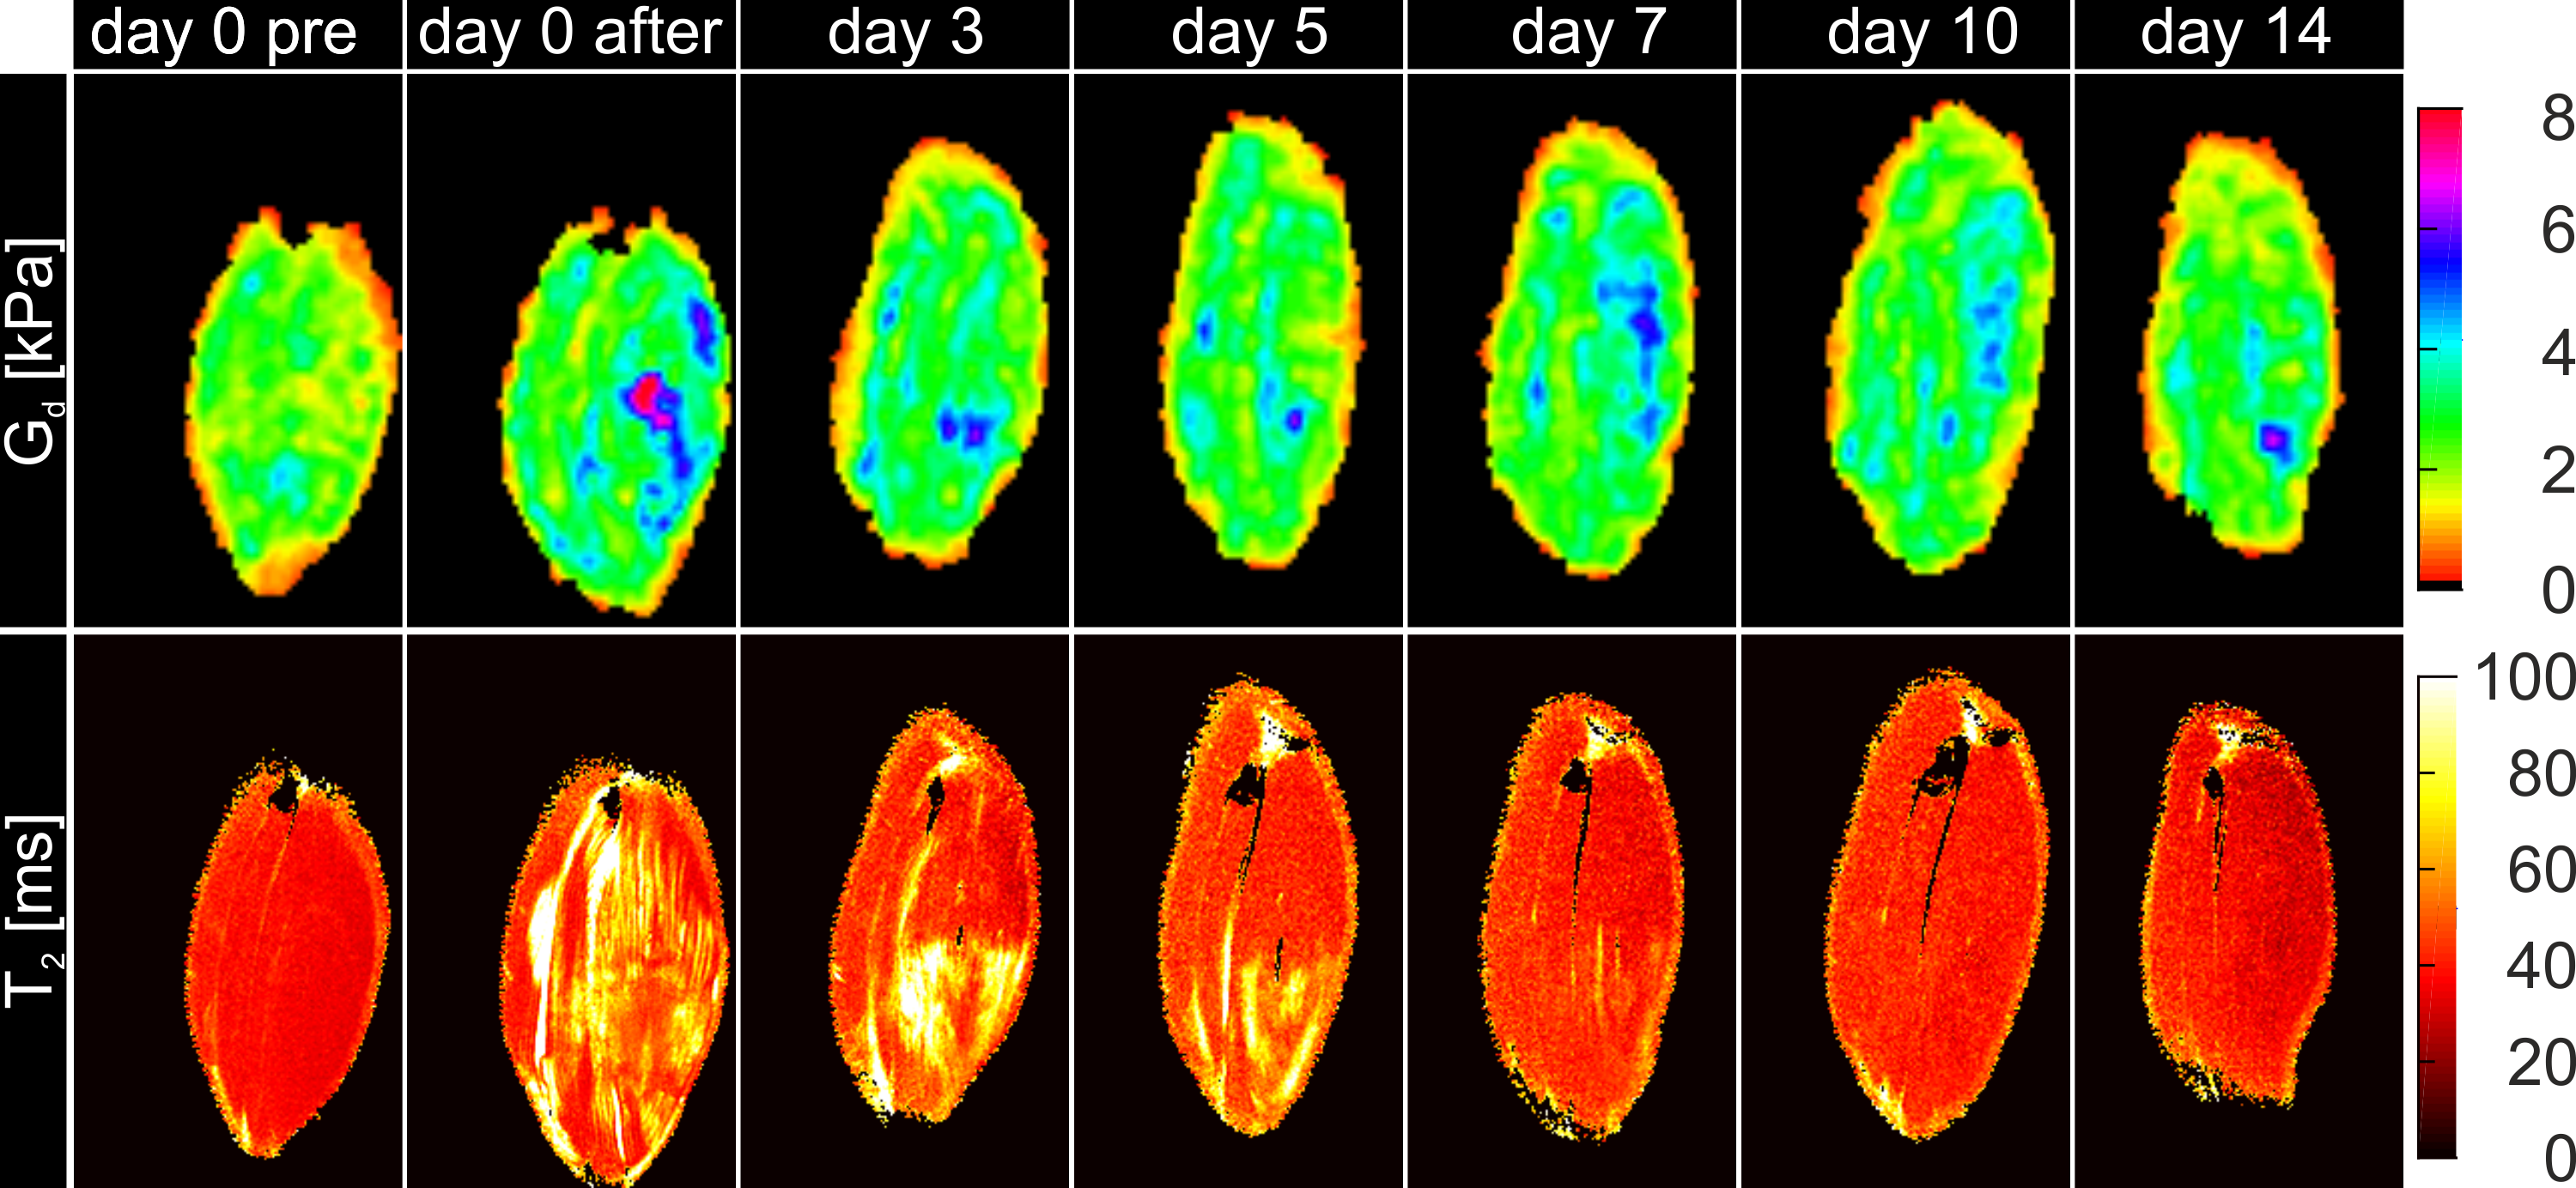
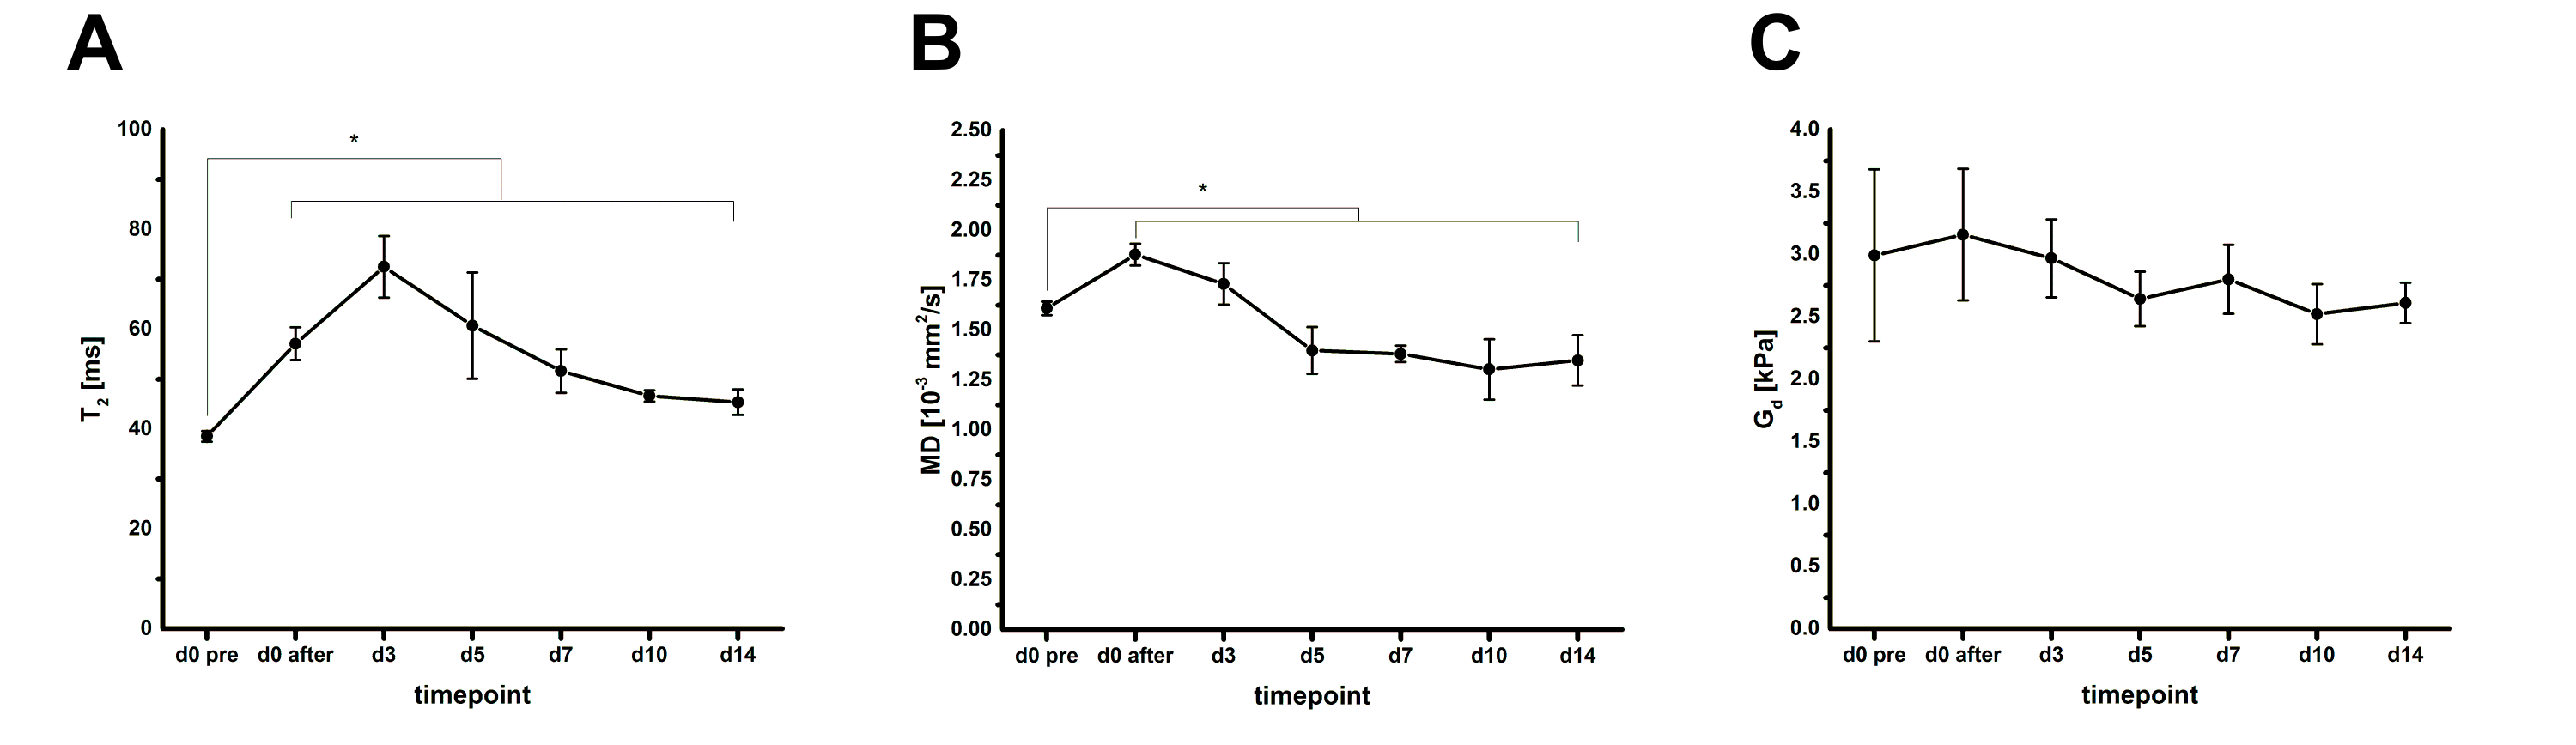
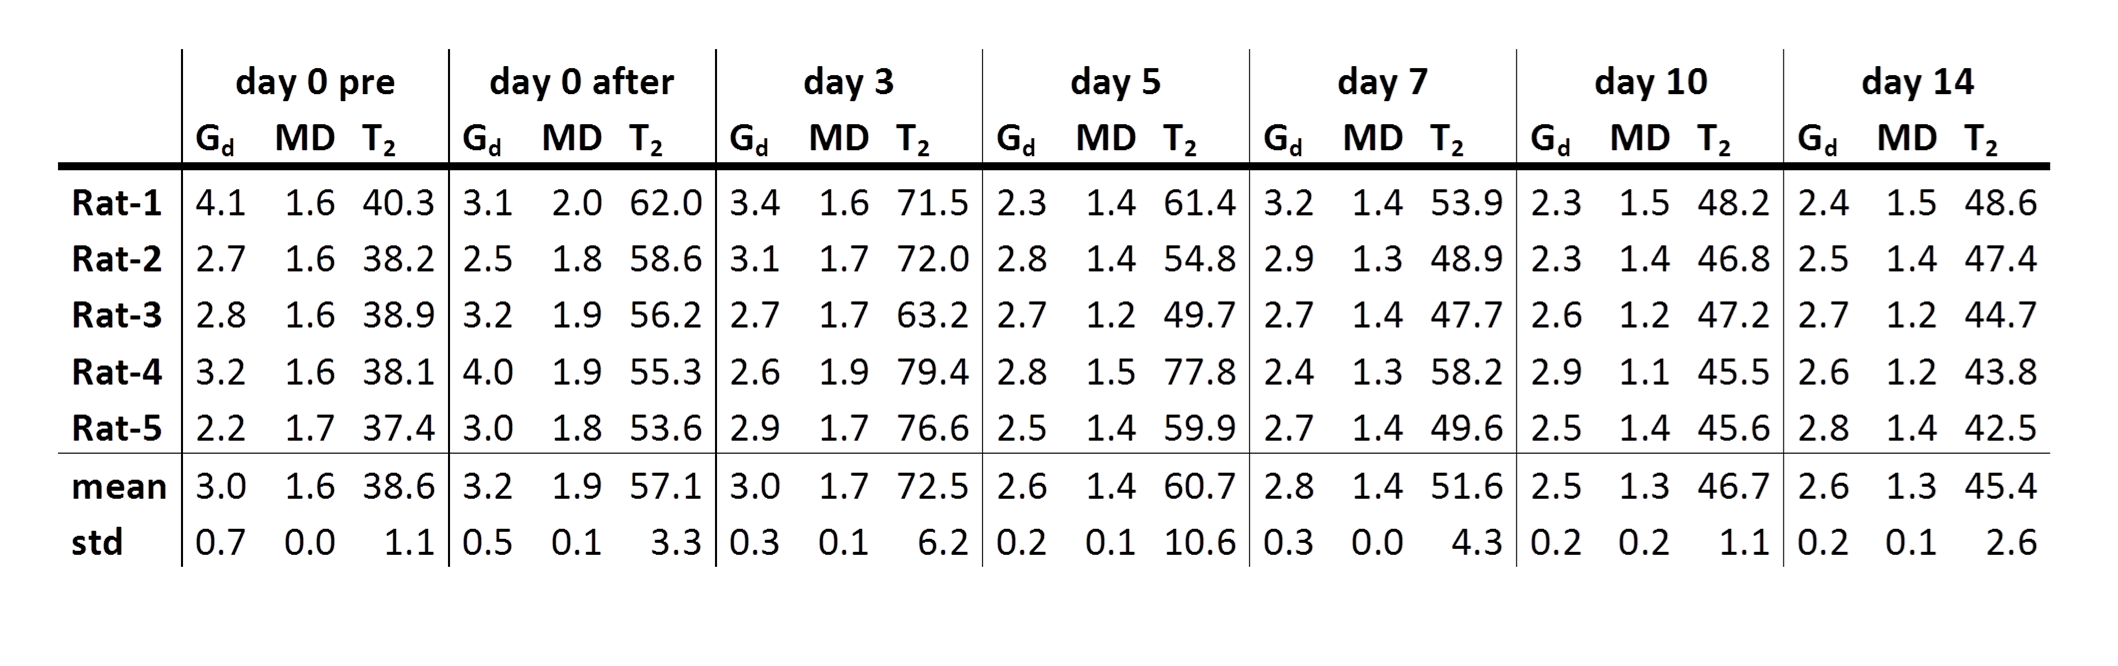
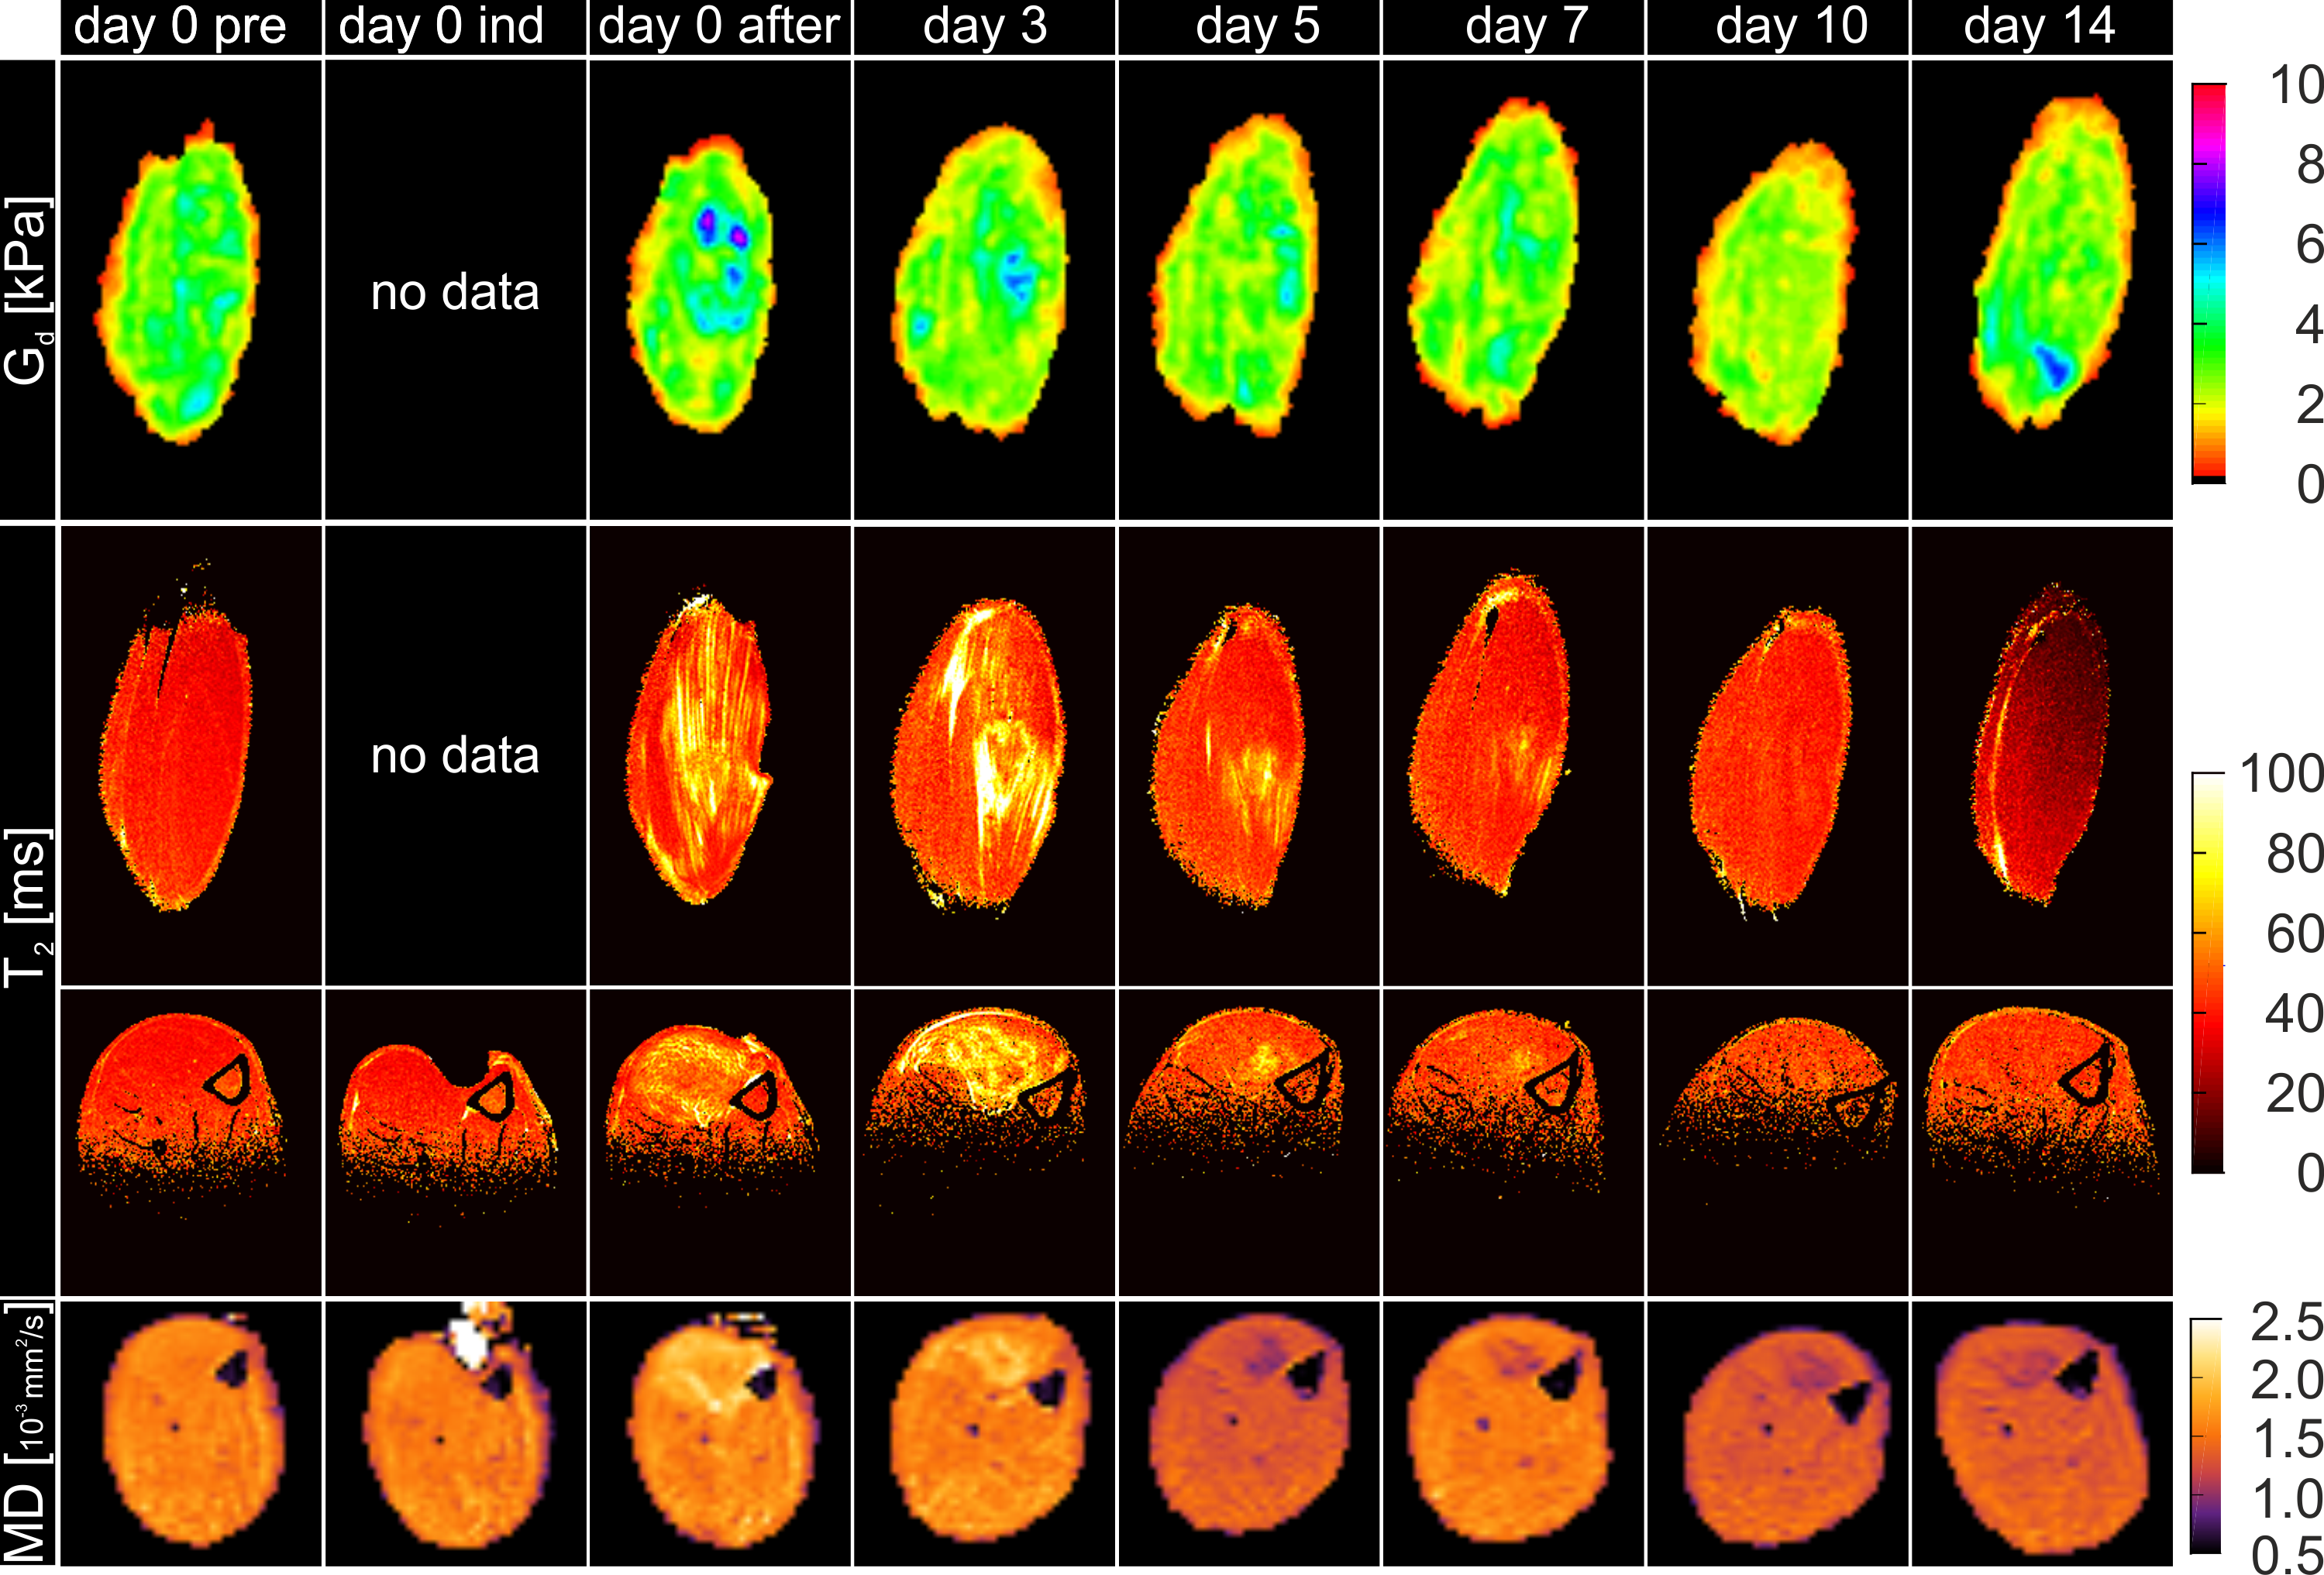
Fig.1 shows the MD and T2-maps of all time-points in axial orientation. Typical indentation of the TA is shown in the second column. Altered MD and T2-values were found after indentation. The pattern of elevated T2 at day 3 resembles a peri-endo-mysium like structure. Elevated T2 values return to normal in approximately 7 days. Directly after indentation MD was elevated but dropped below values in remote tissue after 3 days. A decrease in MD was still visible at day 14, whereas T2 had normalized at this time point. Fig.2 shows coronal Gd and T2-maps at all time points (same animal as Figure 1). Elevated T2 along the fiber direction was clearly visible at day 0 after indentation. The fiber-like pattern of T2 elevation was absent in the center of the TA at the location of indentation. This center of non-elevated T2 remained visible at day 3 and day 5. T2 almost normalized at day 7. Directly after indentation a hot spot of elevated Gd was observed at center of indentation. Multiple spots of elevated Gd were visible until 14 days after damage-inducing indentation. Together with the presence of the local hotspots, decreased Gd was observed in the TA compartement. Mean Gd, T2 and MD determined in the TA ROI are displayed in Fig.3. Both MD and T2 changed significantly with respect to baseline. Mean Gd shows a trend of decrease over time. In Fig.4 mean Gd, MD and T2 are summarized for each animal. Fig.5 shows the Gd maps, T2 maps and MD maps of another animal. MD and T2 show a similar pattern as discussed above. Gd was normalized at day 5. Hotspot at 14 days can be explained due to low SNR caused by wrong positioning of the rats’ hindleg at this time point.Conclusion and future directions
The multi-modality assessment provided differential readouts of the deformation-induced muscle injury development and regeneration process. The volume of muscle displaying quantitative changes as well as the changes over time were different for the various readouts (tissue stiffness, MD, and T2), demonstrating that these parameters provide different and potentially complementary information on the extent and temporal evolution of muscle injury. We are currently in the process of performing histology at the various time-points to establish a microstructural basis for the observed differences.Acknowledgements
This research was supported by the Dutch Technology Foundation STW (NWO) and COST BM1304 MYOMRI action.References
1. Nelissen Jules L., Nederveen Aart J., Sinkus Ralph, Nicolay Klaas, Strijkers GJ. Magnetic resonance elastography characterization of skeletal muscle stiffness changes resulting from pressure ulcers. Proc Intl Soc Mag Reson Med. 2016;24: 178.
2. Sinkus R, Lorenzen J, Schrader D, Lorenzen M, Dargatz M, Holz D. High-resolution tensor MR elastography for breast tumour detection. Phys Med Biol. 2000/06/28. 2000;45: 1649–64.
3. Sinkus R, Tanter M, Xydeas T, Catheline S, Bercoff J, Fink M. Viscoelastic shear properties of in vivo breast lesions measured by MR elastography. Magn Reson Imaging. 2005;23: 159–165. doi:10.1016/j.mri.2004.11.060
4. Froeling M. DTITools. Zenodo. 2016; doi:10.5281/zenodo.54685
Figures