0646
Anterior Tibial Translation Following ACL Reconstruction is Associated with Postsurgical Cartilage Matrix Changes.1University of California, Berkeley, Berkeley, CA, United States, 2University of California, San Francisco, San Francisco, CA, United States
Synopsis
Biomechanical abnormalities and accelerated cartilage matrix changes are commonly seen following ACL injury; however, the association between the two remains unclear. The purpose of this study was to analyze the relationship between altered joint kinematics and long term cartilage health. Utilizing voxel based relaxometry with T1p and T2 mapping sequences, in conjuction with MRI kinematics of the tibia and femur bone, allowed for the assessment of local cartilage matrix changes 2 years following ACL reconstruction. Notably, anterior translation of the tibia in the injured knee was associated with greater cartilage degeneration in the medial femoral and tibial cartilage.
Introduction
Anterior
cruciate ligament (ACL) injuries are one of the most common sports injuries.
While surgical reconstruction can successfully restore knee joint stability,
biomechanical abnormalities can persist.1-4 The capacity to use MR
imaging to track the aberrant joint kinematics has been demonstrated in
previous studies,5,6 while quantitative MR, specifically voxel based
relaxometry (VBR) with T1ρ and T2 mapping sequences, has been shown to
successfully monitor local degeneration of knee cartilage;7,8 however, the relationship between these two have not been studied
extensively at longer follow-ups. The goal of this study was to analyze the
postsurgical relationship between MRI joint kinematics and longitudinal
cartilage matrix health over 2 years.
Method
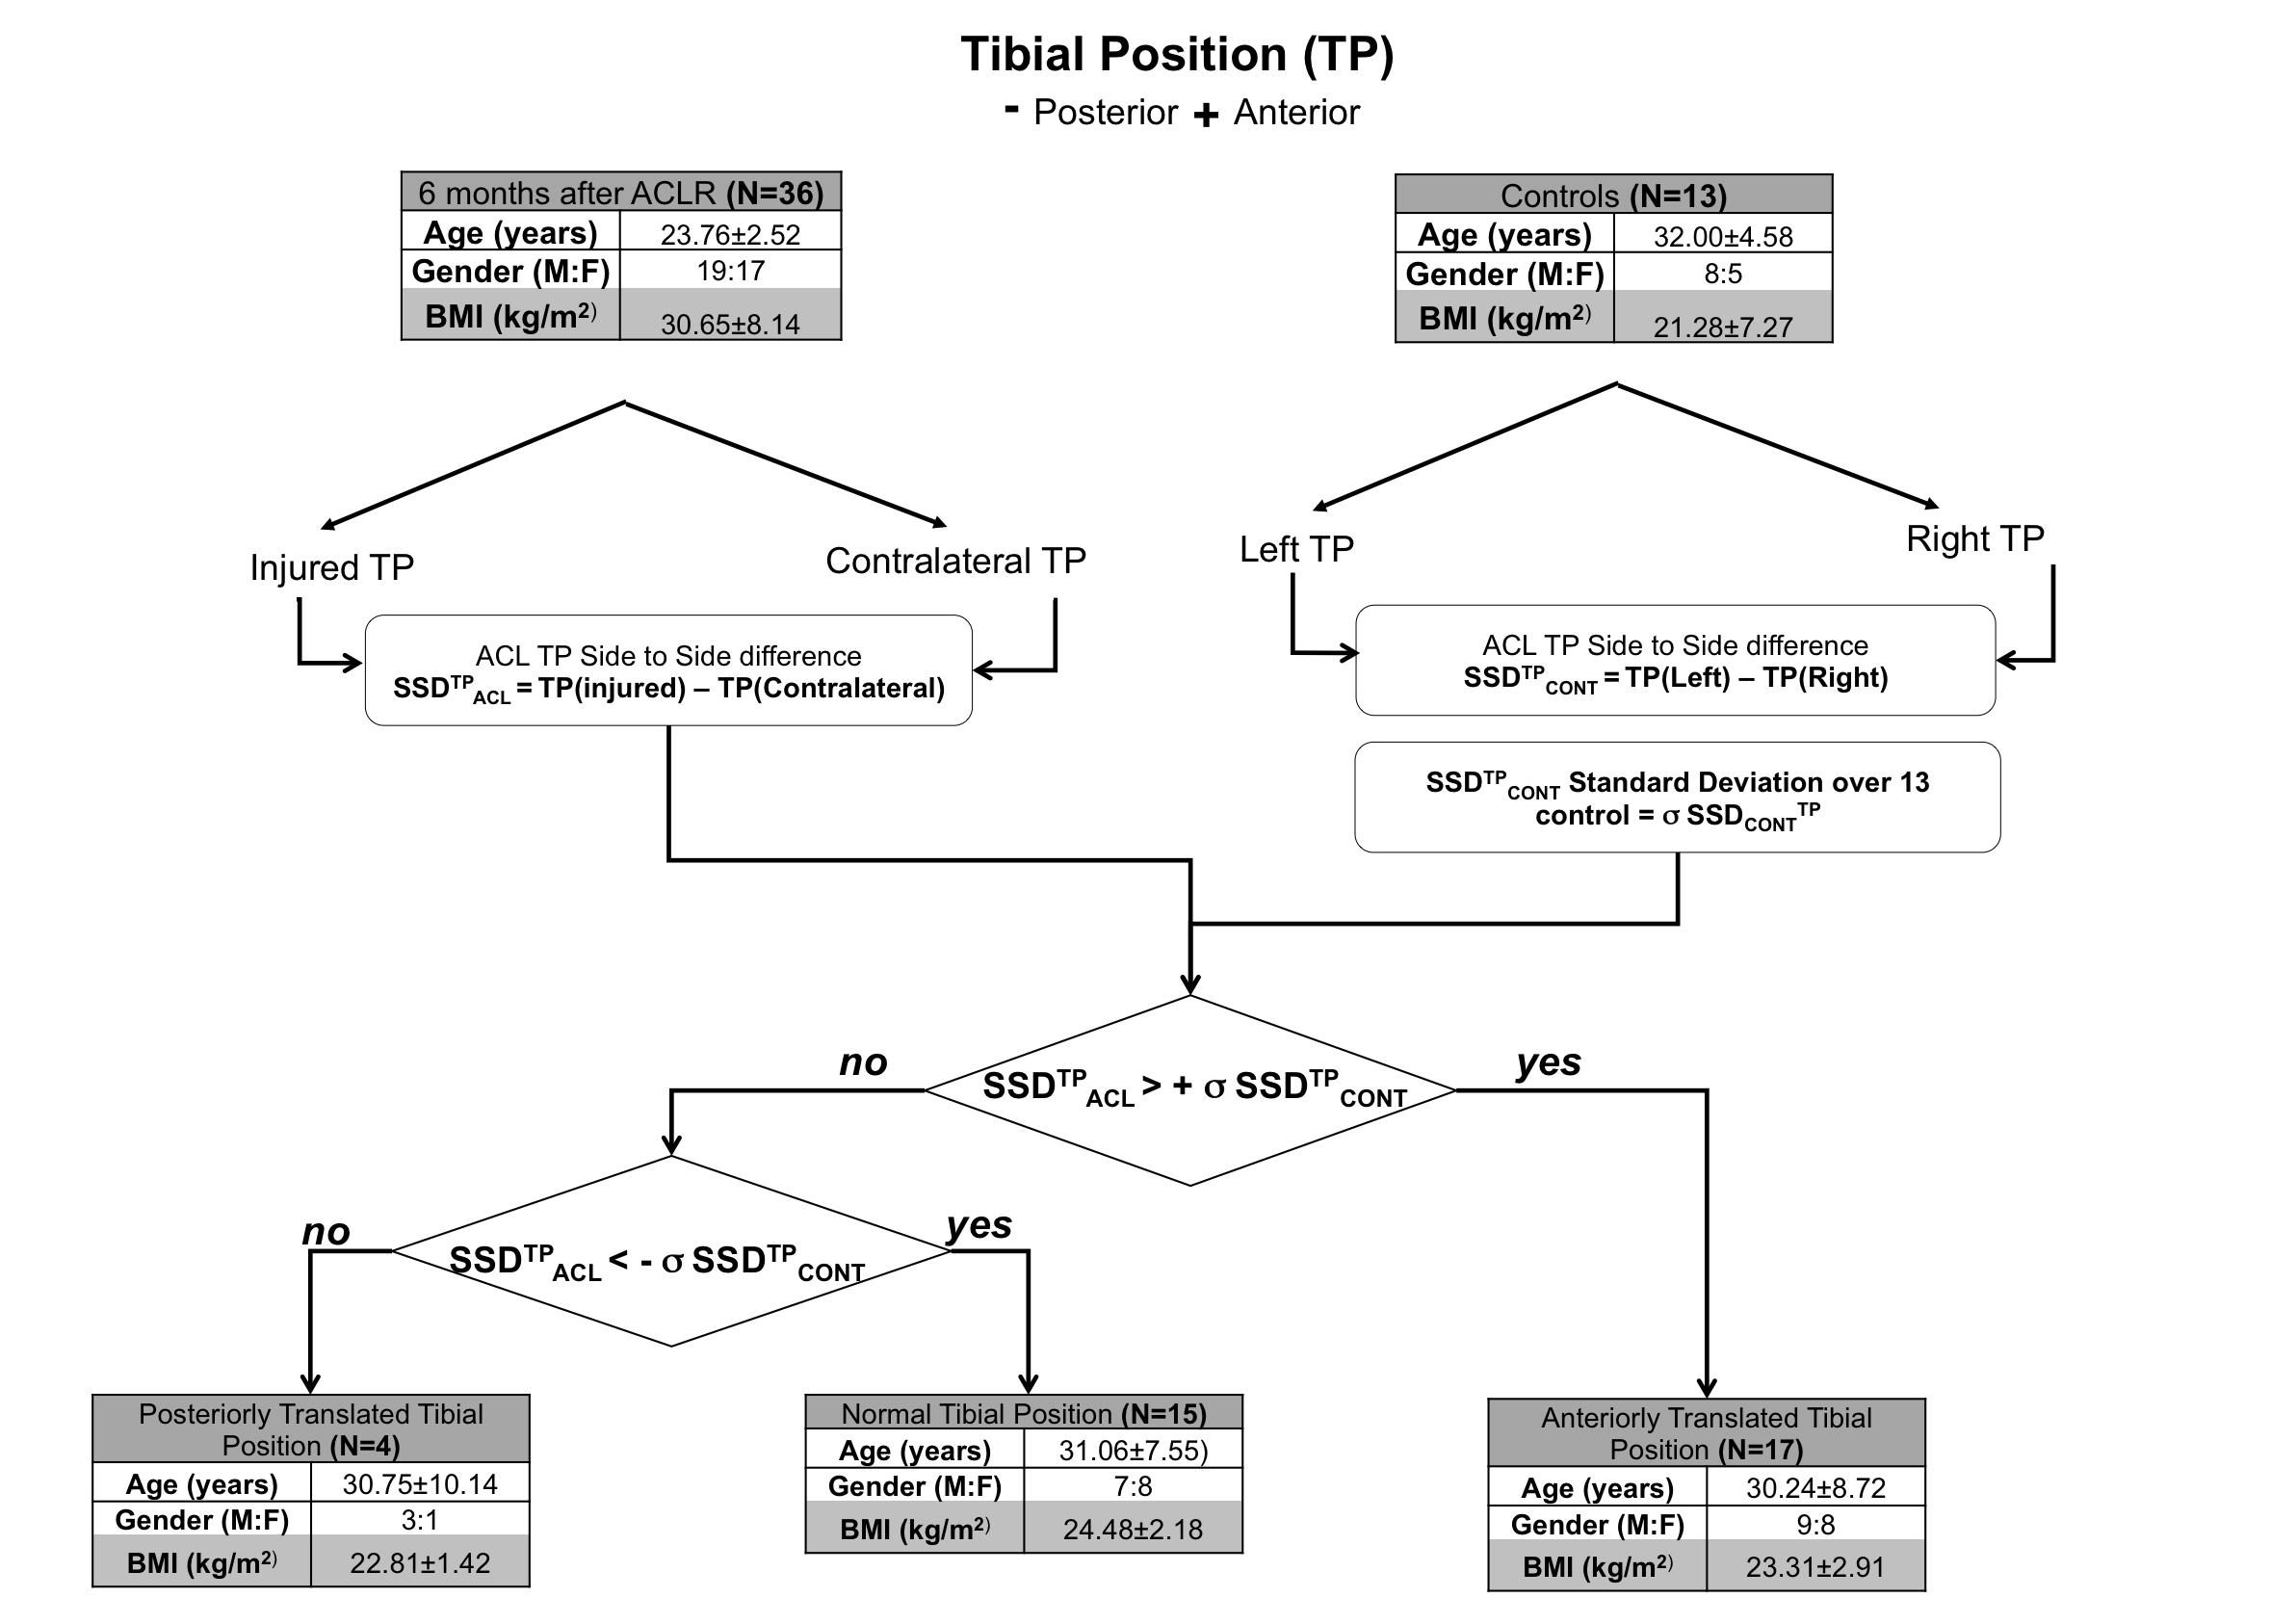
Subjects: 36 patients with no previous history of knee trauma or disease were evaluated after sustaining acute unilateral ACL tears(baseline), as well as at 6-month (6M), 1-year (1Y) and 2-year (2Y) follow-ups. 13 healthy control subjects with no history of injury or surgery were also evaluated at baseline (BL), 1Y and 3-year (3Y). MRI Protocol: Bilateral knee scans were acquired using a 3 Tesla Scanner (GE Healthcare) with an 8-channel phased array knee coil (Invivo). The MRI Protocol included 3 main sequences (Table 1). Modified WORMS were used for evaluating cartilage and meniscal injury at baseline and 2Y.10 Voxel Based Relaxometry: VBR was performed as previously described10 by non-rigidly registering the T1ρ/T2- weighted images of all other subjects onto the reference using in-house software. Cartilage segmentations of the reference were applied onto the registered images to ensure comparison of the same anatomical regions. T1ρ and T2 maps were obtained by monoexponentially fitting the morphed images with different TSLs. MRI kinematics: Femur and tibia segmentation was performed semi-automatically to establish a tibial and femoral coordinate system and define the tibial position (TP) with respect to the femur in the extended knee position as described in previous studies.5,6 Statistical Analysis: The standard deviation (SD) of the side to side difference (SSD) in TP, defined as left minus right, was computed for the controls at all time points and used to classify the patients into three groups based on patient SSD in TP at 6M: normal TP, anterior TP (‘loose’ knee), and posterior TP (‘over-tight’ knee)(Figure 1). Voxel based ANCOVA adjusted for age, gender, and BMI compared the difference in T1ρ and T2 of the injured side at 2Y between groups. Significance was defined as p<0.05. Random Field theory was used to adjust for multiple comparisons.Results
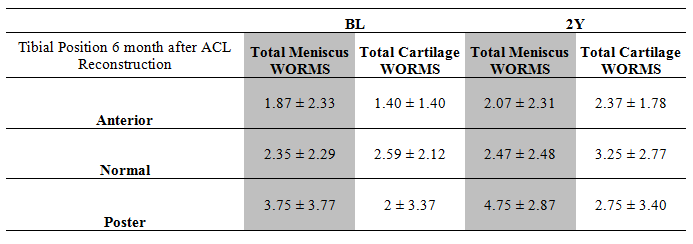
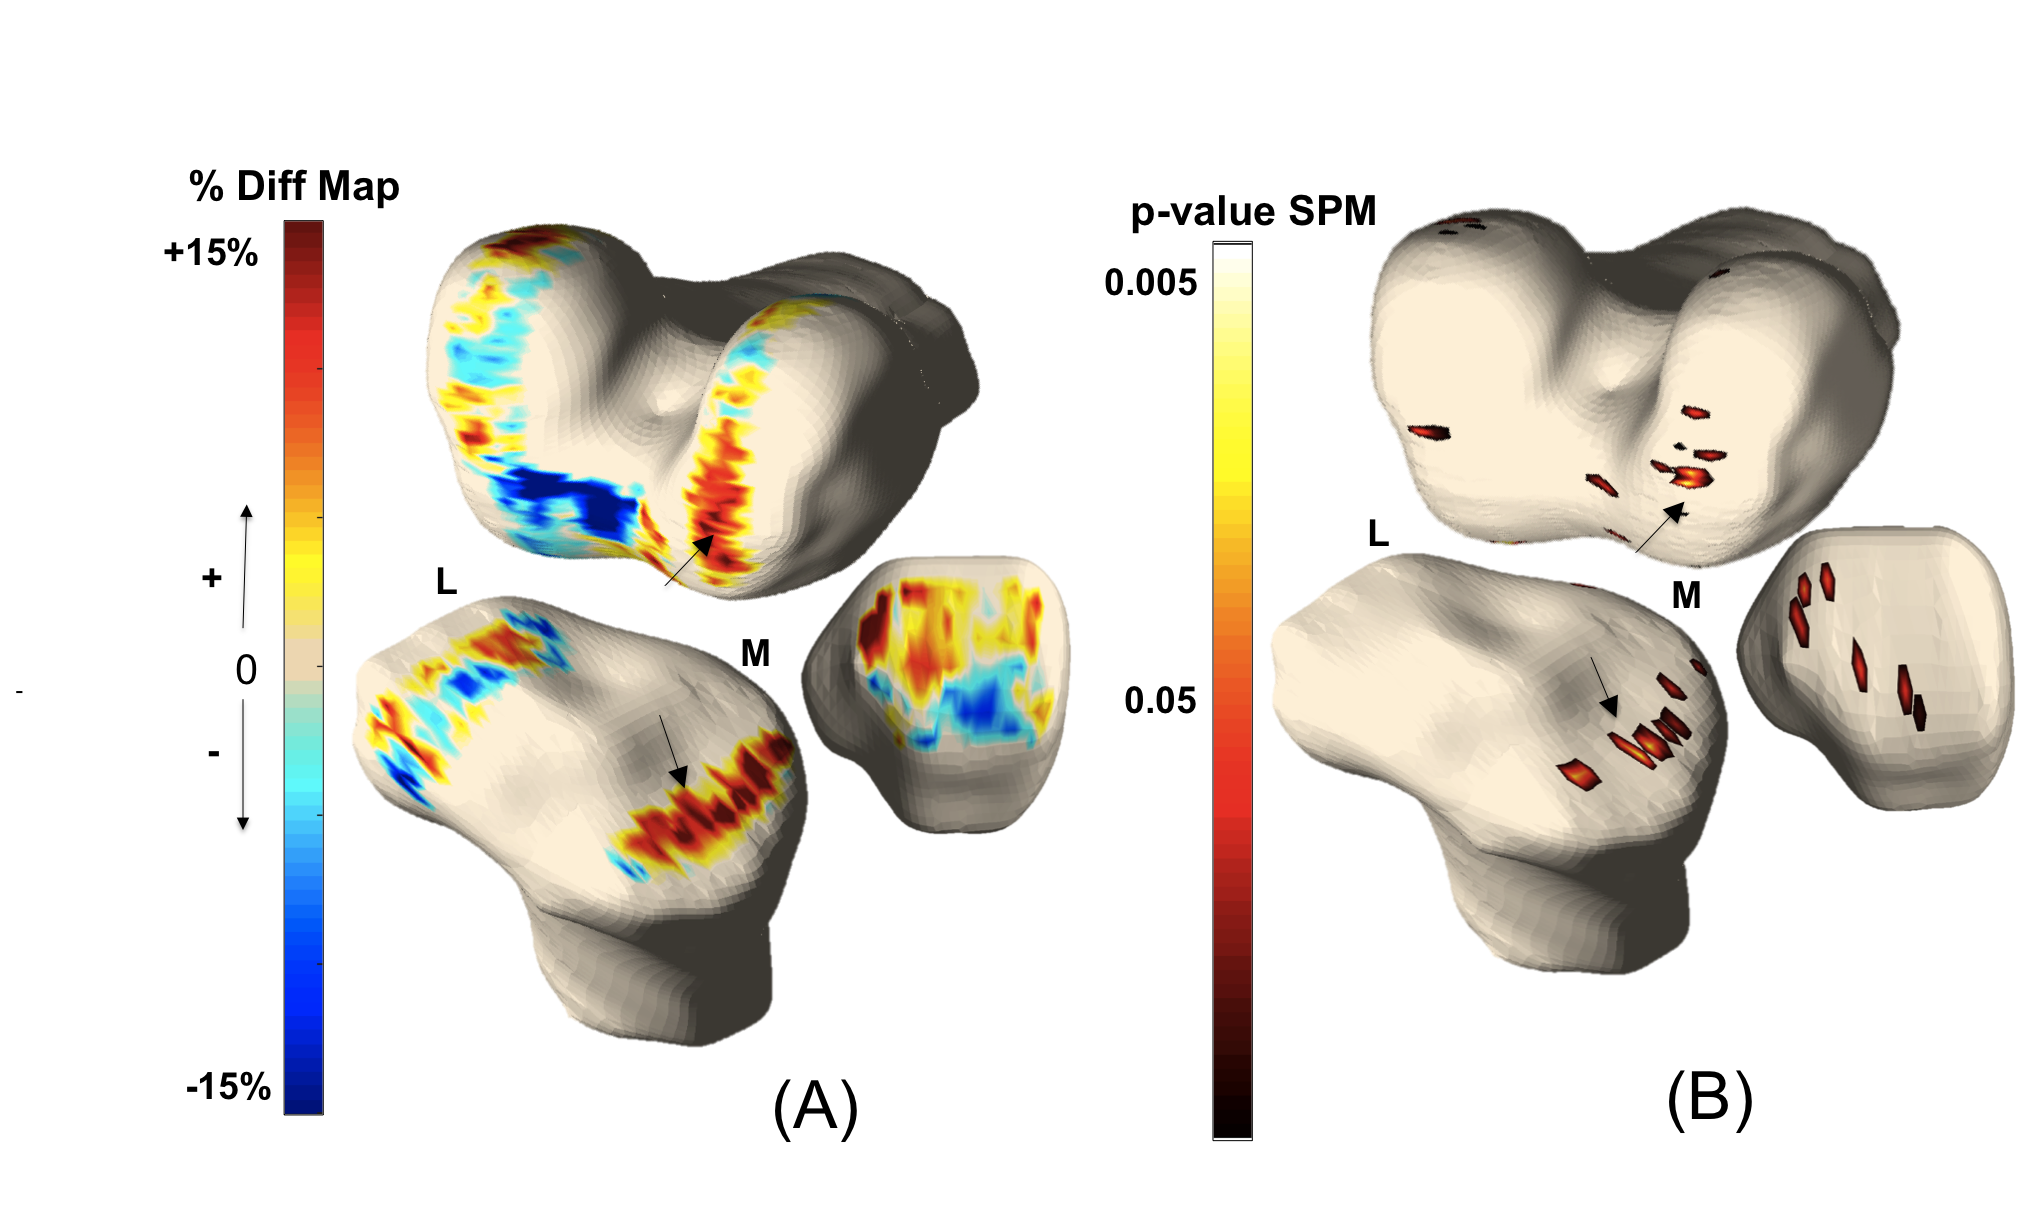
The SD of the SSD in TP for controls was 1.36mm; 15, 17 and 4 patients were classified as having normal TP, anterior TP and posterior TP at 6M, respectively(Figure 1). There were no significant differences in demographics and WORMS (at BL or 2Y) between groups (Table 2). Using VBR, compared to normal patients, patients with anterior TP at 6M displayed significantly prolonged 2Y T1p and T2 relaxation times in 17% and 12.7% of the injured medial tibia (MT), 5.9% and 3.36% of the injured medial femoral condyle (MFC) respectively; the average percent difference in the significant voxels was T1p and T2 was 22.9% and 21.7% in the MT and 17% and 19.7% in the MFC.(Figure 2 and 3).Discussion
Prolonged 2Y T1ρ and T2 relaxation times in patients with more anterior TP compared to patients with normal TP, consistent with observations in previous studies using region-of-interest based methods at 1Y follow-up,5,6 demonstrates the quantitative evidence of association between joint laxity and long term cartilage matrix health. The lack of difference in T1ρ or T2 between patients with more posterior TP and normal TP may be due to the small number of subjects with posterior TP. Using VBR, the association between TP and cartilage T1ρ or T2 was shown to be located primarily in the medial side, suggesting the medial side may be the primary side sustaining abnormal loading with altered joint kinematics after surgery. Interestingly, VBR also revealed decreased T1ρ and T2 in trochlea cartilage of patients with anterior TP compared to those with normal TP. This decrease was not significant, however, suggesting large SD of cartilage T1ρ and T2 changes in this region within this patient subgroup. Further analysis will be performed to identify potential subgroups of patients.
Conclusion
This study demonstrates how alterations in knee kinematics, like TP, following ACL reconstruction can lead to accelerated cartilage degeneration. The ability to use quantitative MRI to monitor the abnormal biomechanics of the knee and cartilage matrix changes will provide novel markers for identifying patients with high risk of developing post-traumatic osteoarthritis and provide valuable insight on the disease's development mechanism.Acknowledgements
This study is funded by the NIH/NIAMS P50 AR060752 and AOSSM Cartilage Initiative.References
1.Carpenter RD, Majumdar S, Ma CB. Magnetic resonance imaging of 3-dimensional in vivo tibiofemoral kinematics in anterior cruciate ligament-reconstructed knees. Arthroscopy. 2009;25(7):760–766.
2. Hoshino Y, Fu F, Irrgang J, et al. Can Joint Contact Dynamics Be Restored by Anterior Cruciate Ligament Reconstruction? Clinical Orthopaedics and Related Research. 2013;471(9):2924–2931.
3. Kothari A, Haughom B, Subburaj K, et al. Evaluating rotational kinematics of the knee in ACL reconstructed patients using 3.0 Tesla magnetic resonance imaging. Knee. 2012;19(5):648–651,
4. Oberländer KD, Brüggemann GP, Höher J, et al. Knee mechanics during landing in anterior cruciate ligament patients: a longitudinal study from pre- to 12 months post-reconstruction. Clinical Biomechics (Bristol, Avon). 2014;29:512–517
5. Amano K, Pedoia V, Su F, et al. Persistent Biomechanical Alterations After ACL Reconstruction Are Associated With Early Cartilage Matrix Changes Detected by Quantitative MR. Orthopaedic Journal of Sports Medicine. 2016;4(4).
6. Zaid M, Landsdon D, Su F, et al. Abnormal tibial position is correlated to early degenerative changes one year following ACL reconstruction. Journal of Orthopaedic Research. 2015; 33(7):1079– 1086
7. Russell C, Pedoia V, Amano K, et al. Baseline cartilage quality is associated with voxel-based T1ρ and T2 following ACL reconstruction: A multicenter pilot study. Journal of Orthopaedic Research. 2016.
8. Pedoia V,
Li X, Su F, et al. Fully automatic analysis of the knee articular cartilage T1ρ relaxation time using voxel-based relaxometry. Journal of Magnetic Resonance Imaging, 2016;
43(4):970-980.
9. Peterfy CG, Guermazi A, Zaim S, et al. Whole-Organ Magnetic Resonance Imaging Score (WORMS) of the knee in osteoarthritis. Osteoarthritis Cartilage 2004;12(3):177-190.
Figures