0634
Automated Left Ventricular Volumetric Quantitation from Short-axis CMR Images with Machine Learning using a Deep Convolutional Neural Network1St Francis Hospital, Roslyn, NY, United States, 2DWS Systems, Hoek van Holland, Netherlands
Synopsis
Automatic segmentation of the LV bloodpool using deep learning with a convolutional neural network is a promising, accurate and efficient method for segmentation of cardiac MR images. Although there were a few cases with inaccurate results, "big fails", accuracy is high, R2=0.93 and ejection fraction error ~4%. In the future it may provide a customizable, fast and accurate method for comprehensive evaluation of cardiac MR images.
Purpose:
The 2015 Data Science Bowl challenge was to create an algorithm that automatically measures end-systolic and end-diastolic volumes in cardiac MRIs. 1140 patient exams of balanced steady-state free precession, 700 with expert analysis of left ventricular (LV) end-diastolic and end-systolic volumes were provided. We report the algorithm and results of the third place finalist.Methods:
Publically available images from the Second Annual Data Science Bowl (https://www.kaggle.com/c/second-annual-data-science-bowl) from 1140 subjects were used in this study. Each subject had bSSFP-CINE image folders labelled as horizontal long axis (4ch), vertical long axis (2ch) and parallel short axis (sax). Data in this study are well known to be challenging and not filtered, including mislabeled and poor quality images. The “push-button” automated algorithm utilized only short axis images and consisted of three steps: 1) Image preprocessing 2) LV bloodpool segmentation and 3) Calibration.
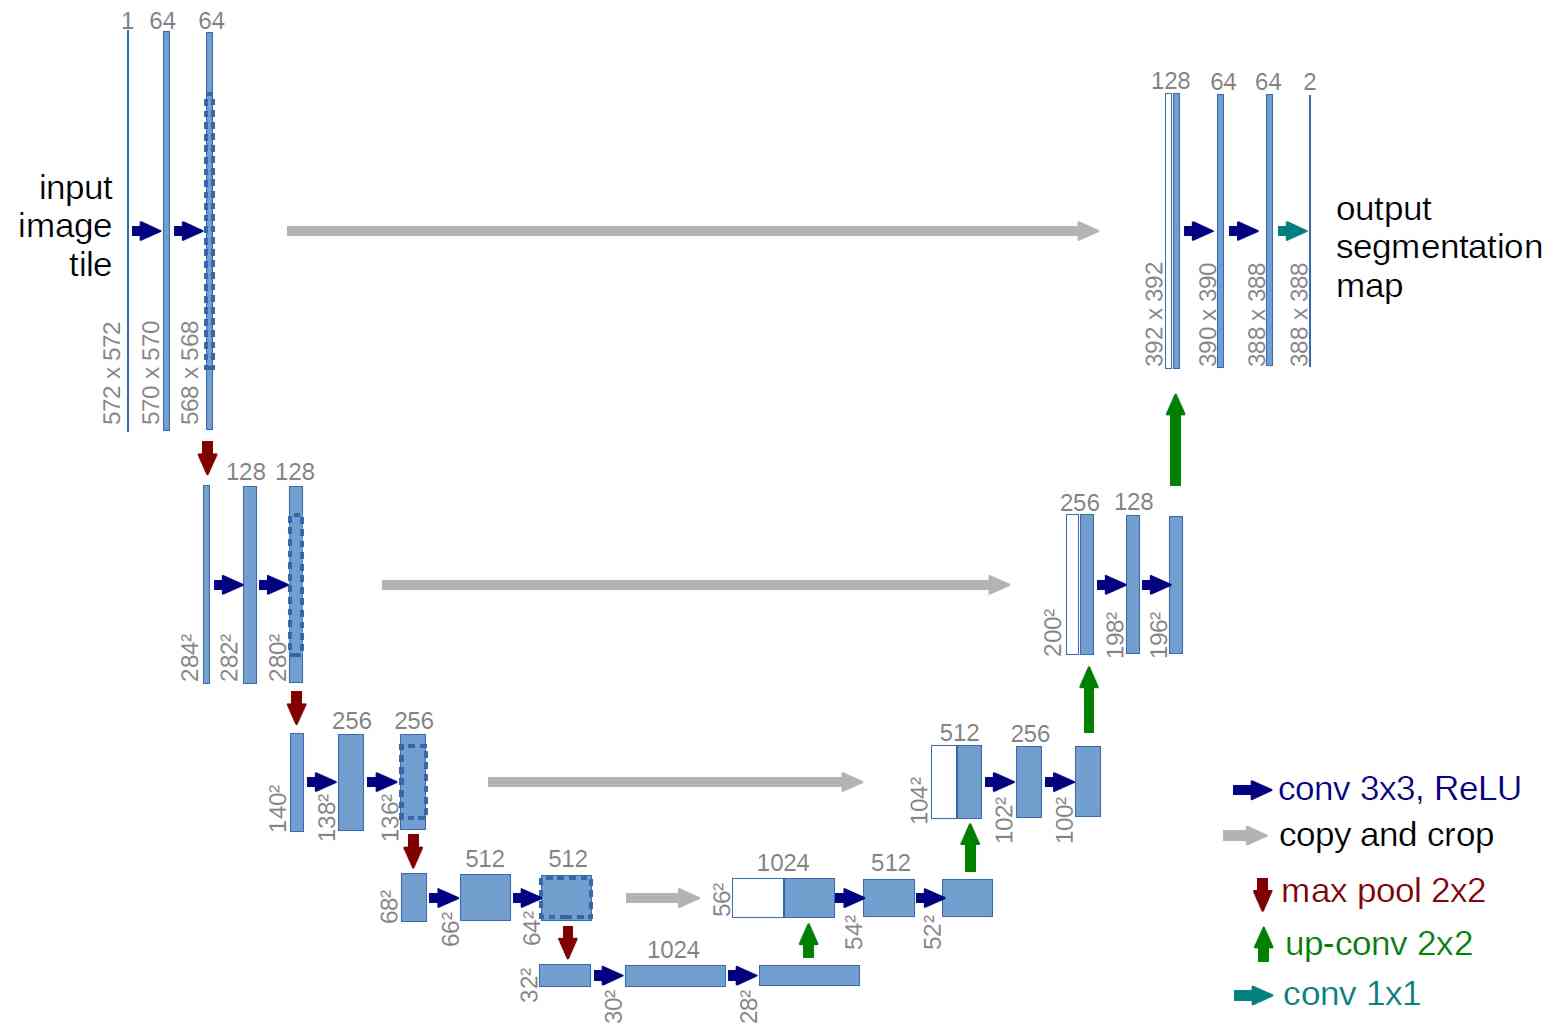
Algorithm: Step 1: Image preprocessing with interpolation to uniform pixel sizes, image cropping and adjustment of image intensities to enhance contrast using the CLAHE (Contrast Limited Adaptive Histogram Equalization) method. The LV bloodpool for training was manually segmented by a single individual in ~2000 images. Step 2: Automatic LV bloodpool segmentation was performed using a deep convolutional neural network [1]. The network consists of a contracting path (left side) and an expansive path (right side). On the left side of Figure 1, the input is the MRI image and the result on the right side is segmentation consisting of foreground (LV bloodpool) and background. The algorithm was implemented in python with the mxnet library (http://mxnet.readthedocs.io/). LV bloodpool volumes were calculated from segmented images. End-diastolic and end-systolic volumes were found from the minimum and maximum volumes. Step 3: The final step was calibration or regression using available demographic data of the calculated bloodpool volumes to provided expert volumes. This step removed biases resulting from manual segmentation of training data and the automatic segmentation process. Training and validation expert volumes were provided at the competition start. Final competition volumes were provided after the end of the competition.
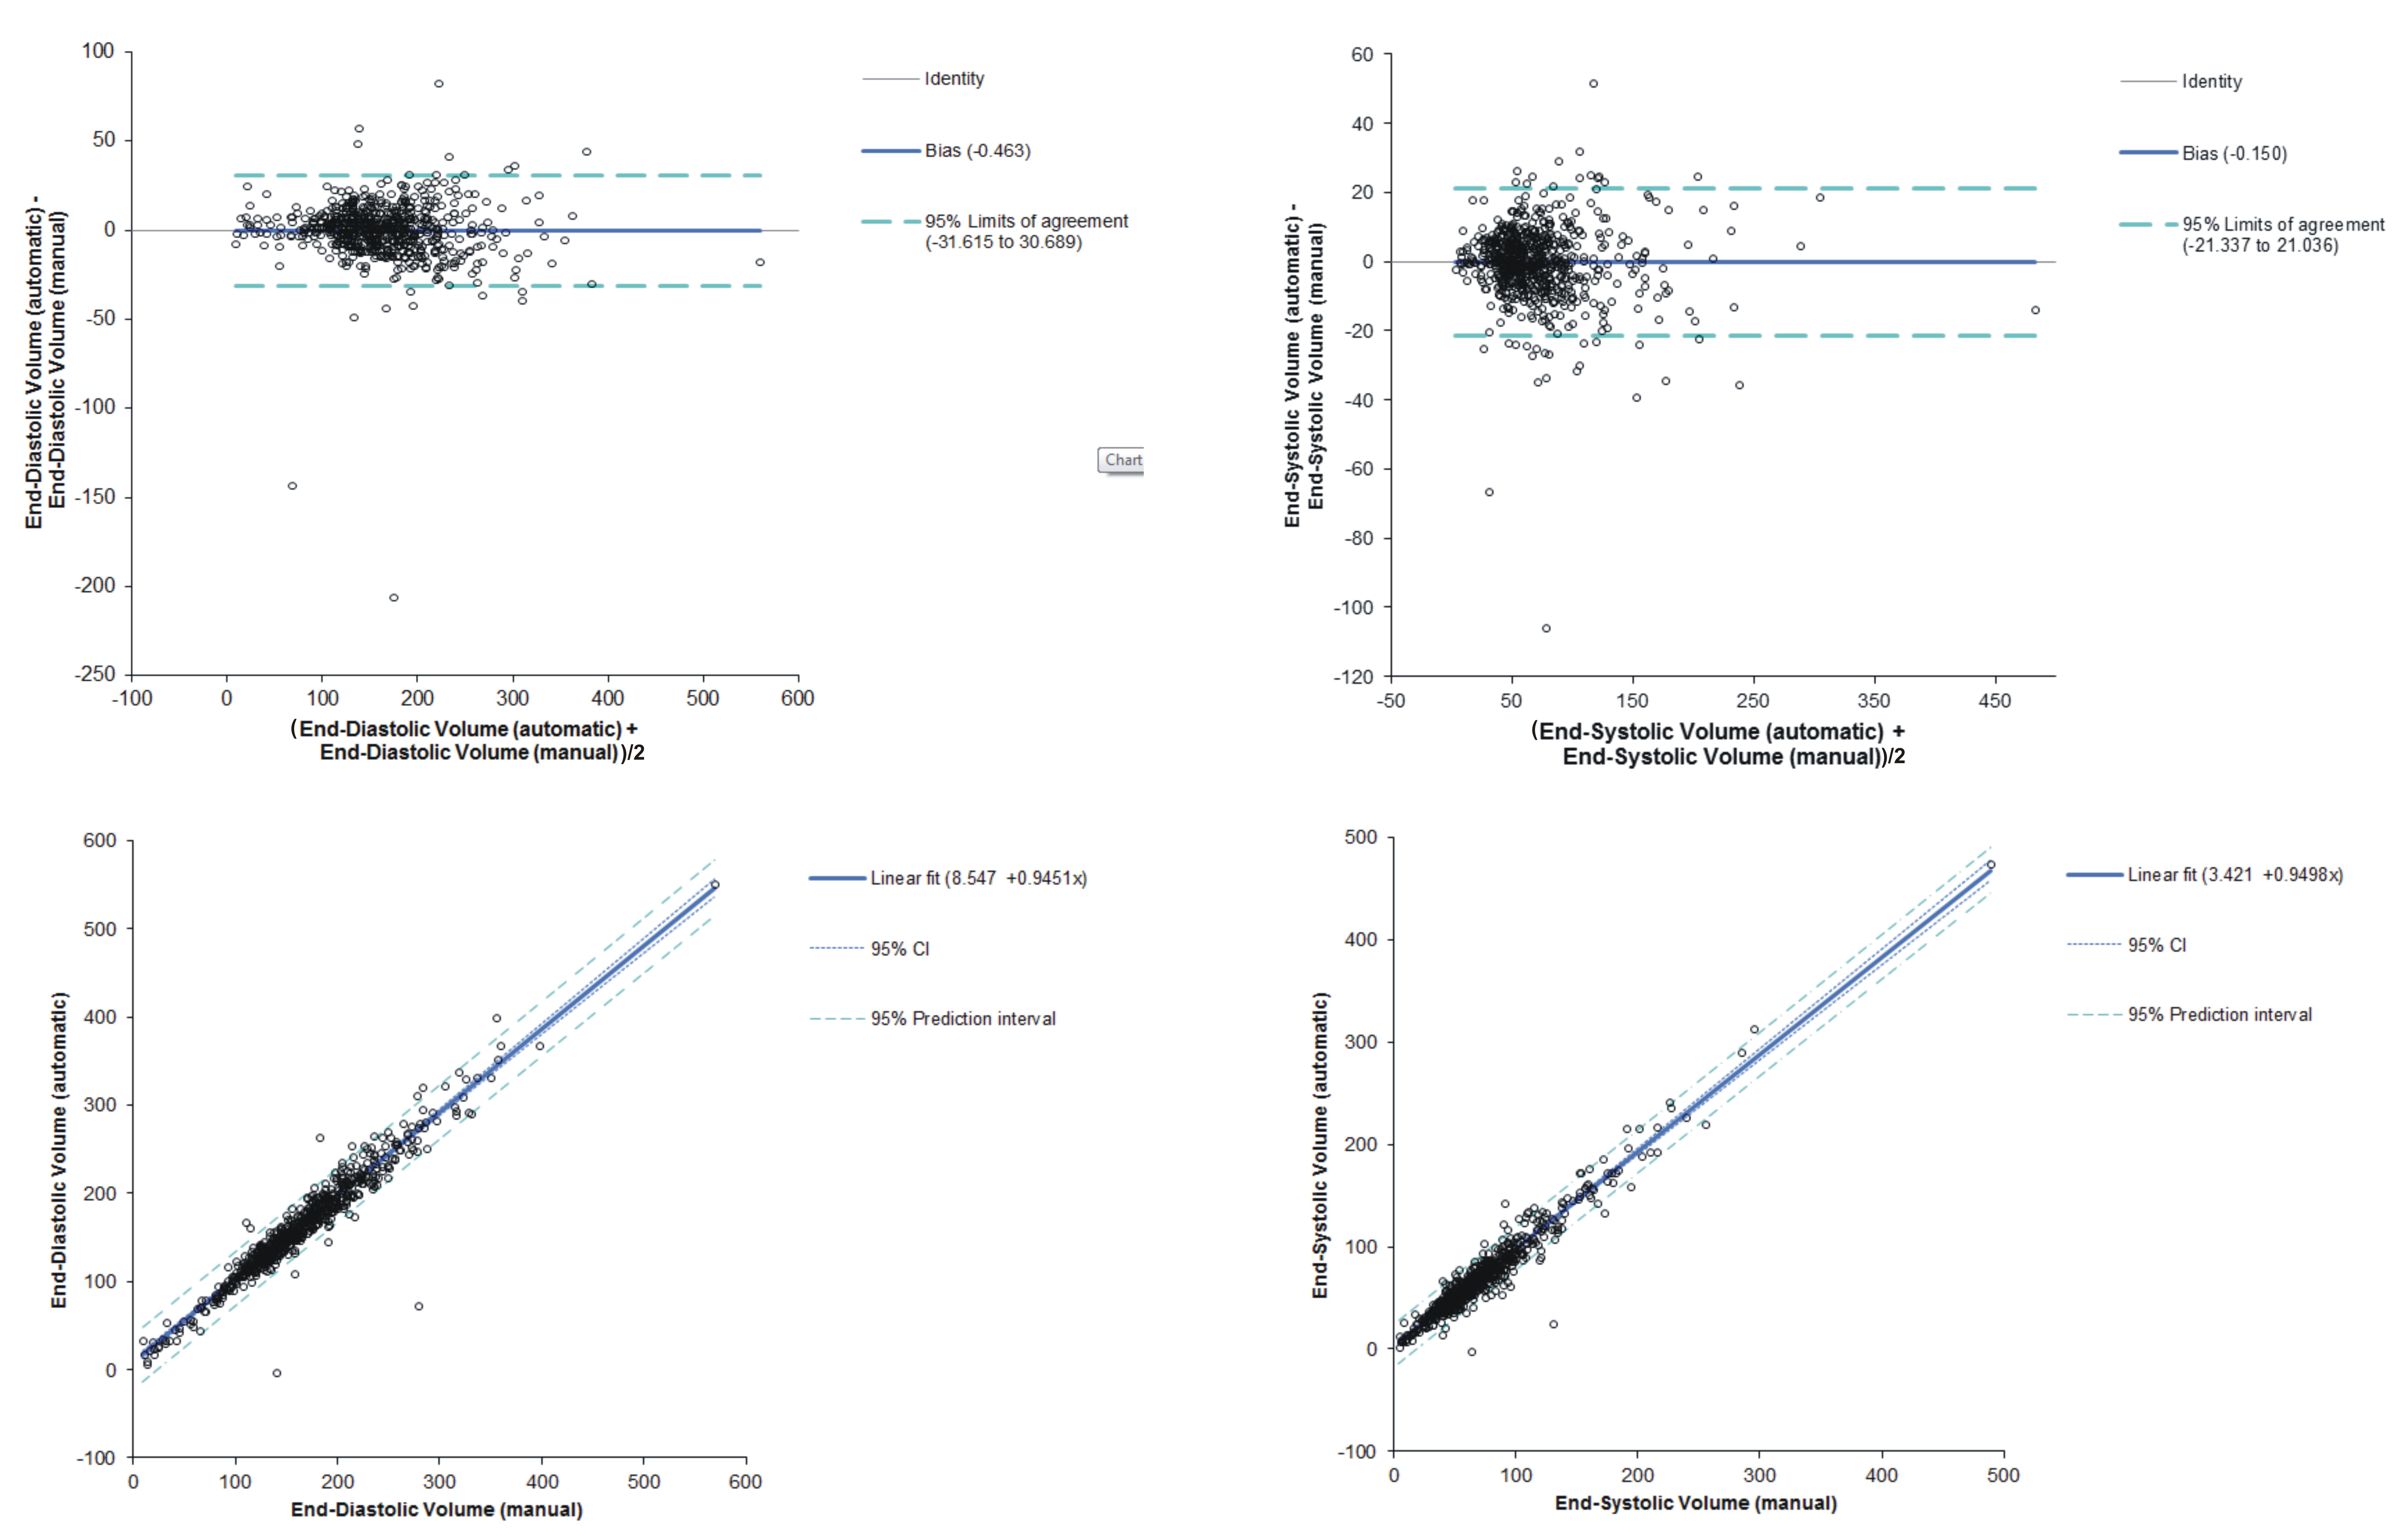
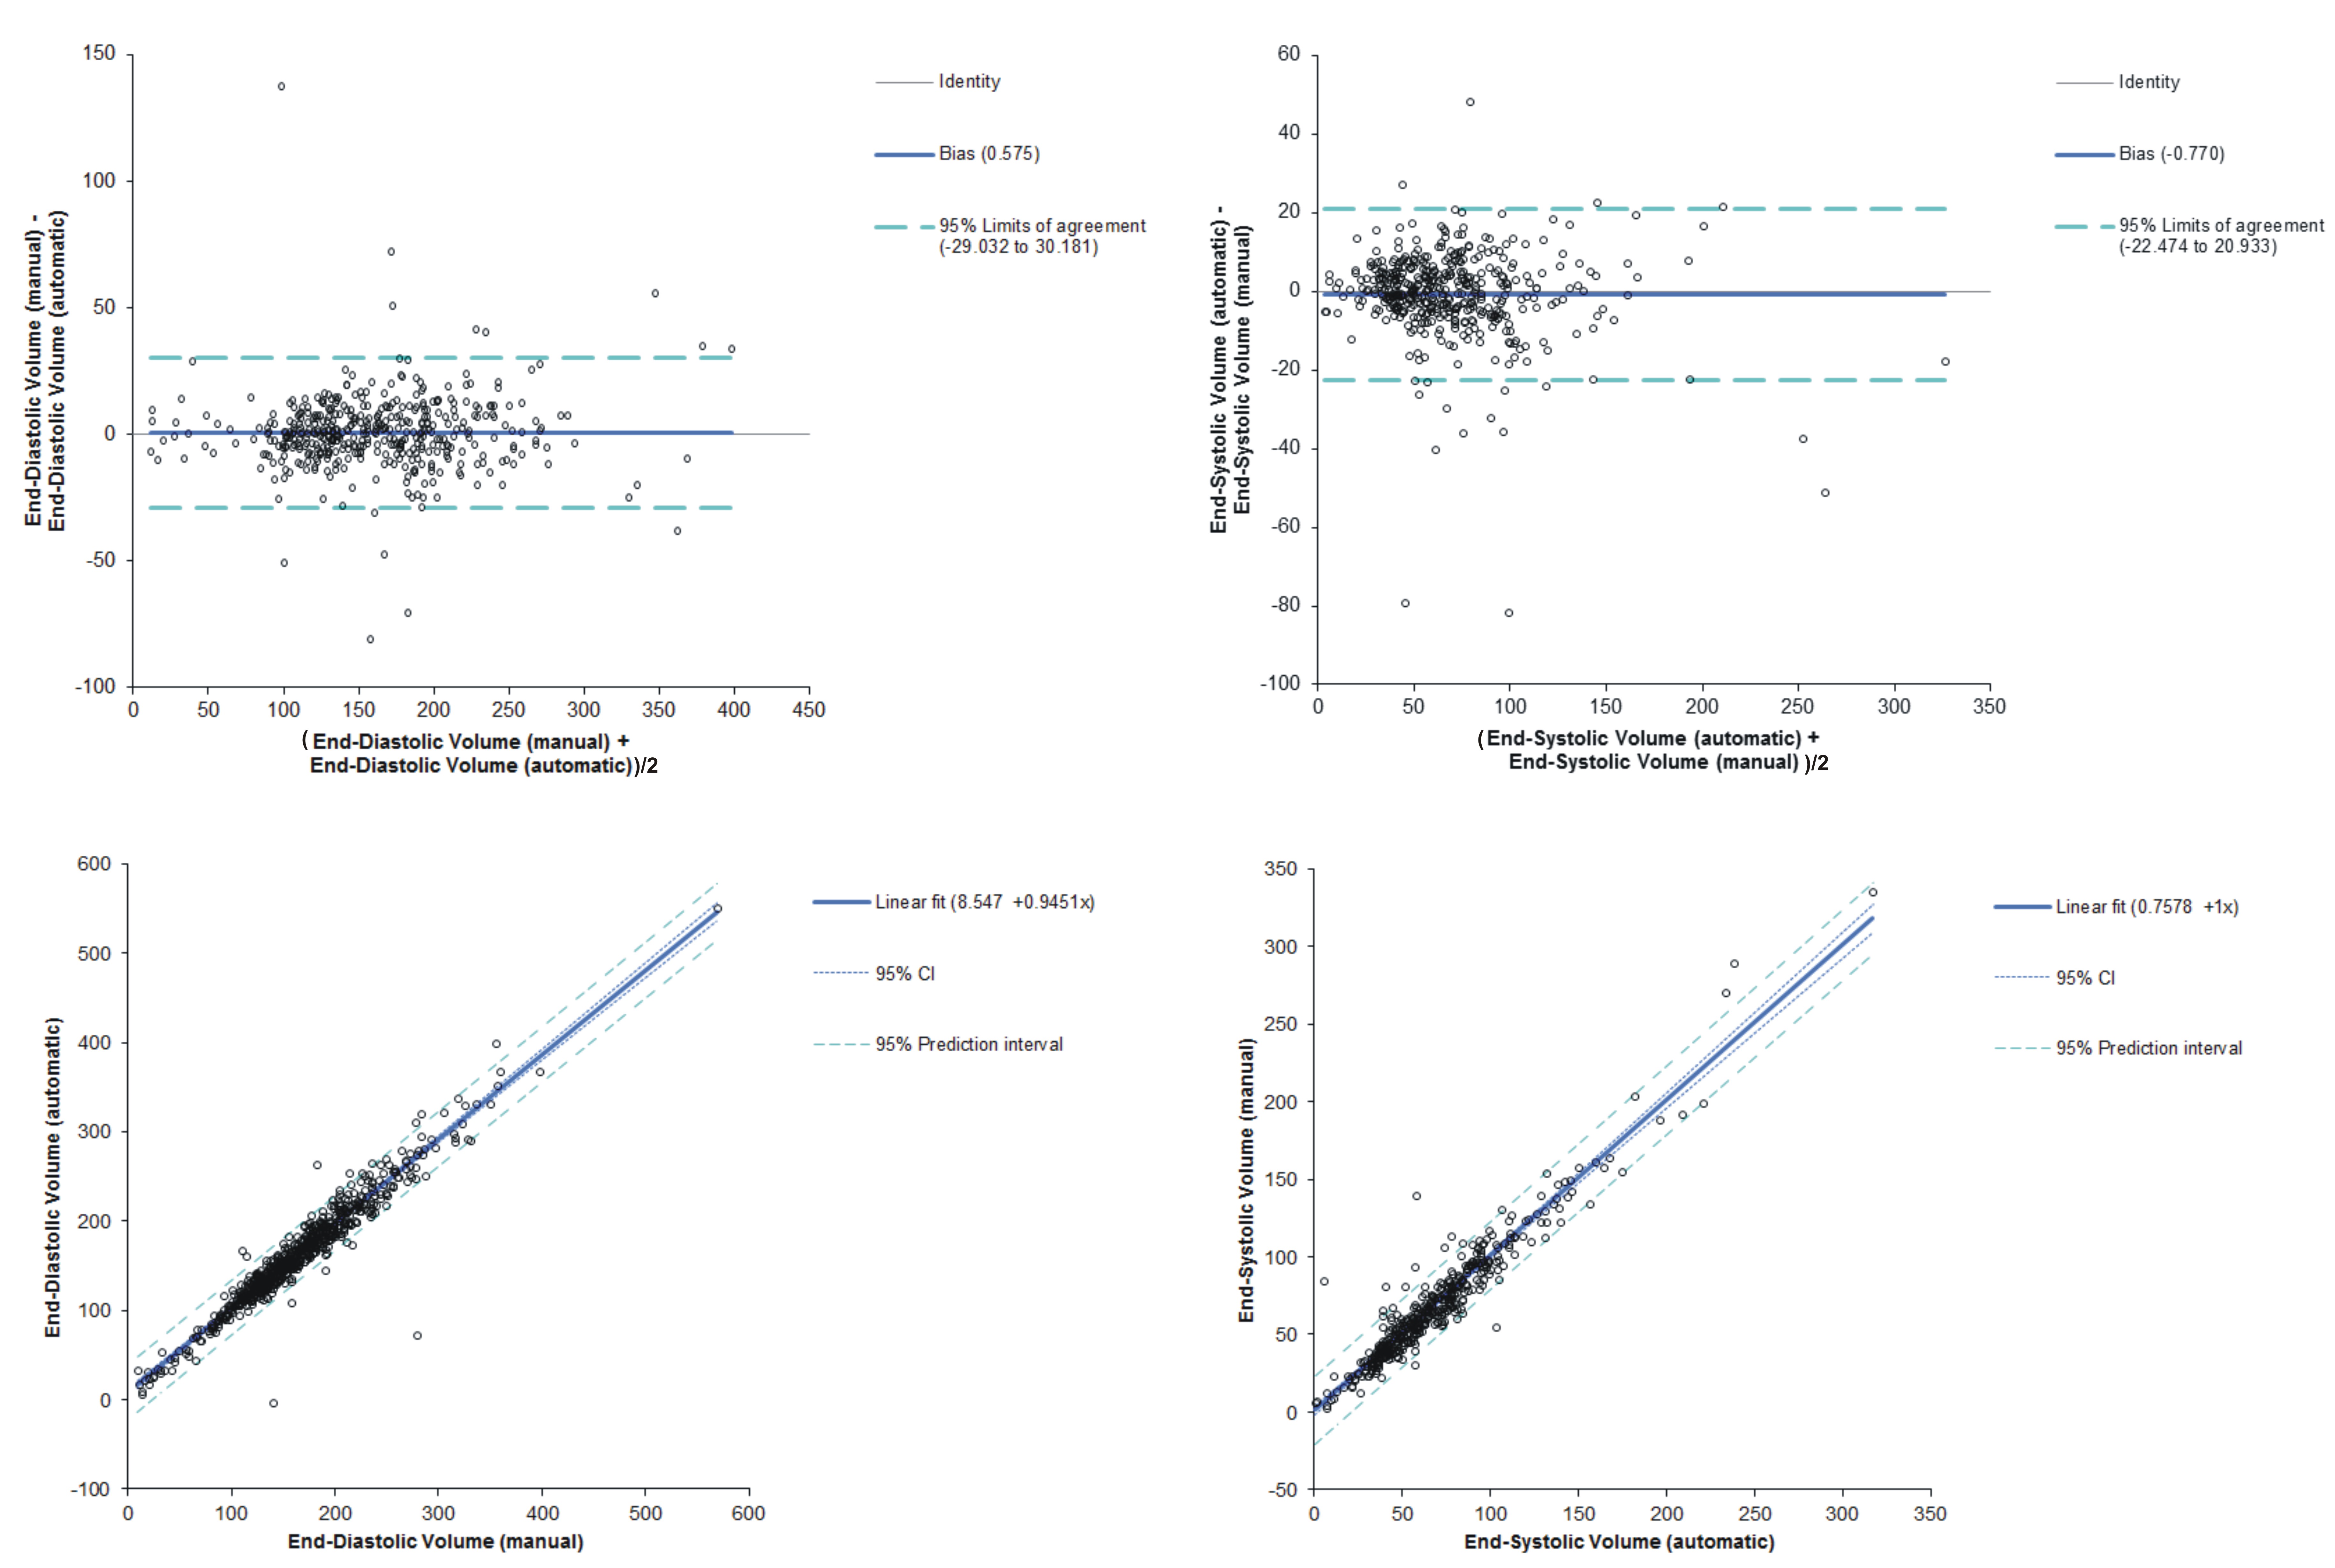
Bland- Altman and linear regression analysis were performed to visualize and quantify the performance of the automatic segmentation. Algorithm code has been placed in the public domain and is freely available.
Results:
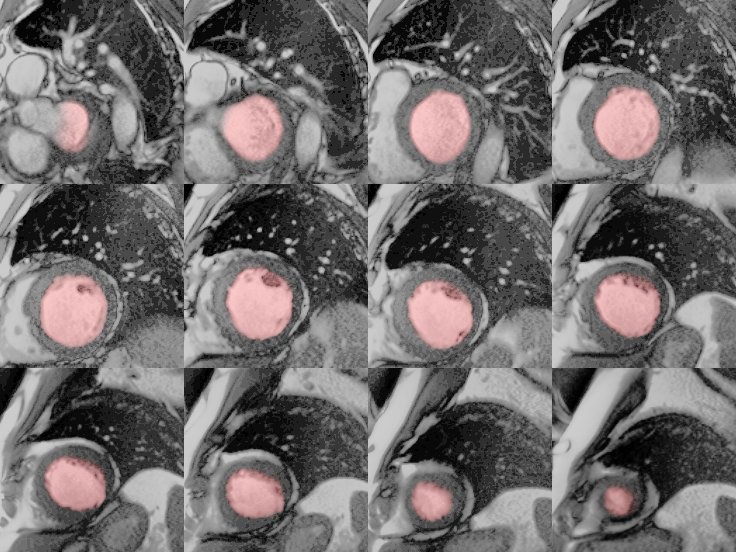
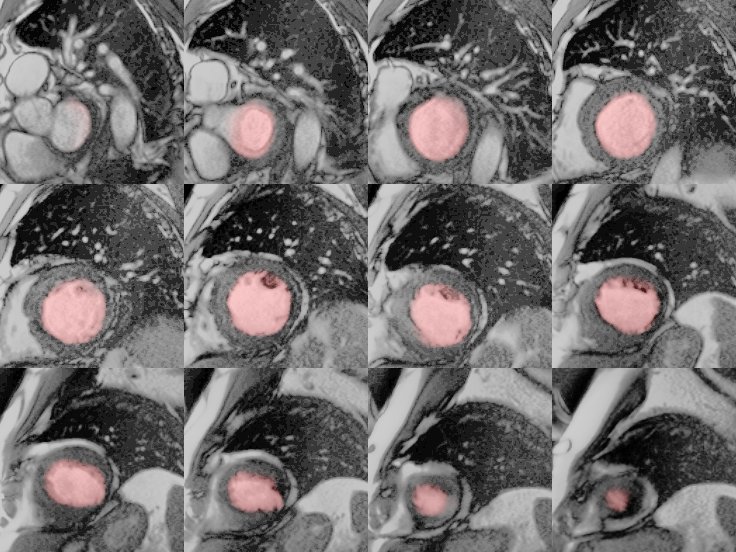
The algorithm performed very well with few exceptions. Example segmentation on a patient with dilated cardiomyopathy is given in Figures 2 and 3. Training and validation data achieved very good regression with expert analysis R2=0.91 (p<0.001) and competition data achieved an R2=0.93 (p<0.001) (Figures 4 and 5). Bland-Altman analysis showed that with few exceptions, both end-systolic and end-diastolic volumes were well within the limits of agreement. End-diastolic volume error was 7.0±10.2 ml and end-systolic volume error was 12.1±14.7 ml. There were a number of cases with “big fails” as demonstrated in the graphs (Figures 4 and 5) with errors greater than 50 ml. The ejection fraction error was low: 3.5 ±3.8%.Discussion:
Segmentation of cardiac MR images is well known to be time consuming, but of great importance to determine differences from the normal population and identify serial follow up changes. Usage of cardiac MR in the US is limited by several factors including scan length, relative reimbursement and accessibility to trained professionals. Accurate and efficient automated quantitation with machine learning would provide one piece of the puzzle, providing expert reproducible quantitative analysis. Further development is possible to extend segmentation to the LV epicardial border for LV mass measurements and also the right ventricle. Error in this study is not only attributed to the algorithm, but also cases with poor images. Lastly, the segmentation algorithm is well suited to learn individual expert segmentation patterns, including papillary muscle segmentation and basal slice segmentation. This can be accomplished via training on individual lab's historical data.Conclusion:
Automatic segmentation of the LV bloodpool using deep learning with a convolutional neural network is a promising, accurate and efficient method for segmentation of cardiac MR images. Further work is needed to determine the workflow and usage in clinical practice.Acknowledgements
No acknowledgement found.References
1) Ronneberger, Olaf, Philipp Fischer, and Thomas Brox. "U-net: Convolutional networks for biomedical image segmentation." International Conference on Medical Image Computing and Computer-Assisted Intervention. Springer International Publishing, 2015.Figures