0632
Improved Whole-Heart Coronary MR Angiography Using a 3D Cones Phyllotaxis Sequence1Electrical Engineering, Stanford University, Stanford, CA, United States, 2Radiology, Stanford University, Stanford, CA, United States, 3Cardiology, Palo Alto Medical Foundation, Palo Alto, CA, United States, 4Cardiovascular Medicine, Stanford University, Stanford, CA, United States
Synopsis
We have developed a 3D cones alternating-TR steady state free precession (SSFP) sequence for whole-heart coronary MR angiography (CMRA). In this study, we compare motion artifacts and coronary image quality between a sequential-cones and phyllotaxis-cones sequence. Coronary image quality was analyzed using qualitative scores obtained through blinded reading by two board-certified cardiologists, and the IEPA vessel sharpness metric. The results of the study show that the phyllotaxis-cones acquisition can alleviate motion artifacts, improve qualitative image quality scores and increase coronary vessel sharpness.
Introduction/Purpose
For whole-heart coronary MR angiography (CMRA), we have developed a 3D cones alternating-TR steady state free precession (SSFP) sequence [1]. Compared to 3D projection reconstruction (3DPR) [2, 3], the 3D cones trajectory offers higher SNR efficiency and requires fewer readouts. While our initial implementation of 3D cones used a segmented acquisition that indexed through each cone surface interleave in sequential order, we have recently adapted a phyllotaxis-based ordering scheme to spread out the k-space coverage per segment. The objective was to gain better immunity to motion without aggravating eddy current effects [4]. In this study, we compare motion artifacts and coronary image quality between the sequential-cones sequence [5] and the proposed phyllotaxis-cones [4] sequence.Method
Cone Trajectory Design:
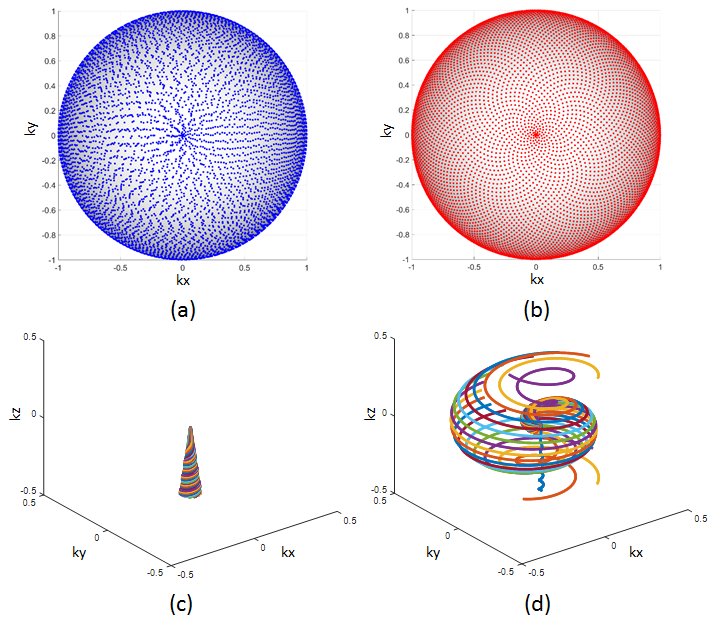
The cones trajectories were designed with 10,980 readouts, 18 readouts per heartbeat, 28x28x14 cm3 field of view (FOV) and 1.2 mm isotropic resolution. Each cone readout is parameterized by a polar angle, <φ, θ>, that defines the cone elevation and azimuthal angles at the center of k-space [5]. When applying phyllotaxis to 3D cones, the elevation angles were redesigned [6] to uniformly sample k-space. Both sequential and phyllotaxis polar angles and readouts for one heartbeat are shown in fig. 1. Despite traversing through a large region of k-space per heartbeat, phyllotaxis offers robustness to eddy currents [4, 6, 7].
Phantom and In Vivo Studies:
To examine motion sensitivity, phantom scans were done for both the sequential and phyllotaxis designs [6] using a simulated 80 bpm pulse. For back and forth oscillatory motion, the scanner table was automated to move 25 mm in the z-direction.
In vivo scans of eight volunteers were performed on a 1.5T GE scanner using an 8-channel cardiac coil. Both CMRA sequences used peripheral pulse-gating, two orthogonal 2D image-based navigators (iNAVs) [1] and 18 cones per heartbeat (scan times of approximately 8-10 minutes). Using both iNAVs, estimates of the S/I, A/P and L/R respiratory-based translation of the heart were computed for retrospective motion correction. The scan order for each cones sequence was randomized between volunteers.
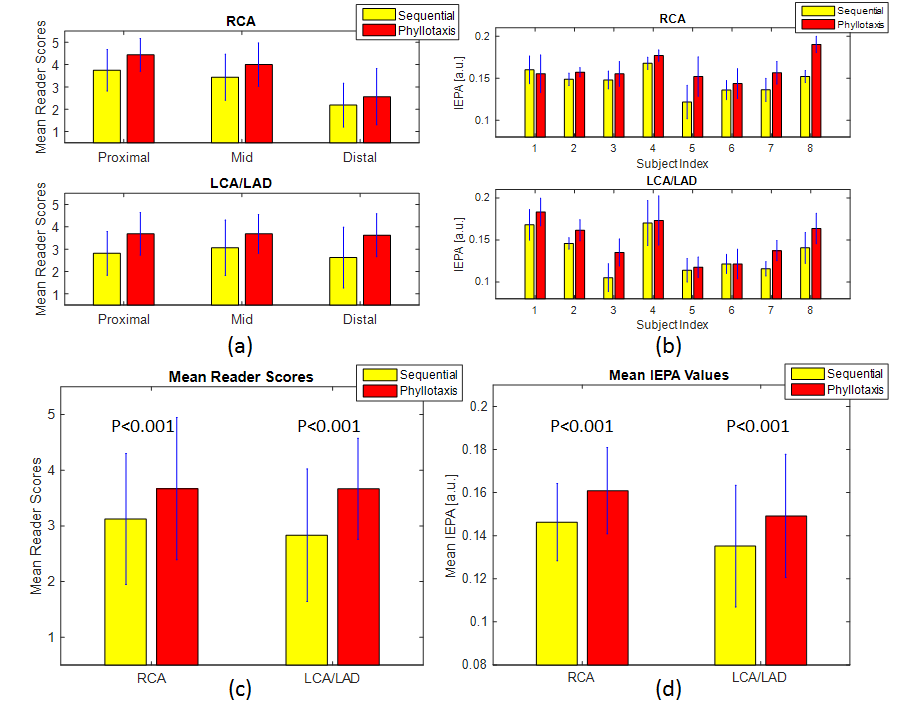
Qualitative scores of coronary image quality for the right coronary artery (RCA) and left coronary artery (LCA)/left anterior descending (LAD) artery were obtained through blinded reading by two board-certified cardiologists with experience in CMRA. Pairs of images for sequential and phyllotaxis were randomized and displayed together. Image quality of the proximal, mid and distal segments of the RCA and LCA/LAD was scored on a 5-point scale: 5-Excellent, 4-Good, 3-Moderate, 2-Poor and 1-Non-diagnostic. A total of 96 segments were scored by each reader.
Quantitative measurements of coronary vessel sharpness were also obtained using the image edge profile acutance (IEPA) metric [8]. The IEPA metric is a gradient-based measurement which analyzes the sharpness of multiple cross-sectional profile lines giving values ranging from 0 to 1, where higher values correspond to sharper edges. This was applied to the RCA and LCA/LAD along 50 mm segments for every 1 mm, using 10 evenly spaced profile lines for each method.
Results
Phantom Study:
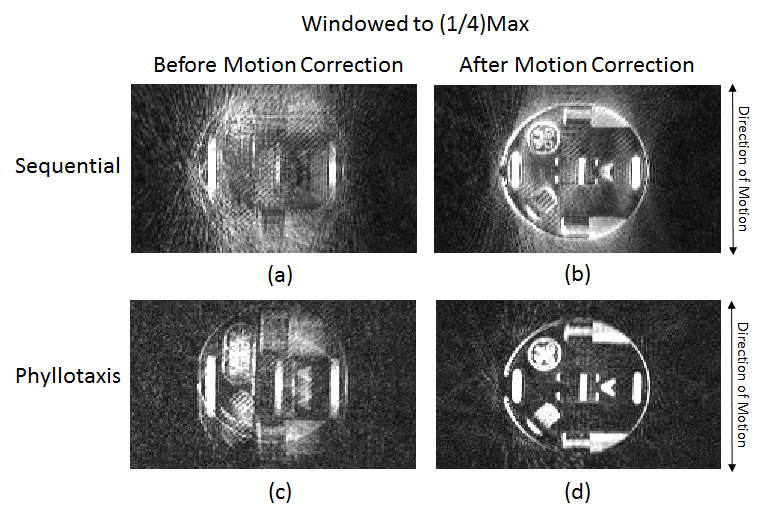
In fig. 2, images from the motion phantom study are shown for the sequential and phyllotaxis acquisitions. Before motion correction, the sequential acquisition demonstrates coherent artifacts which strongly corrupt the image quality. For phyllotaxis, the motion artifacts manifest more as blurring along with incoherent artifacts. After 2D translational motion correction, residual motion artifacts are more evident in the image based on the sequential acquisition.
In Vivo Study:
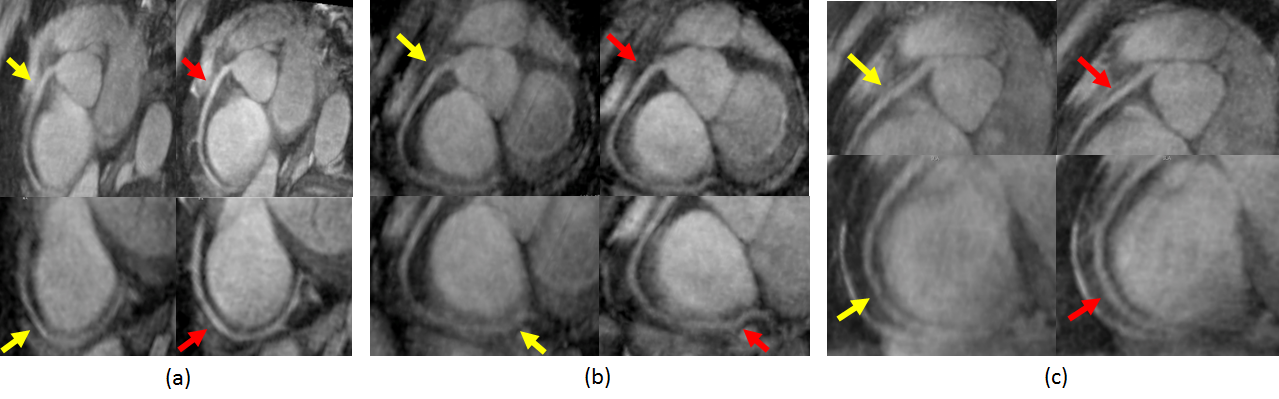
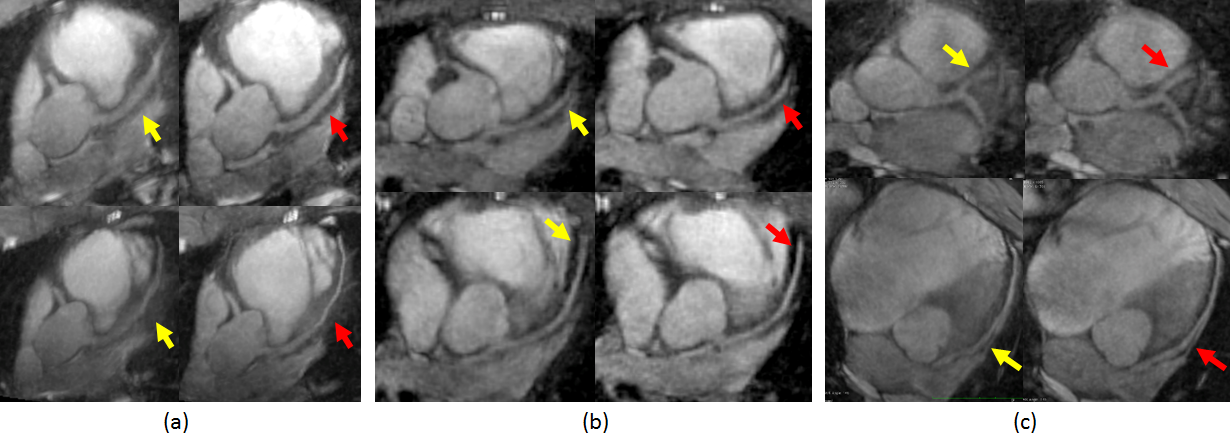
Figures 3 and 4 show images of the RCA and LCA/LAD respectively for phyllotaxis compared to sequential in three volunteers. Reader scores and IEPA results for the eight volunteer scans are summarized in fig. 5. The readers rated the phyllotaxis images higher than the sequential images for both the RCA and LCA/LAD. Similarly, the average IEPA values for vessel sharpness indicate that phyllotaxis outperformed sequential for 14 out of the 16 RCA and LCA/LAD segments. The statistical significance of the results for reader scores and IEPA values was analyzed using the two-tailed Student’s t-test, giving P<0.001 for both the RCA and LCA/LAD.
Discussion and Conclusion
These
results demonstrate the improved coronary image quality achievable with a 3D
cones phyllotaxis acquisition as compared to a sequential acquisition. Phyllotaxis
applied to 3D cones requires redesigning the trajectory, but provides
robustness to coherent motion artifacts by using increased k-space coverage during
each heartbeat. In contrast, sequential sampling lacks these improvements and,
even after motion correction, is more susceptible to residual motion artifacts.
The results of this study show that the phyllotaxis-cones acquisition can alleviate
motion artifacts, improve qualitative image quality scores and increase coronary
vessel sharpness.Acknowledgements
We gratefully acknowledge the support of NIH grants R01HL127039 and T32HL007846.References
[1] Wu HH, Gurney PT, Hu BS, Nishimura DG, McConnell MV. Free breathing multiphase whole-heart coronary MR angiography using image-based navigators and three-dimensional cones imaging. Magn Reson Med 2013; 69:1083–1093.
[2] Addy NO, Ingle RR, Wu HH, Hu BS, Nishimura DG. High-Resolution Variable-Density 3D Cones Coronary MRA. Magn Reson Med. 2015; 74: 614–621.
[3] Atlas SW. Magnetic Resonance Imaging of the Brain and Spine. Philadelphia: Lippincott Williams & Wilkins 2009.
[4] Malavé MO, Addy NO, Ingle RR, Cheng JY, Baron CA, Nishimura DG. Analysis of motion and eddy currents with 3D cones reordering for whole-heart coronary MR angiography. Proc. Intl. Soc. Mag. Reson. Med. 24 (2016); 1852.
[5] Gurney PT, Hargreaves BA, Nishimura DG. Design and analysis of a practical 3D cones trajectory. Magn Reson Med. 2006; 55:575-82.
[6] Malavé MO, Addy NO, Ingle RR, Cheng JY, Nishimura DG, 3D Cones Reordering Design Methods for Whole-Heart Coronary MR Angiography. Proc. Intl. Soc. Mag. Reson. Med. 23 (2015); 0652.
[7] Piccini D, Littmann A, Nielles-Vallespin S, Zenge MO. Spiral phyllotaxis: the natural way to construct a 3D radial trajectory in MRI. Magn Reson Med. 2011; 66:1049-56.
[8] Biasiolli L, Lindsay AC, Choudhury RP, Robson MD. Loss of Fine Structure and Edge Sharpness in Fast- Spin-Echo Carotid Wall Imaging: Measurements and Comparison with Multiple-Spin-Echo in Normal and Atherosclerotic Subjects. J Magn Reson Imaging. 2011; 33:1136-43.
[9] Schwemmer C, Forman C, Wetzl J, Maier A, Hornegger J. CoroEval: a multi-platform, multi-modality tool for the evaluation of 3D coronary vessel reconstructions. Phys Med Biol 2014; 59:5163.
Figures