0628
Quantifying microstructure changes in a mouse brain tumour model following Temozolomide therapy with VERDICT MRI1Centre for Advanced Biomedical Imaging, University College London, London, United Kingdom, 2Centre for Medical Image Computing, Department of Computer Science, University College London, London, United Kingdom
Synopsis
In this study, we use VERDICT (Vascular, Extracellular and Restricted Diffusion for Cytometry in Tumours) MRI to assess longitudinal changes in the microstructure of a mouse model of glioma (GL261), following treatment with Temozolomide, an alkylating chemotherapeutic agent. VERDICT estimates of cell radius and intracellular volume fraction decreased significantly at day-6 of therapy, relative to control animals, and in advance of changes in tumour volume and ADC. These changes were consistent with histological changes measured in the same tumours, and are likely to correspond to microstructural changes induced by apoptosis.
Purpose
To image the short-term effects of Temozolomide-induced apoptosis in a mouse model of glioblastoma, using VERDICT MRI, and to examine its sensitivity compared with standard diffusion MRI.Methods
Study design: Two cohorts of C57BL/6 mice (n=12 in each group) were injected with 2x10⁴ GL261 mouse glioma cells into the right striatum. Baseline MRI was carried out 13-days post injection. The therapy group (TMZ) was given 3 consecutive, daily doses of 130mg/kg Temozolomide by gavage. The control group were given a sham dose by gavage. Follow-up imaging was acquired in both cohorts at +3, +6 and +9-days post therapy. Animals were sacrificed for histology immediately after the final imaging session.
MRI: Imaging was carried out on a 9.4T MRI scanner (Agilent, USA). Ear bars were used to secure the mice and image without respiration gating. For VERDICT, a pulsed-gradient spin echo planar imaging (EPI) sequence was used with the following parameters: TR = 3s, TE = min, DM = 642, FOV = 20mm2, slice thickness = 0.5mm, slices = 5, shots = 3, averages = 2. In total, 46 diffusion weightings in 3 directions were acquired in addition to a 42 direction DTI acquisition (b = 1000 s/mm2), as detailed previously1. Total imaging time for VERDICT was 60 minutes. After VERDICT, mice were injected with gadolinium-DTPA (Magnevist) and slice-matched T1-weighted spin echo EPI images were acquired for drawing tumour ROIs.
Image analysis: Image processing was carried out using MATLAB. Tumour volumes were measured by manual segmentation of T2-weighted images. For VERDICT, DW images were normalised to their corresponding B0 image. Pixel-wise parameter maps were generated for whole-slice visualisation. Group-wise analysis was undertaken by fitting to the average diffusion signal across the tumour ROI. For comparison with ADC, a three-compartment VERDICT model was fitted consisting of Ball, Sphere and Stick compartments2.
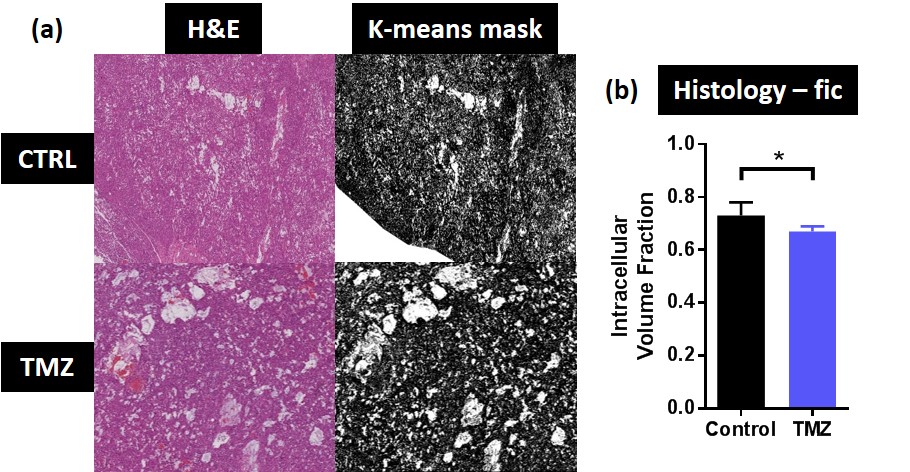
Histology: For histological analysis, perfused-fixed brains were stained with haematoxylin and eosin. Intracellular volume fraction (fic) was estimated by applying a k-means clustering threshold to tumour region: effectively, fic = stained volume/total tumour volume.
Results
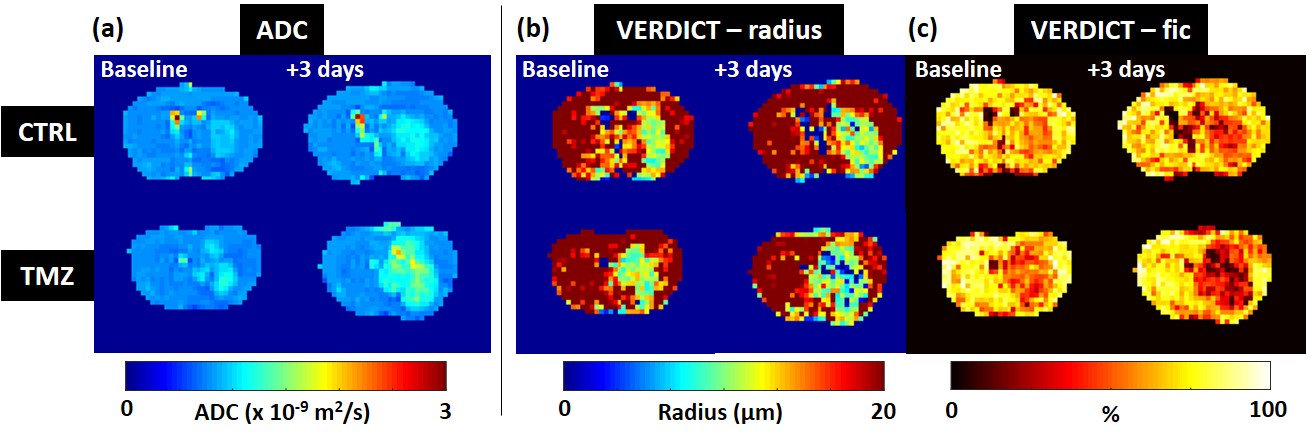
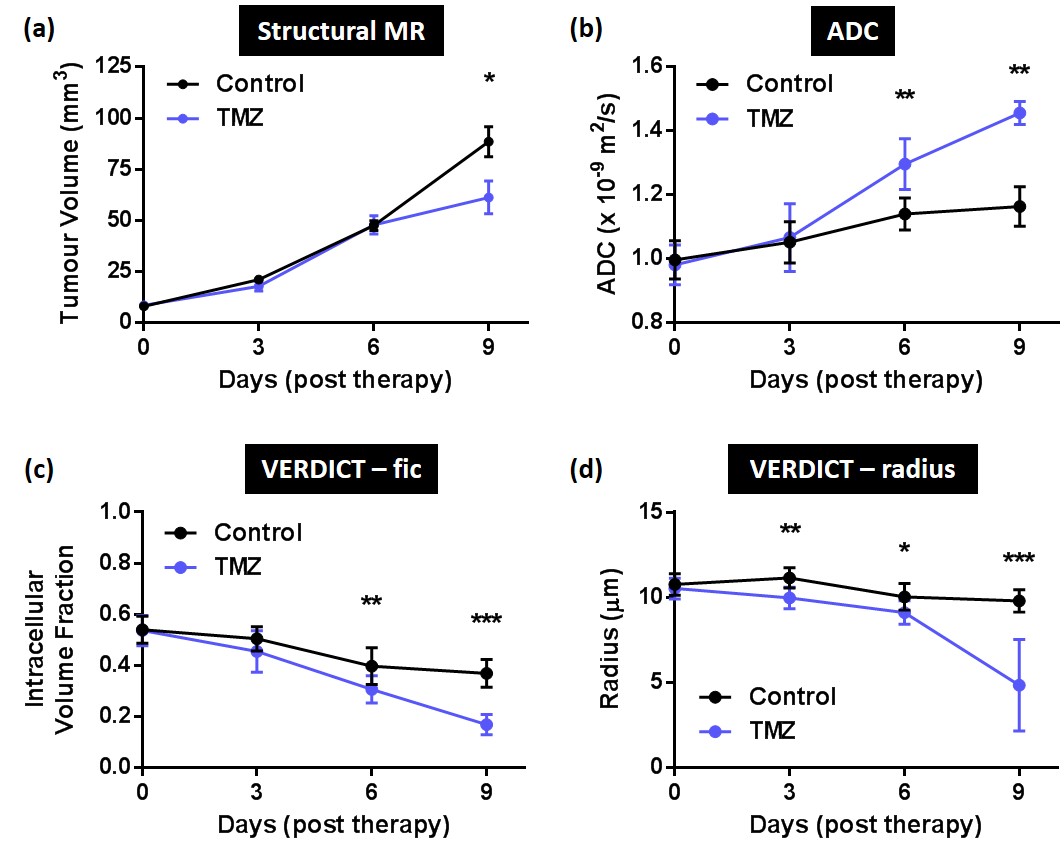
Tumour volume was equivalent between treated and untreated animals until 9-days post therapy when the TMZ group showed a significant reduction in size (Fig 2a). ADC maps from the control group showed a marginal increase in ADC after 3-days of growth (Fig 1a, top row). VERDICT parameter maps showed slightly more pronounced changes over the equivalent period (Fig 1b-c, top row). In the TMZ group, microstructural changes were much more evident, especially in VERDICT parameter maps. The VERDICT radius parameter maps showed clear regions of decrease within the tumour (Fig 1b, bottom row) and lower fic (Fig 1c, bottom row), compared to subtle increases in ADC maps (Fig 1a, bottom row).
Group-wise analysis showed that ADC was significantly different between the control and TMZ groups 6-days post therapy (Fig 2a). VERDICT demonstrated improved sensitivity compared to ADC: the control and TMZ cohorts could be distinguished at 3-days post-therapy (p < 0.01) based on the radius parameter (Fig 2b). The fic parameter decreased more quickly in the TMZ-treated tumours than the control group (Fig 2c), with a significant difference observed at 6-days after therapy. Histological analysis of brain tumours (Fig 3a) showed the same trend as fic values as VERDICT data: cell density was lower in the TMZ group at day 9 (Fig 3b).
Discussion
In this study, we have shown that VERDICT parameters are more sensitive than conventional volumetric and ADC measurements for detecting early changes in tumour microstructure in response to an apoptosis chemotherapy agent. Interestingly, based on tumour volume alone, Temozolomide appeared to have little effect on tumour size until 9-days after treatment, whereas VERDICT was able to detect alterations after 3-days. This demonstrates a potential lag-time between changes on a microstructural scale and their manifestation at a macroscopic level. Translation of this technique into human brain tumours is currently underway, and could be used to guide treatment stratification at an early time point, prior to changes in conventional radiological measures.Acknowledgements
No acknowledgement found.References
1E. Panagiotaki, S. Walker-Samuel, B. Siow, et al. Noninvasive Quantification of Solid Tumor Microstructure Using VERDICT MRI. Cancer Research (2014).
2E. Panagiotaki, R. W. Chan, N. Dikaios et al. Microstructural Characterization of Normal and Malignant Human Prostate Tissue With Vascular, Extracellular, and Restricted Diffusion for Cytometry in Tumours Magnetic Resonance Imaging. Invest Radiol (2015).
Figures