0626
DCE time-series characterization with supervised deep learning: Alternative to PK model approaches1GE Global Research, Bangalore, India, 2GE Global Research, Niskayuna, NY, United States
Synopsis
We demonstrate feasibility of using a supervised deep learning method with DCE time-series data to obtain consistent numerical cutoff for tumor regions. DL based characterization is robust to fluctuations in DCE data due to protocol and patient physiology differences, which typically hinders such a classification with PK maps in clinical practice.
Introduction
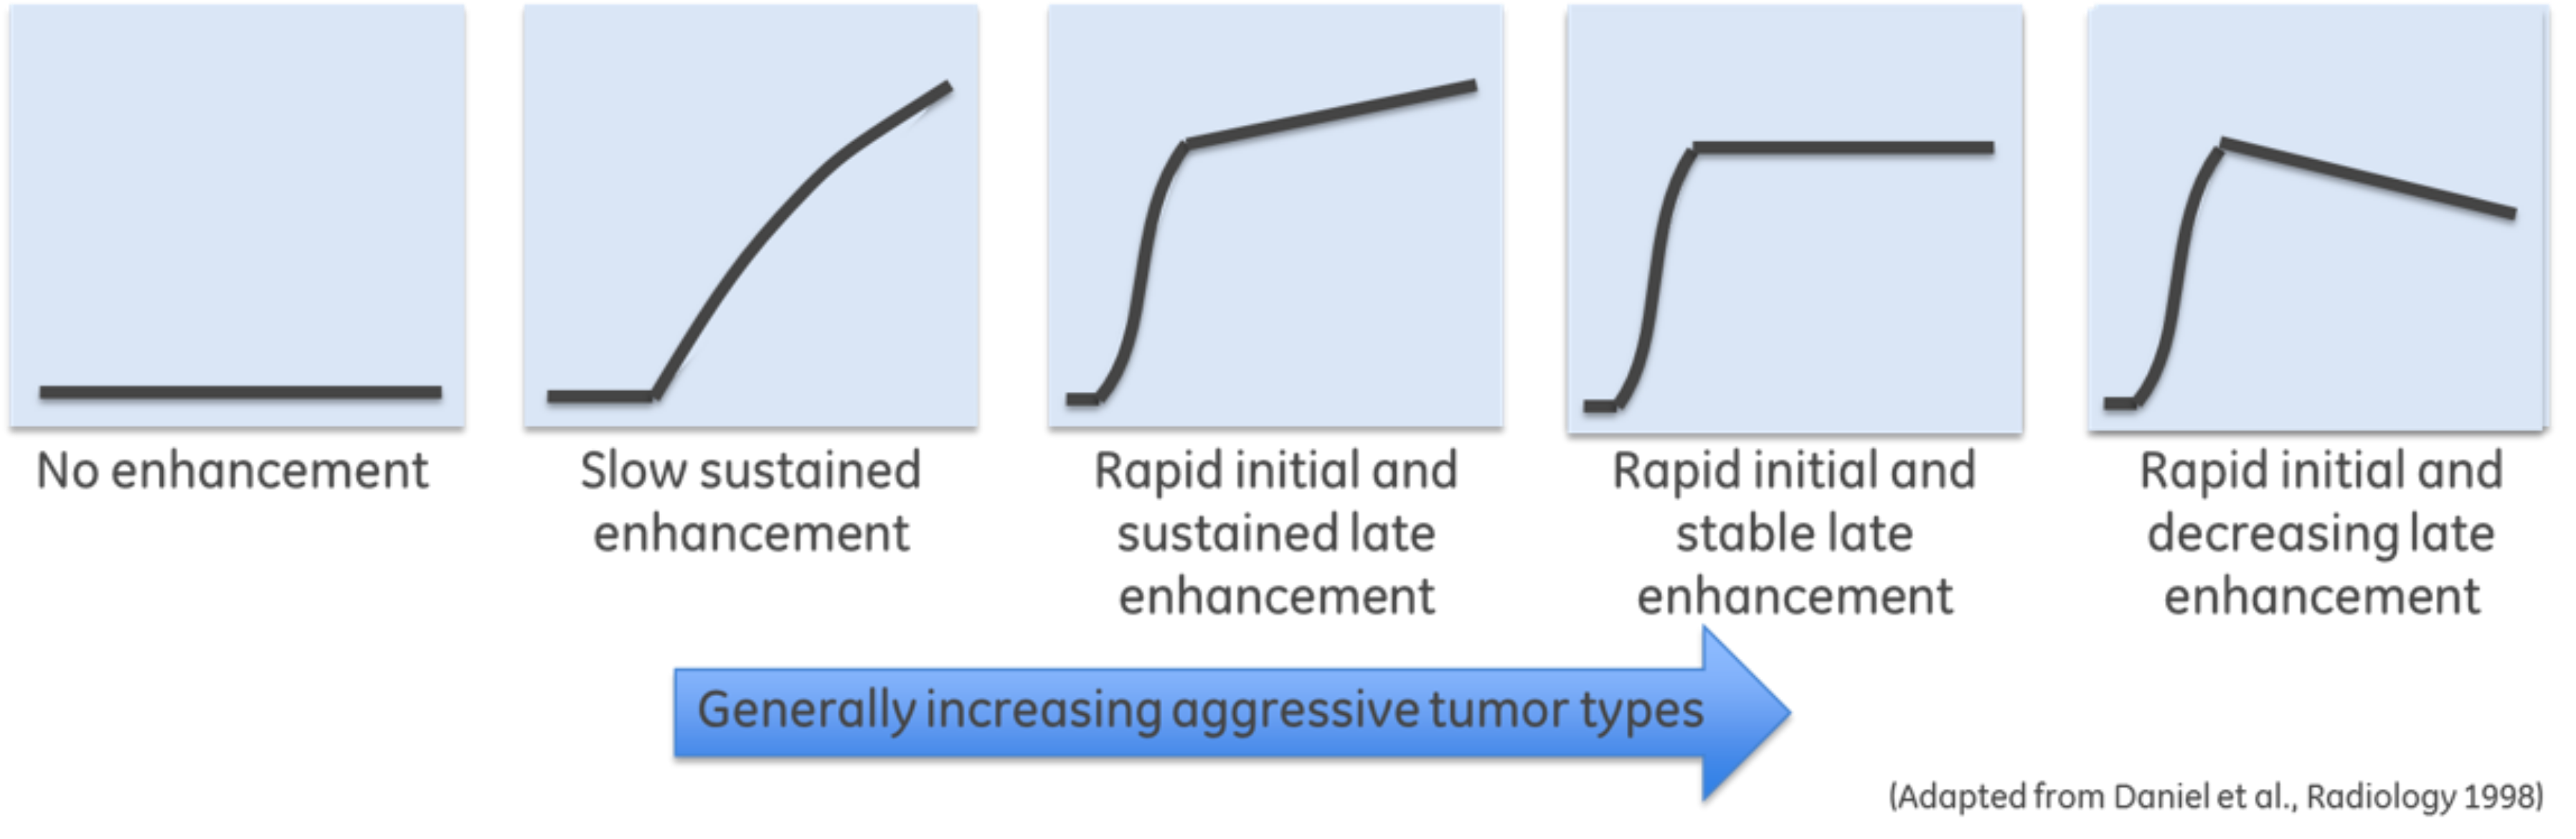
Dynamic contrast enhanced MRI (DCE-MRI) is a biomarker for studying tumor microvascular characteristics [1]. Shape of DCE signal curve (Figure 1) provides a good visual assessment of tumor aggressiveness [2]. DCE-curve shape is quantified by fitting different pharmacokinetic (PK) models to DCE data to extract tumor vascular properties: leakage rate (Ktrans), extra-vascular extra-cellular space fraction (ve) etc. [3]. However, DCE quantification can be influenced by protocol parameters, baseline T1 , variations in input AIF [1,5] and assumptions made in PK modeling. Lack of DCE standardization and quantification hinders direct comparability of PK parameters in a cohort of patients or multicenter studies and limits utility of DCE analysis only for patient follow-up studies [1, 6, 7]. Deep learning (DL) methods with DCE-MRI have been demonstrated to segment tumors [8] or different tissue types [9] without explicit PK modeling. In this work, we hypothesized that since shapes of tumor curves are relatively maintained despite protocol variations; this could be learnt by a DL algorithm and provide necessary parameter standardization and interpretation of DCE data. Experiments and results in representative neuro tumor cases are presented along with correlation to Tofts 2-parameter PK model (Ktrans and ve) maps.Methods
Patient Data: DCE-MRI data was acquired from 14 brain tumor patients under IRB approved protocols on 1.5T GE Signa Genesis and 3.0T GE Signa HDx scanner.
DCE-MRI: Axial slices, 3D EFGRE with 8-channel brain coil, TE = 1.15-1.85 ms, TR = 4.9 -5.4 ms, FA = 10°-20°, slice thickness = 7mm, matrix size = 256 x 256 - 512 x 512, FOV = 240x240 mm2, 20 bolus volumes ~7s to 14s / volume.
DCE Data Analysis: DCE PK analysis was performed using automated in-house tool developed within ITK [7]. DCE time course data was converted from arbitrary signal units into contrast agent concentration units using baseline pre-contrast images and a fixed tissue T1 = 800 ms (1.5T) and 1200 ms (3T). AIF was determined automatically [10]. DCE concentration data was fit to two-parameter Toft’s model to obtain Ktrans and ve estimates [11].
DL algorithm: A variation of Recurrent Neural Networks (RNN)- Gated Recurrent Units (GRU) along with the ADAM optimizer (100 hidden units) and high dropout (60%) were used for experiments.
DL Data Preparation: A trained radiologist marked approximate tumor ROI and normal ROI in all 14 cases. Care was taken to mark blood vessels as normal tissue. For DL setup, 5 cases were randomly chosen for training purposes. In training set, only half of tumor and normal voxels were used for training DL model. Training was done at each voxel, with DCE concentration curve as input and tissue class (normal, tumor) as output label. Overall 118000 voxels from 5 cases were trained to obtain DCE DL model.
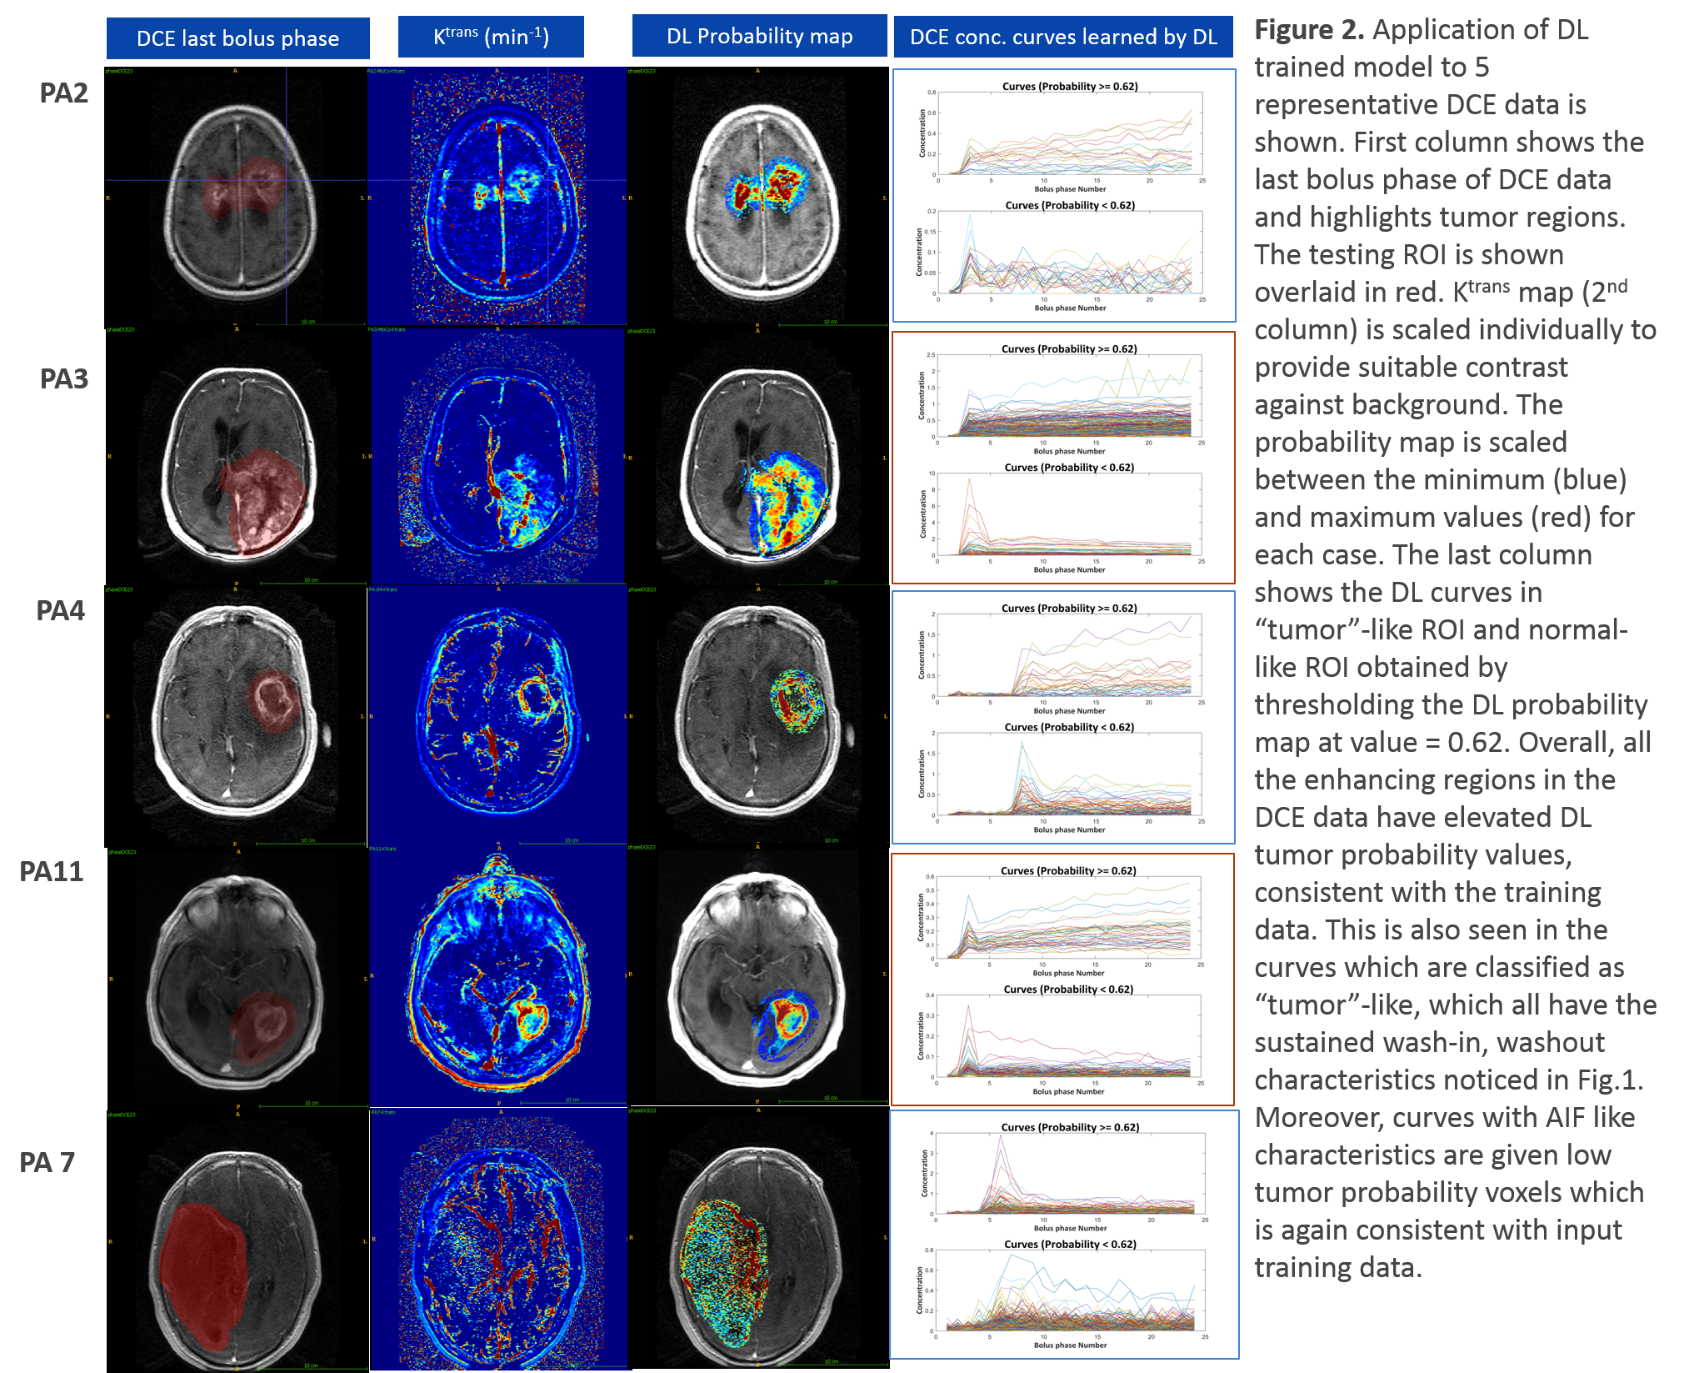
DL data analysis: Testing was performed on all the fourteen cases in a ROI which was obtained by dilating the tumor ROI with a circular structural element of radius 8. All regions in this ROI outside tumor ROI were labelled as normal tissue. During testing, DL model returned for each voxel a probability value of the voxel being tumor-like. For each case, we thresholded DL tumor probability map to determine a probability cut-off at which overlap dice coefficient is maximum between thresholded probability map and clinician marked tumor ROI. This was used to study shape of curves classified as “tumor-like” and “normal-appearing” by DL algorithm.
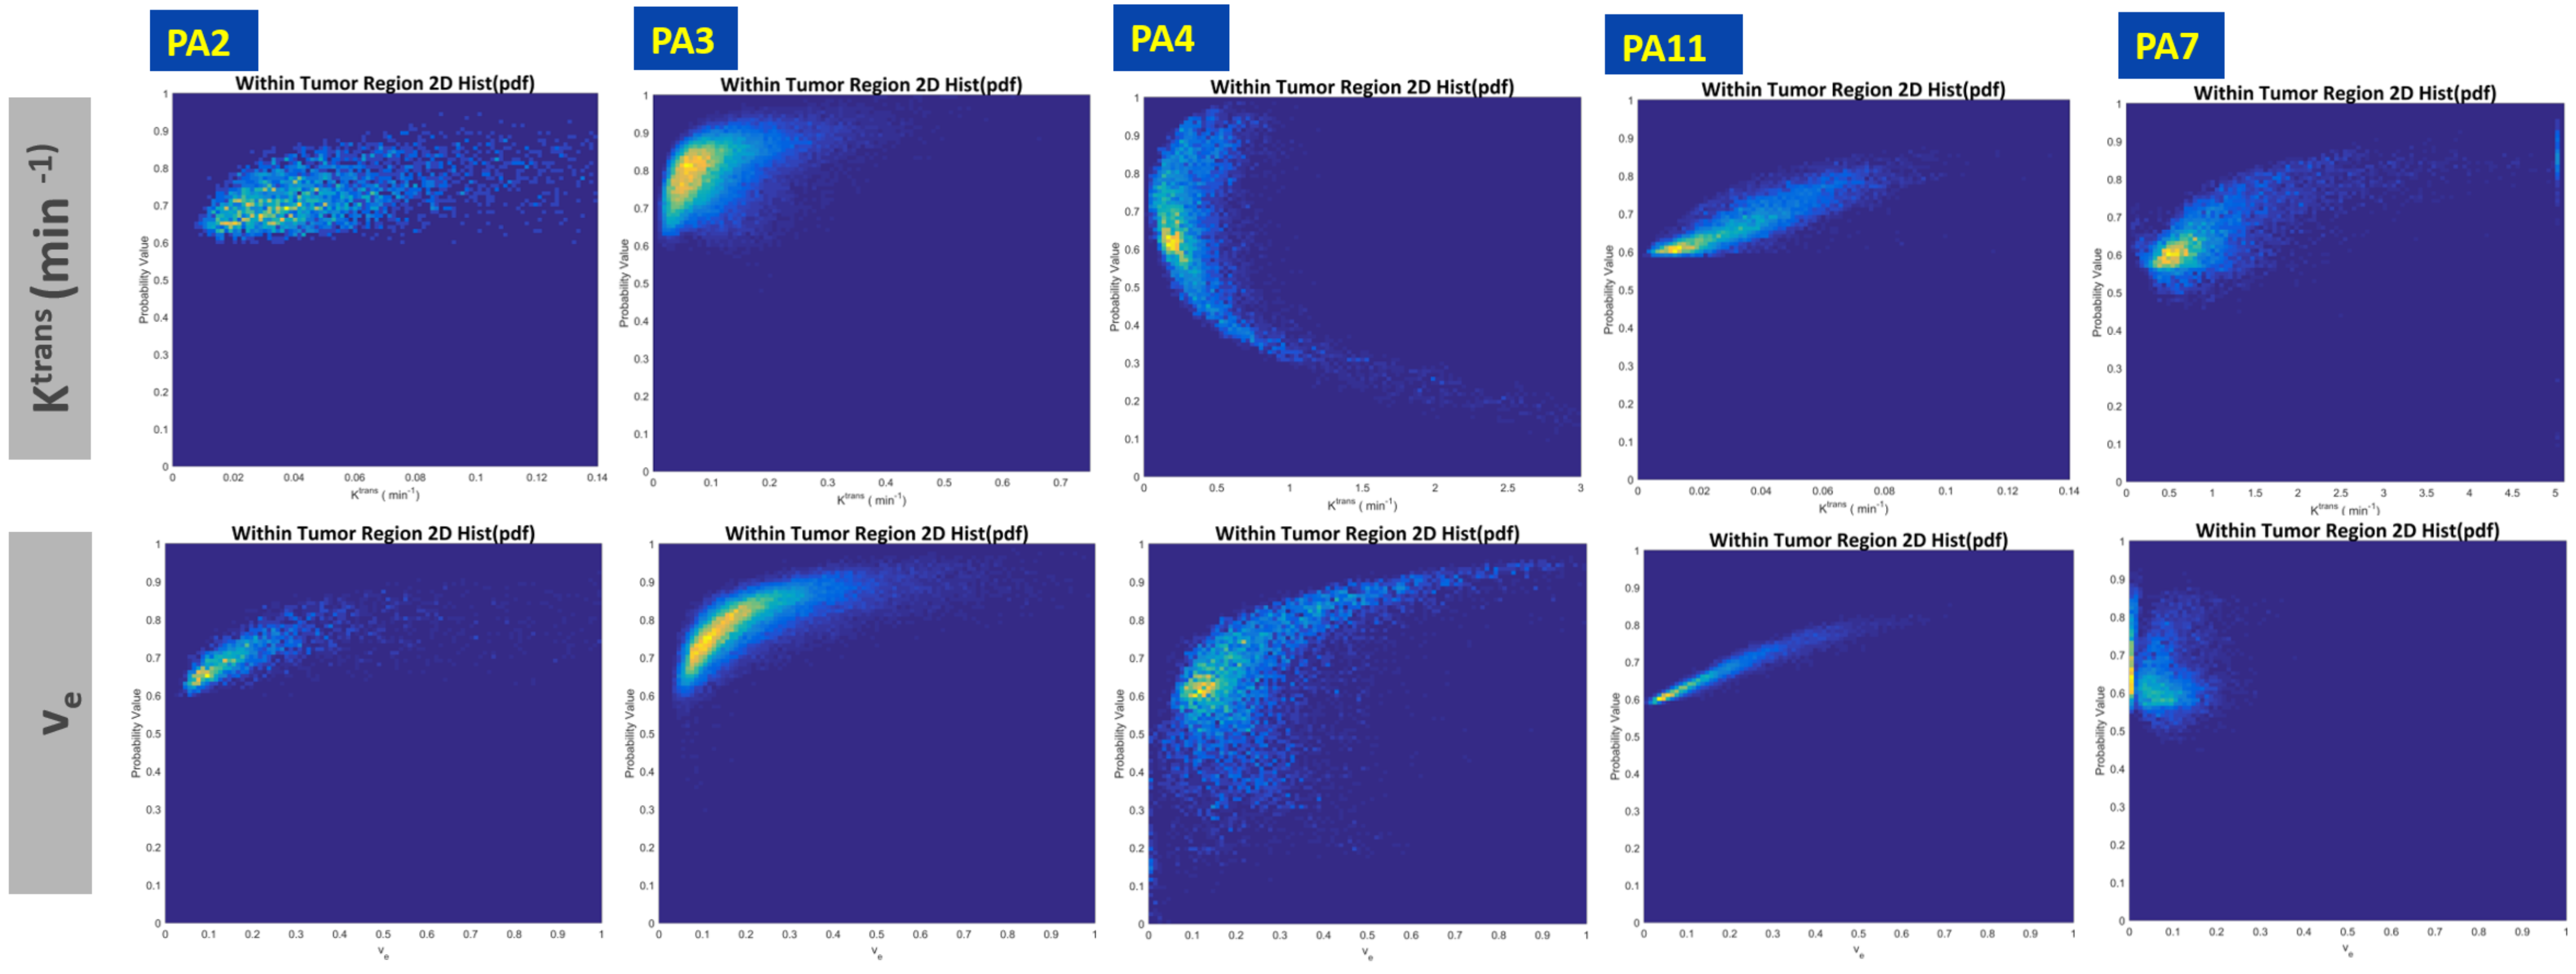
Correlation Analysis: 2D histogram analysis was performed between DL probability map and Ktrans / ve maps to their respective relationships.
Results and Discussion
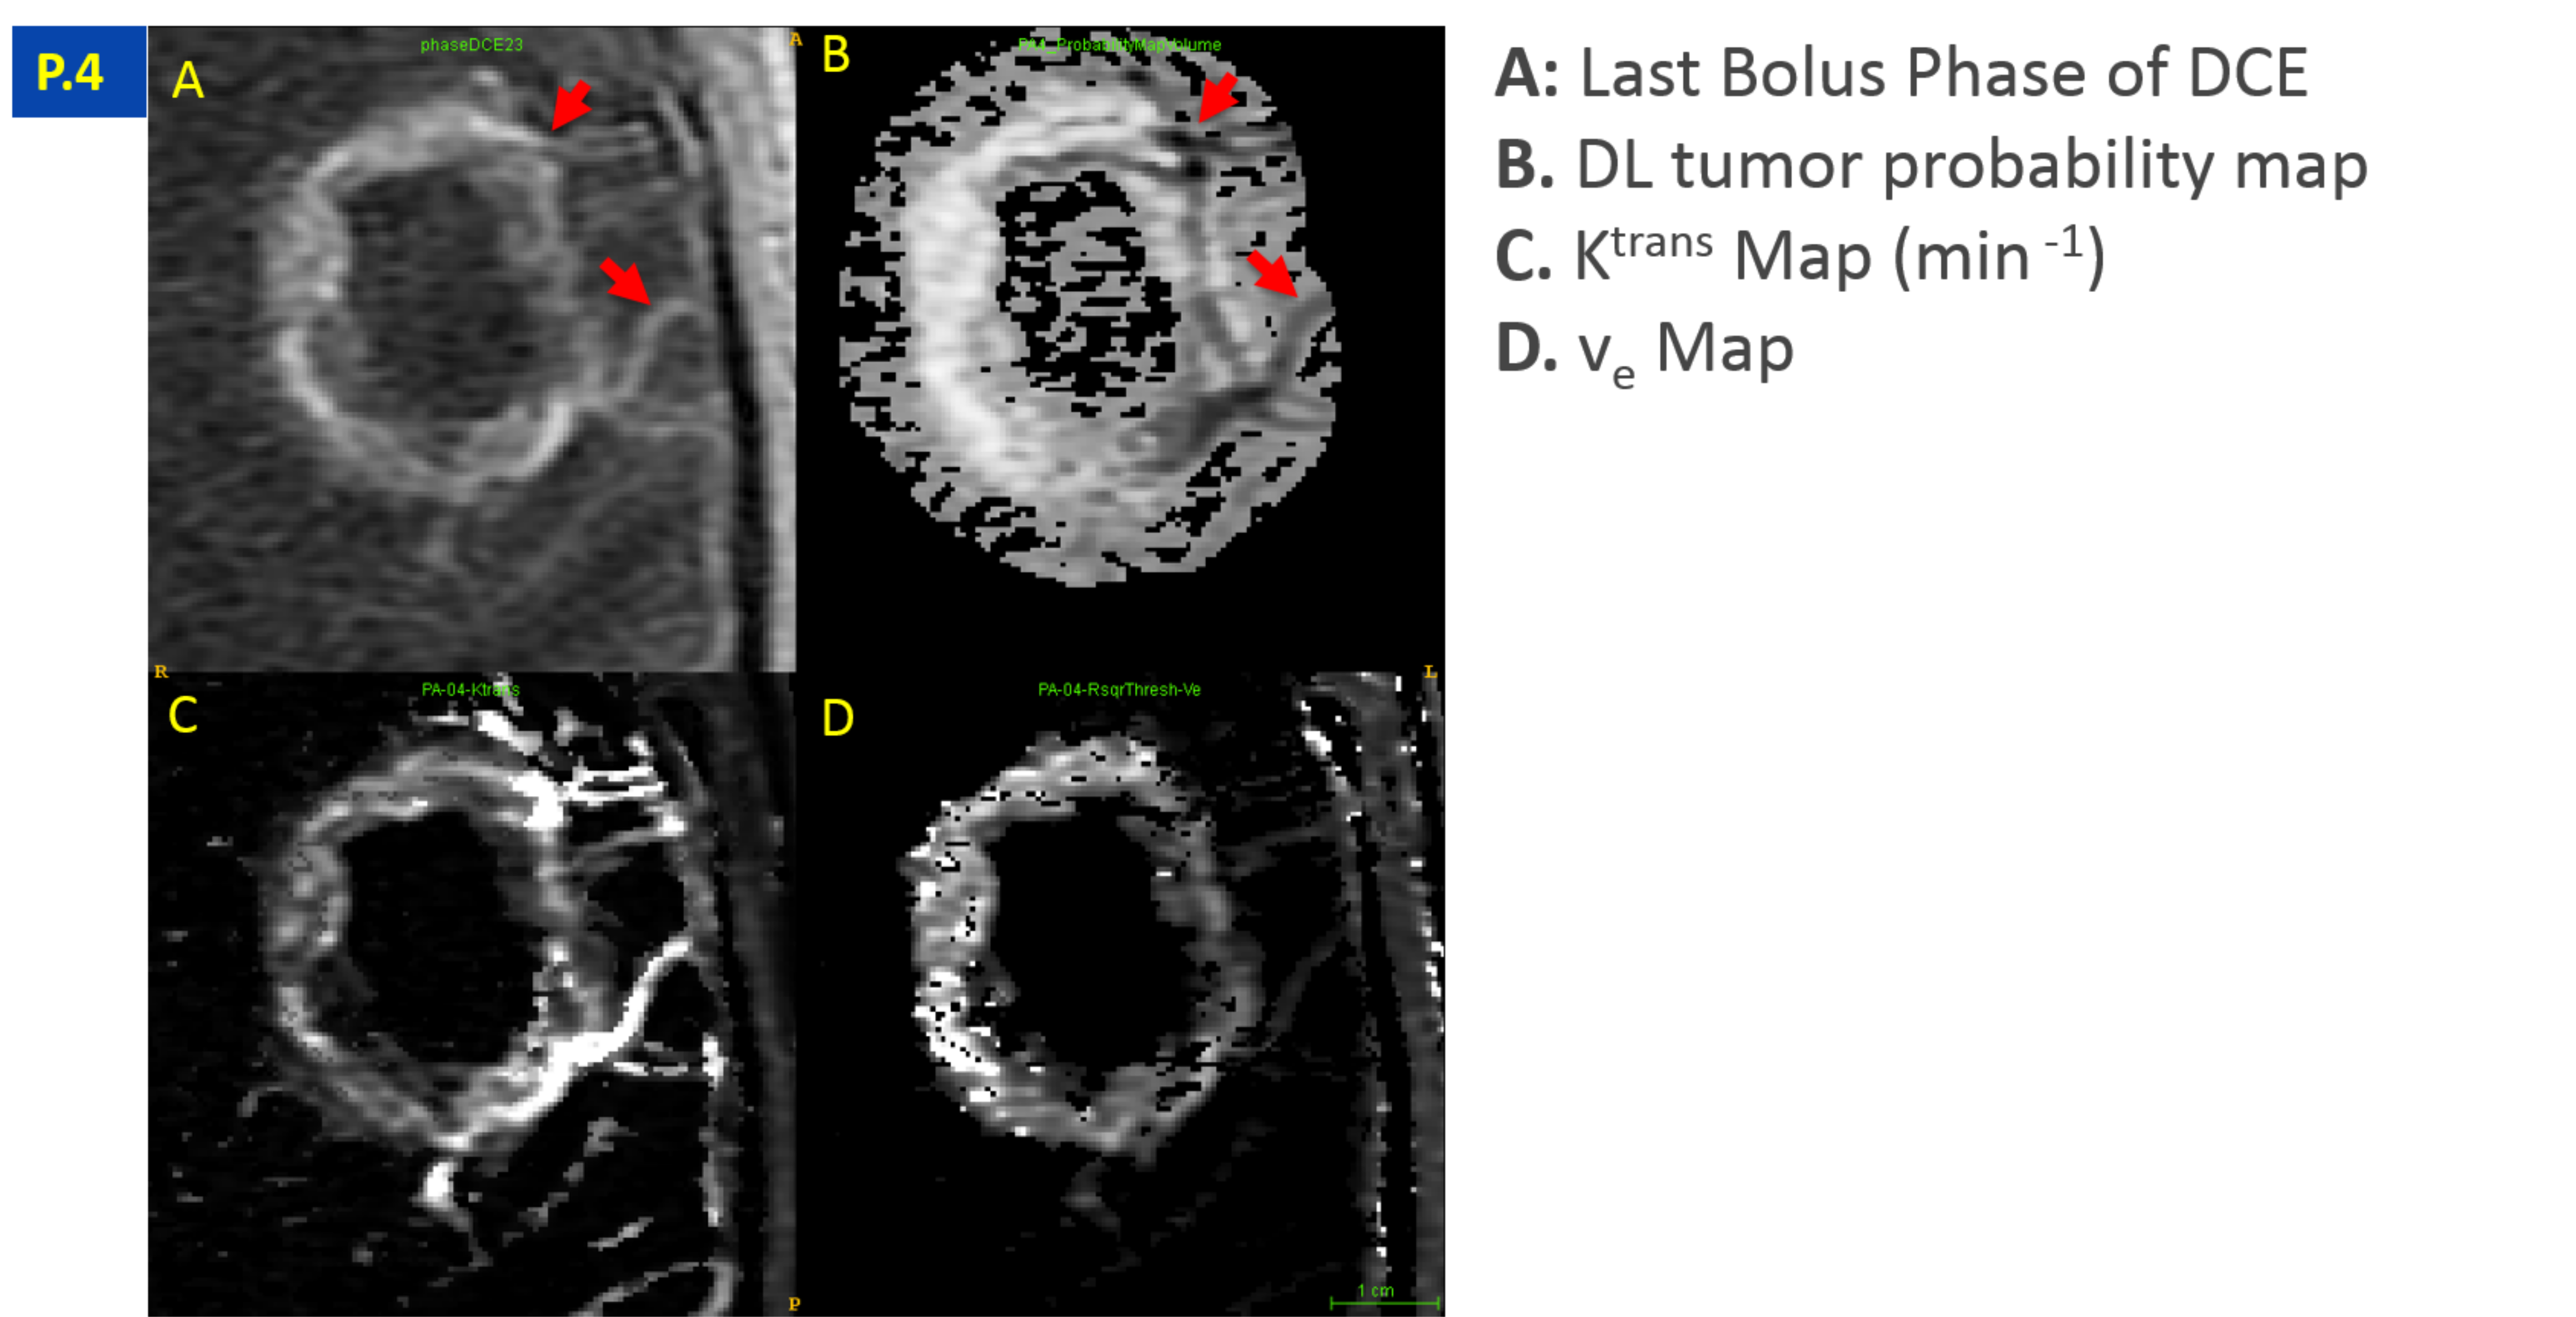
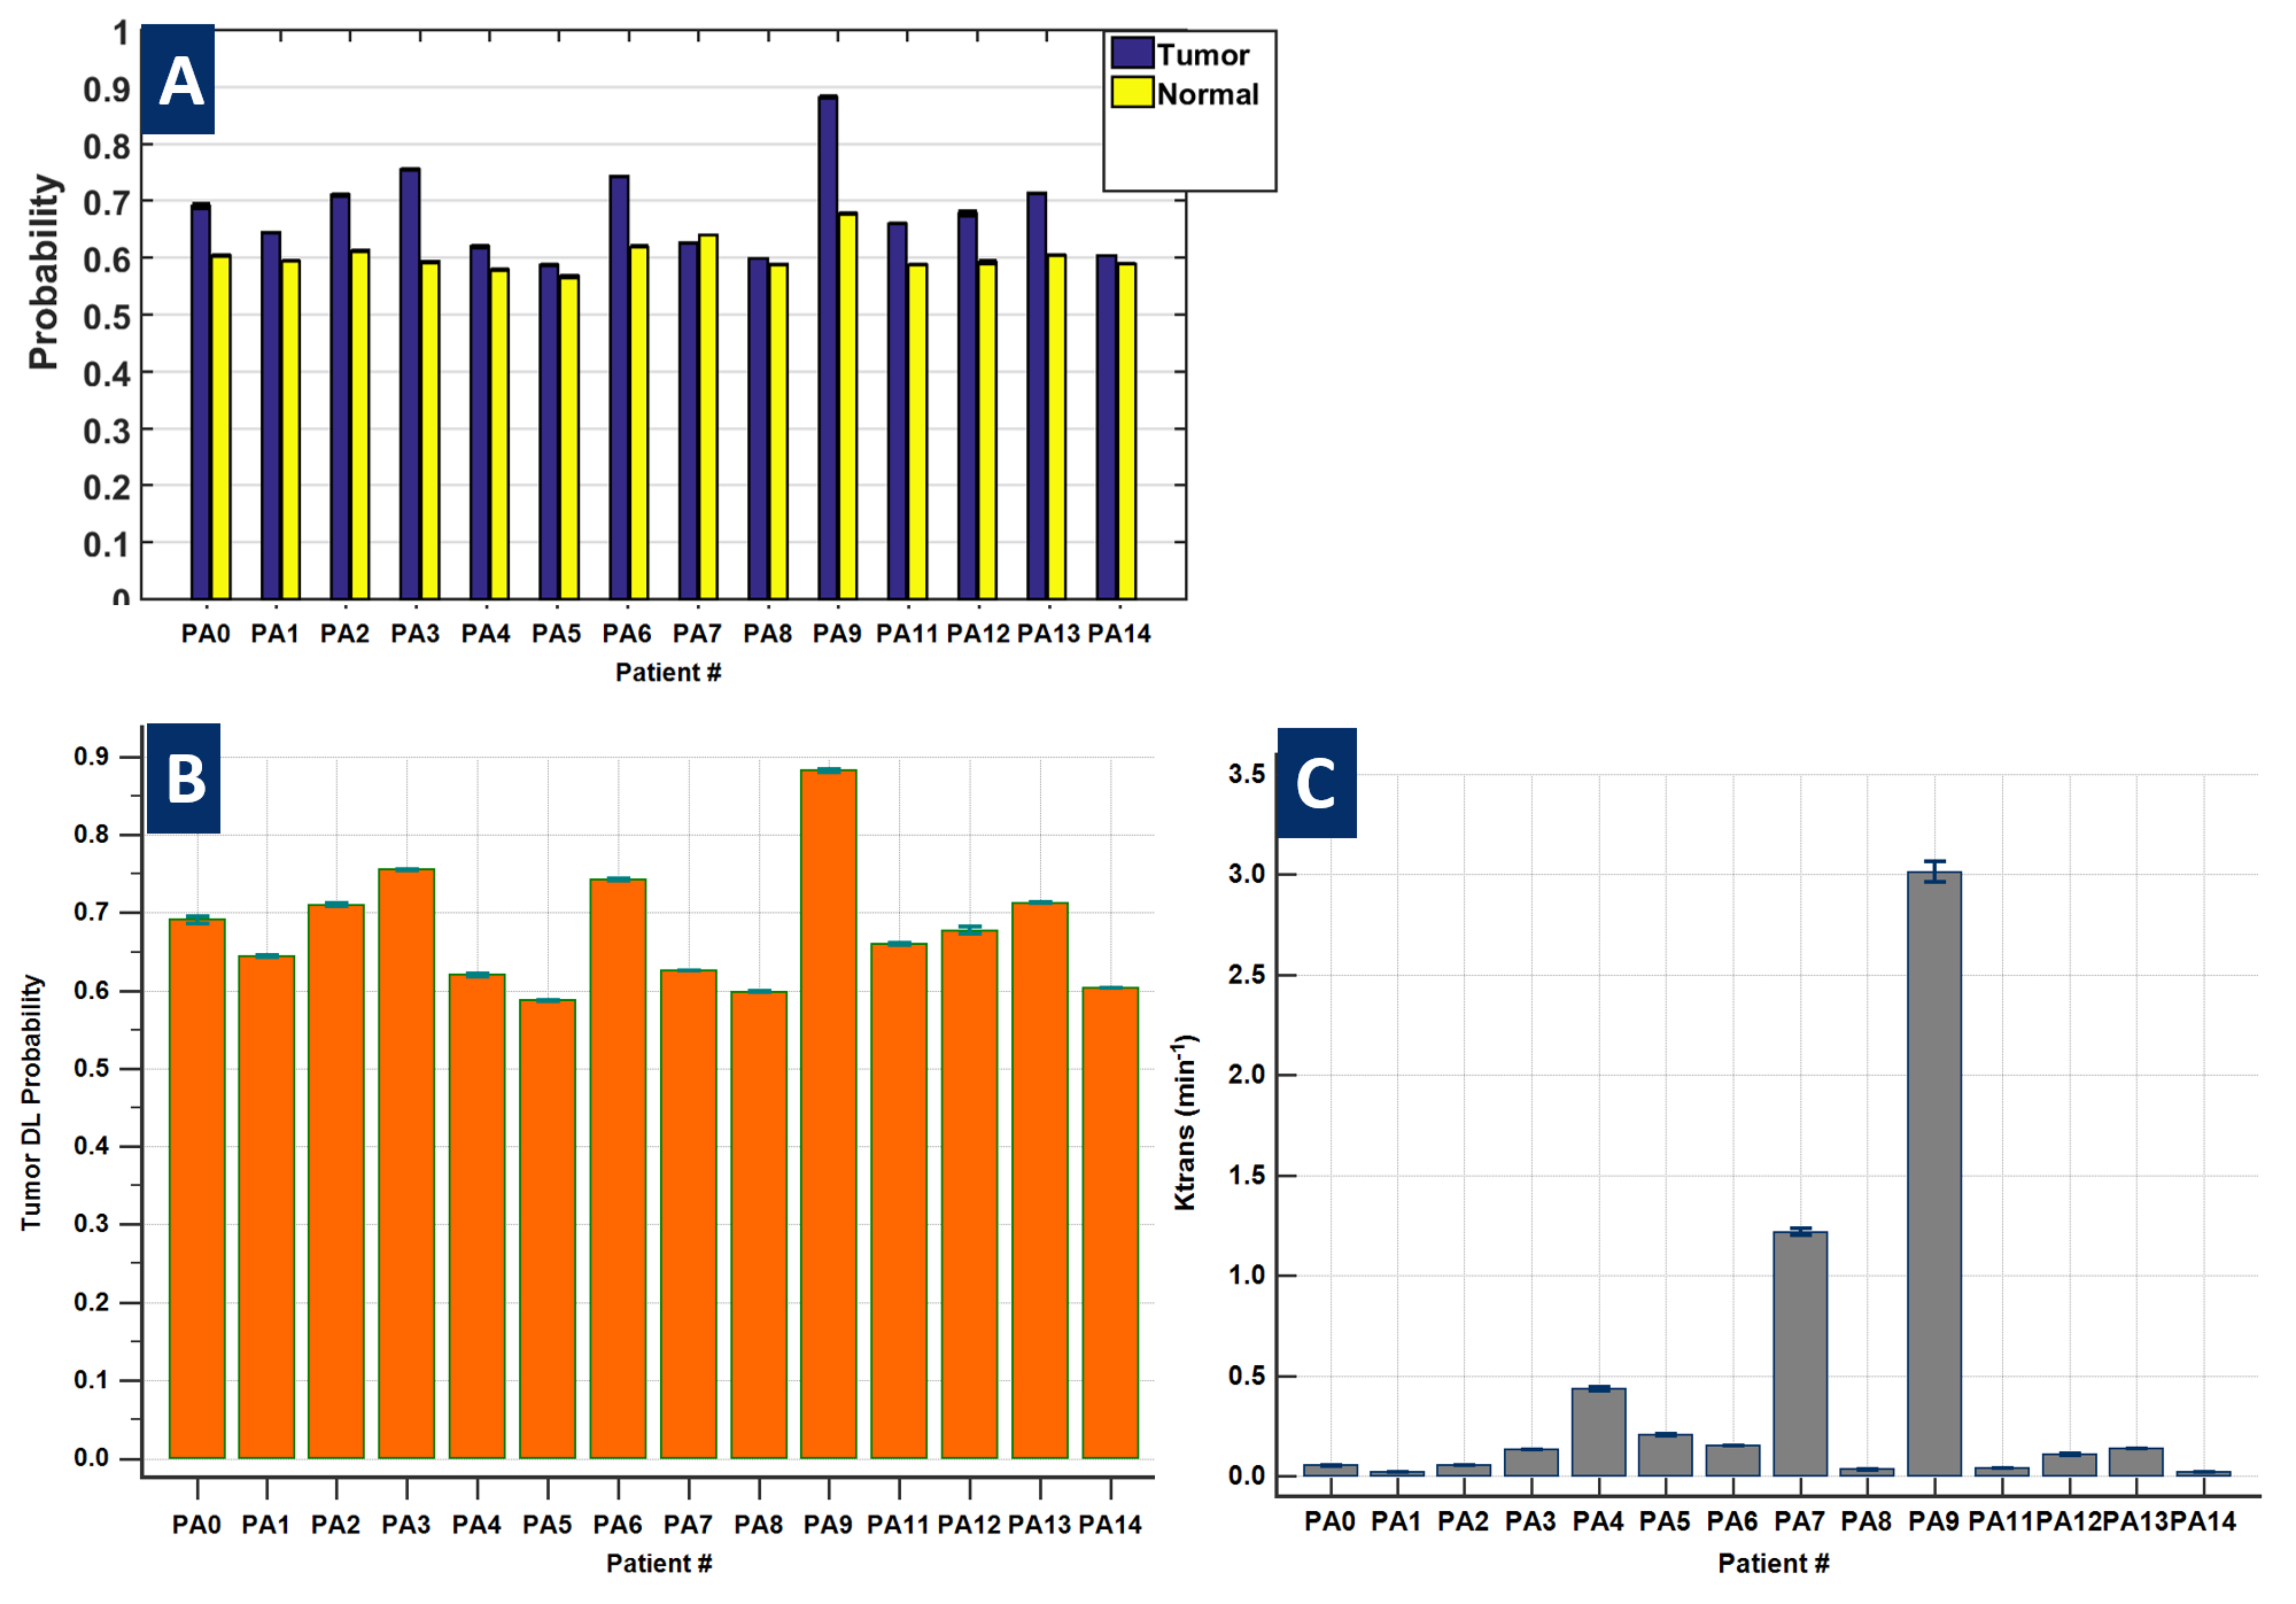
DL model yielded an AUC of 0.87 on validation data. In all the cases, we observed that a cut-off value ~= 0.62 on tumor probability map provided maximum dice overlap coefficient with radiologist marked tumor ROI (Figure 2). Figure 3 shows utility of DL in identifying blood vessels inside tumors. DL provides a consistent probability value for identifying tumor regions (Figure 4), compared to Ktrans maps which show wide fluctuations mostly due to variations in AIF. Figure 5 shows correlation between Ktrans / ve maps with DL learnt probabilities. From 2D histogram plots (Figure 5), the relationship is non-linear in nature due to differences in tissue mappings (e.g. both tumors and blood vessels are high in Ktrans while blood-vessels are low probability in DL).Conclusion
We have demonstrated feasibility of using a supervised deep learning method with DCE time-series data to obtain consistent numerical cutoff for tumor regions. The approach is robust to fluctuations in DCE data due to protocol and patient physiology differences, which typically hinders such a classification with PK maps in clinical practice.Acknowledgements
No acknowledgement found.References
1. Connor JPB et.al; British Journal of Cancer (2007) 96, 189–195.
2. Daniel BL, et.al, Radiology 209(2):499-509 , 1998.
3. Sourbron SP, Buckley DL, NMR Biomed. 2013; 26: 1004–1027
4. https://www.rsna.org/uploadedFiles/RSNA/Content/Science_and_Education/QIBA/DCEMRI_Quantification_Profile_v1%200-PubliclyReviewedVersion%208-8-12.pdf
5. Korporaal JG, Magnetic Resonance in Medicine 66:1267–1274 (2011)
6. J. Arevalo-Perez, AJNR 2015 36: 2256-2261
7. Huang W et.al; Translational Oncology Vol. 7, No. 1, 2014
8. Wu H, Proceedings of the 3rd MICCAI Workshop on Breast Image Analysis, 2015 p 73-80
9. 10th Intl. Conf. on Machine Learning and App., 2011, DOI 10.1109/ICMLA.2011.38
10. Shanbhag DD et al; Procc. of 20th ISMRM, 2012, p. 3524
11. Johnson LM et.al; Nature Reviews Clinical Oncology, Nature Reviews Clinical Oncology 11, 346–353 (2014)
Figures