0625
Effects of AIF Quantification Variations on Shutter-Speed Pharmacokinetic Modeling of Prostate DCE-MRI Data: A Multicenter Data Analysis Challenge, Part II1Oregon Health & Science University, Portland, OR, United States, 2Brigham and Women's Hospital, 3GE Global Research, 4Icahn School of Medicine at Mt Sinai, 5University of Michigan, 6Medical College of Wisconsin, 7University of Pittsburgh, 8University College, 9Vanderbilt University, 10Massachusetts General Hospital, 11University of Washington, 12The University of Texas at Austin
Synopsis
Prostate tumor DCE-MRI data sets from 11 patients were shared among nine institutions, which determined AIFs using site-specific methods. The managing center performed pharmacokinetic data analysis using the Shutter-Speed model and these AIFs, and their scaled variants obtained with the reference-tissue method. Among the estimated parameters, Ktrans has the highest whereas τi has the lowest variability due to AIF uncertainty. The use of reference-tissue-adjusted AIFs reduces parameter variations. kep and τi are nearly insensitive to AIF scaling, suggesting that they may be robust imaging biomarkers in multicenter DCE-MRI trials where accurate and consistent AIF determination may be unattainable across sites.
INTRODUCTION
Uncertainty in determination of arterial input function (AIF) is a major source of error in parameters derived from pharmacokinetic (PK) modeling of dynamic contrast-enhanced (DCE) MRI data1. In Part I of a multicenter data analysis challenge2, using the standard Tofts model (TM), we have shown different extents of variabilities in the estimated PK parameters in prostate cancer due to variations in AIF determination, and demonstrated the reference-tissue method as a potential solution for reducing AIF-induced parameter variations. Here we report the results from Part II of this challenge employing the Shutter-Speed model (SSM) for PK analysis, which takes into account intercompartmental water exchange kinetics3,4.METHODS
DCE-MRI data were collected from 11 patients with prostate cancer at one center and shared with eight other centers within the Quantitative Imaging Network (QIN)2. The data acquisition details have been reported2. Each of the nine centers determined individual AIFs directly from the DCE-MRI data with its site-specific method (automated, semi-automated, manual, etc.)2 and submitted them to the managing center, which then performed DCE-MRI PK modeling using an SSM version accounting for cross cell membrane water exchange3. A previously published population AIF5 was also included in the analysis for comparison. In addition, a reference-tissue (obturator muscle in this study) method6 was used by the managing center to adjust amplitudes of all individual AIFs and generate a second set of “scaled” AIFs. This resulted in a total of twenty sets of PK parameters for each subject, which were then grouped as those derived with unadjusted AIFs and those with reference-tissue adjusted AIFs. To ensure variations in derived parameters were from AIF variations only, all other inputs including tumor ROI definition and pre-contrast T1 were kept the same in model fitting with different AIFs. Mean tumor values of the PK parameters, Ktrans, ve, kep (= Ktrans/ve), and the SSM-unique τi (mean intracellular water lifetime), were calculated by averaging voxel values within the tumor ROI. To assess agreements and variations of the PK parameters within each of the two AIF groups, within-subject coefficient of variation (wCV) and intra-class correlation coefficient (ICC) were computed.RESULTS
As an example of parameter variations due to AIF determination variations, Fig. 1 shows colored Ktrans (left) and τi (right) maps of a prostate tumor from one patient, obtained by SSM analysis using unadjusted AIFs measured by the 9 centers. Substantial variations in the magnitude of individual voxels can be seen among the Ktrans maps, while the variations among the τi maps are less noticeable. It is interesting to note that, for both parametric maps (and for ve and kep maps as well; not shown), the voxel distribution patterns are quite similar among the maps generated with different AIFs despite the variations in the voxel magnitude.
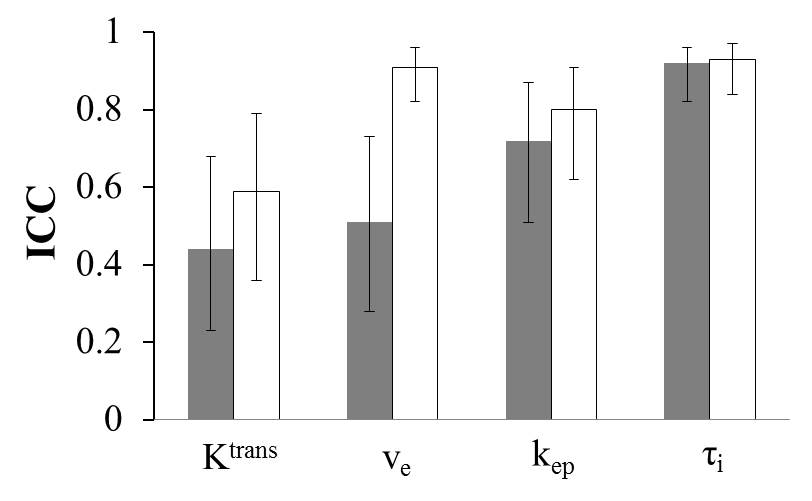
Fig. 2 shows the wCV column graph for the tumor mean Ktrans, ve, kep, and τi parameters obtained with the unadjusted (grey) and adjusted (white) AIFs, whereas Fig. 3 shows the corresponding ICC column graph. For parameters obtained with unadjusted AIFs, wCV is as high as 0.57 for Ktrans and as low as 0.24 for τi. The use of reference-tissue-adjusted AIFs clearly improves parameter agreement in Ktrans and ve, although the AIF scaling is considerably less influential on kep and τi.
DISCUSSION
The results from this Part II multicenter data analysis challenge are consistent with those from Part I2. Among the three common parameters between the TM and SSM, Ktrans and ve have the largest and smallest variations due to AIF uncertainty, respectively. kep is less sensitive to AIF variation than Ktrans, suggesting that it may be a more robust imaging biomarker of prostate microvasculature than Ktrans. It is important to note that DCE-MRI parameter variations caused by AIF variations are largely systematic, as implied by nearly unchanged parameter distribution patterns among parametric maps obtained with different AIFs. Adjustment of AIF amplitude using the reference-tissue approach offers a potential solution to reduce parameter variations caused by variations in AIF determination. However, this approach is more effective for Ktrans and ve than kep and τi. The relative insensitivity of kep and τi to changes in AIF amplitude is in agreement with a recent simulation study7. There is recent evidence suggesting that τi may be an imaging biomarker of metabolic activity8 and useful for evaluation of breast cancer response to chemotherapy9. In a multicenter DCE-MRI trial setting, kep and τi can potentially serve as the imaging biomarkers of choice when accurate and consistent AIF determinations may be problematic across individual sites.Acknowledgements
Grant Support: NIH U01-CA154602, U01-CA151261, U01-CA183848, U01-CA154601, 5U01-CA148131, U01-CA176110, U01-CA172320, U01-CA142565, U01-CA166104, U01-CA140230.References
-
Khalifa F, et al. Med Phys 2014;41:124301.
-
Huang W, et al. Tomography 2016;2:56-66.
-
Yankeelov TE, et al. Magn Reson Med 2003;50:1151-1169.
-
Li X, et al. Magn Reson Med 2005;54:1351-1359.
-
Parker GJ, et al. Magn Reson Med 2006;56:993-1000.
-
Li X, et al. J Magn Reson 2012;218:77-85.
-
Li X, et al. J Magn Reson 2016;269:104-112.
-
Springer CS, et al. NMR Biomed 2014; 27:760-773.
-
Tudorica A, et al. Transl Oncol 2016;9:8-17.
Figures
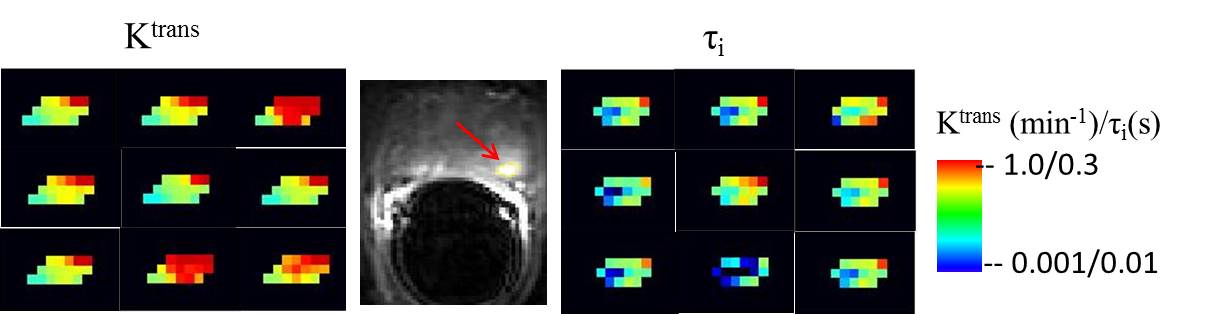
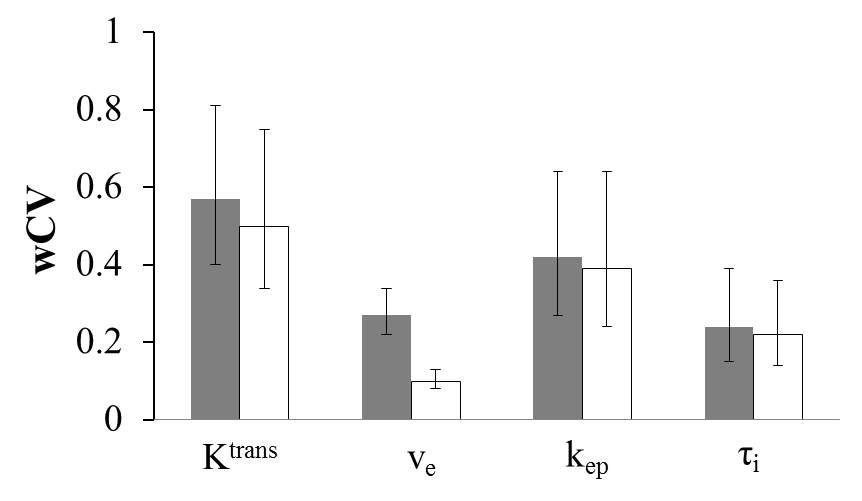
Fig.2. Column graph of wCV for the tumor mean Ktrans, ve, kep, and τi parameters obtained with the unadjusted (grey) and adjusted (white) AIFs. The 95% confidence interval (CI) for each wCV value is shown as error bars.