0623
Radiomic Texture Features from MR Perfusion images Predicts Pseudoprogression from True Progression in Glioblastoma Patients: A Multi-Institutional Study1Diagnostic Radiology, MD Anderson Cancer Center, Houston, TX, United States, 2Cancer Systems Imaging, MD Anderson Cancer Center, Houston, TX, United States, 3Neuroradiology, University of Southern California Keck Medical Center, Los Angeles, CA, United States, 4Neuroradiology, Baylor College of Medicine, Houston, TX, United States, 5Neurosurgery, Baylor College of Medicine, Houston, TX, United States
Synopsis
Response assessment criteria, such as RANO, struggle to distinguish between true progression and pseudoprogression. In this work we evaluated the performance of radiomic texture features extracted from MR perfusion images (Dynamic contrast enhancement (DCE) and Dynamic susceptibility contrast (DSC)) in discriminating true progression from pseudoprogression. Using a large multi-institutional cohort, we demonstrated that changes in texture features of perfusion maps (DCE and DSC) can be effective predictors of progressive disease. We present a noninvasive, complimentary method that is directly applicable in clinical setting and can assist physicians in diagnosis and therapy planning.
PURPOSE
Pseudoprogression (PsP) is an inflammatory response associated with radiation and necrotic induced changes reflective of treatment, appearing as areas of increase enhancement on postcontrast T1-weighted images1. Response assessment criteria, such as MacDonald and RANO, struggle to distinguish between true progression and PsP, as they rely on the size of the enhancing tumor component. Advanced imaging techniques (MR perfusion, MR diffusion) have been proposed as an alternative way of distinguishing between treatment-related radiation effect and progressive disease (PD). However, the outcome of such studies underscores the need for novel tools to distinguish between these2. Heterogeneity is an important feature of malignant tumors, thus, the utility of image texture analysis has been increasingly investigated for cancer diagnosis and therapeutic monitoring. Results from a recent study of 22 glioblastoma (GBM) patients indicated that texture features extracted from conventional MRI might be useful for prediction of therapy response3. In this study, we sought to evaluate the utility of radiomic texture analysis of MR perfusion (Dynamic contrast enhancement (DCE) as well as Dynamic susceptibility contrast (DSC)) maps in differentiating PsP from PD.METHODS AND MATERIALS
Patients: A total of 98 patients from The University of Texas MD Anderson Cancer Center (N=61), Baylor College of Medicine (N=7) and University of Southern California-Los Angeles (N=30) were included in this multi-institutional IRB-approved study. All had pathological confirmation to include 78 patients with PD and 20 patients with PsP.
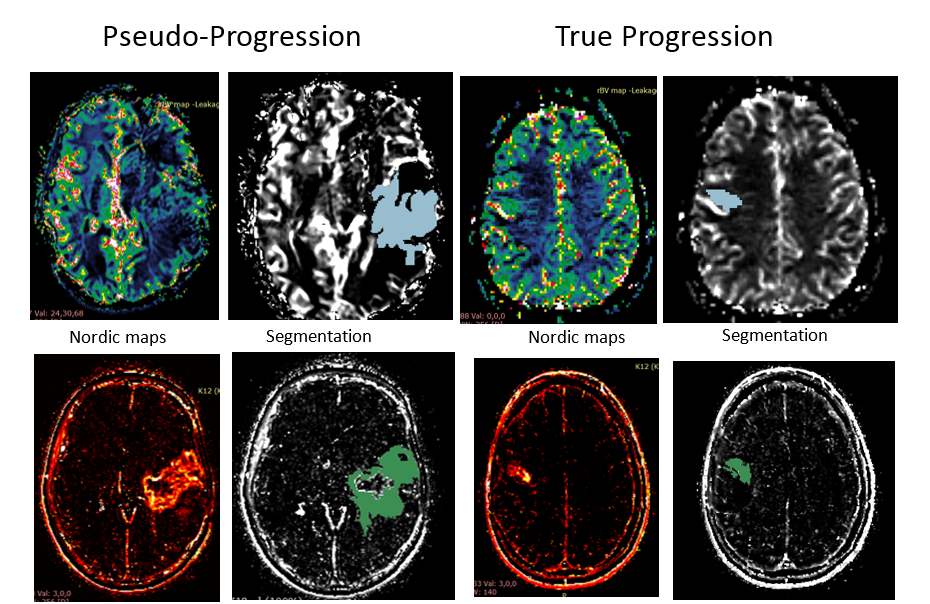
Radiomic Analysis: All patients underwent DSC and DCE perfusion MRI as part of their routine clinical care. Images were analyzed using Nordic ICE 2.3 (NordicNeuroLab); rCBV and Ktrans maps were obtained. Subsequently, an experienced radiologist delineated the entire tumor on DCE and DSC maps using 3D slicer 4.3.1 (http://www.slicer.org) (Figure 1). The extracted 3D region of interest (ROI) parametric maps were imported in the radiomic pipeline. A total of 475 features (10 histogram-based features and 375 higher order texture features) were calculated for each parametric map. Higher order texture features were calculated using two statistical matrices: the Grey Level Co-occurrence Matrix (GLCM; a tabulation of how often different combinations of pixel brightness values occur in an image in a given offset) and Grey Level Run Length Matrix (GLRLM; counting the run length with the same gray level in a given direction)4-7. 20 Haralick features and 11 moments were obtained from the GLCM and GLRML respectively4-7. To account for directionality the mean, variance and range of the features across different directions was calculated4. Finally, different number of gray levels was also considered in the analysis (N=8, 16, 32, 64, 256 grey levels).
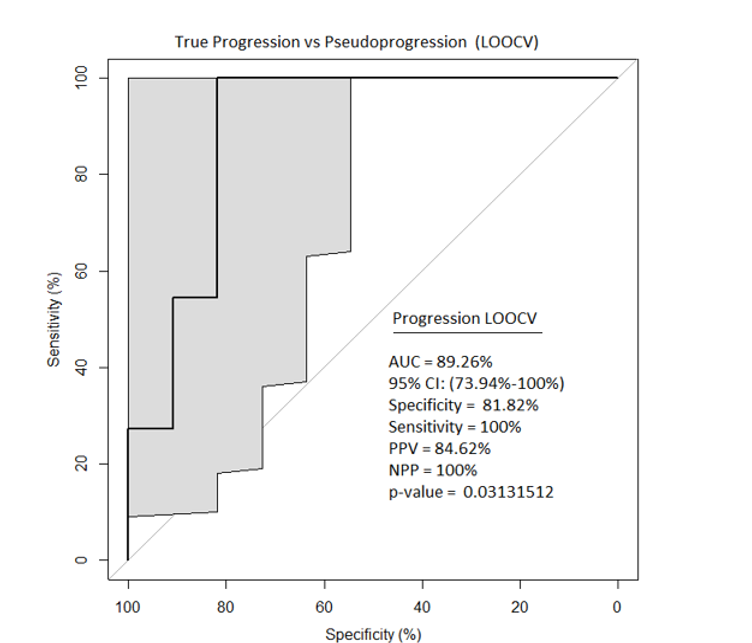
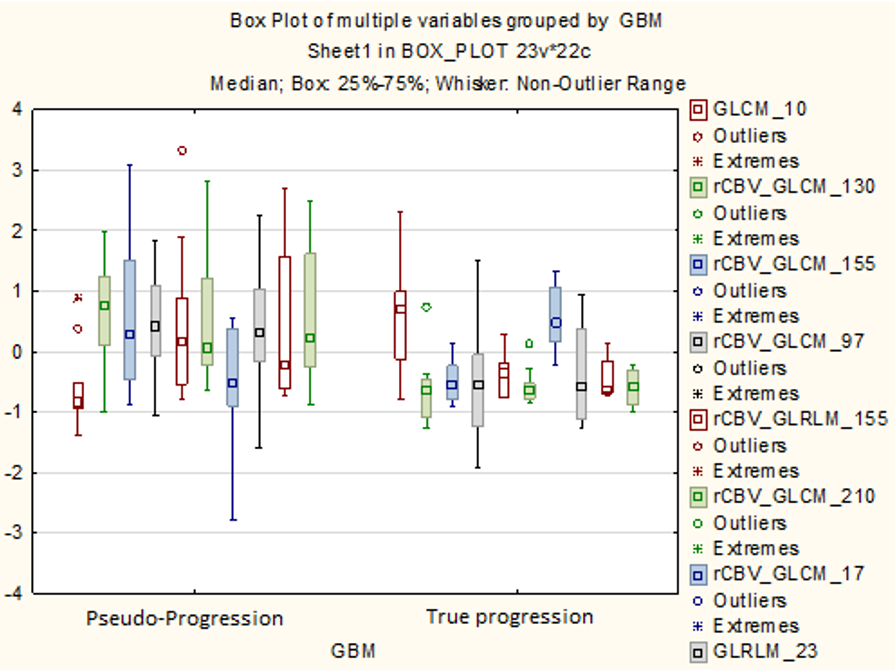
Statistical Analysis: An advanced feature selection method based on Minimum Redundancy Maximum Relevance (MRMR) was used to analyze the feature set and extract core features. Selected features were used to build a Support Vector Machine (SVM) model for prediction of PD versus PsP status. To evaluate the robustness of the estimates made with the SVM models, leave-one-out cross-validation (LOOCV) was conducted on the patient set. Finally, box plots of the 10 most relevant features and probability maps were calculated.
RESULTS
A total of 475 invariant radiomic features were obtained from each map. MRMR identified 50 radiomic features that were further used to build the SVM model. The prediction of progression by using LOOCV was significant with P value=0.03131512. Area Under the Curve (AUC), Sensitivity, Specificity were 89.26%, 81.82% and 100% respectively and the most discriminating features were associated with variance and sum entropy (Figure 2). Box plots of the 10 most relevant features are shown in Figure 3.DISCUSSION/CONCLUSION
This study demonstrates that changes in MR perfusion texture features can discriminate between PsP and PD. Extracted radiomic features showed a discriminatory value for capturing true progression and discriminating it from pseudoprogression, an innate problem in current MRI methodologies. To our knowledge, this is the first large-scale study to show that MR perfusion radiomic analysis could be used to predict therapeutic response in GBM. Further validation, as well as a comparative study of radiomic analysis of MR perfusion maps and conventional MR images would be valuable to determine which approach is more effective, or if there is added value in combining the two approaches.Acknowledgements
John S. Dunn Sr. Distinguished Chair in Diagnostic Imaging Fund
MD Anderson Cancer Center startup funding
Radiological Society of North America Scholar Grant (RSCH11506)
MD Anderson’s Cancer Center Support Grant (CA016672)
References
1. Rees JH, Smirniotopoulos JG, Jones RV, et al. Glioblastoma multiforme: radiologic-pathologic correlation. Radiographics. 1996;16(6):1413-38.
2. Young RJ, Gupta A, Shah AD, et al. MRI perfusion in determining pseudoprogression in patients with glioblastoma. Clinical imaging. 2013;37(1):41-49.
3. Chen X, Wei X, Zhang Z, et al. Differentiation of true-progression from pseudoprogression in glioblastoma treated with radiation therapy and concomitant temozolomide by GLCM texture analysis of conventional MRI. Clin Imaging. 2015;39(5)775-80.
4. Haralick RM. Statistical and structural approaches to texture. Proceedings of the IEEE. 1979;67(5):786-804.
5. Soh L and Tsatsoulis C. Texture Analysis of DAR Sea Ice Imagery Using Gray Level Co-Occurrence Matrices. IEEE Trans. Geosci. Remote Sensing, 1999;37:780-795.
6. Clausi DA. An analysis of co-occurrence texture statistics as a function of grey level quantization, Can. J. Remote Sensing. 2002;28:45-62.
7. Galloway MM. Texture analysis using gray level run lengths. Comput. Graphics Image Process., 1975;4:172–179.
Figures