0621
Robust arterial input functions by fitting the complex DCE-MRI signal: a test-retest study in prostate cancer1Department of radiation oncology, The Netherlands Cancer Institute, Amsterdam, Netherlands, 2Department of radiation oncology, Imaging Division, University Medical Center, Utrecht, Netherlands, 3Department of radiology, The Netherlands Cancer Institute, Amsterdam, Netherlands
Synopsis
The arterial input function is still one of the main problems for quantitative DCE analysis. In this study, we show that the repeatability of individual AIFs improve by using the complex signal instead of magnitude or phase signal alone by using test-retest DCE-MRI data of prostate cancer. This will eventually result in an accurate quantitative DCE-MRI analysis by including patient inter and intra-variability.
Introduction
Large variations in pharmacokinetic parameter values in dynamic contrast-enhanced (DCE-) MRI data, such as Ktrans, are present among studies and institutions1–3. One of the main contributors to these variations is the arterial input function (AIF). AIFs are extracted from either the magnitude or the phase part of the DCE-MRI signal. However, the peak height is typically underestimated in the magnitude signal, whereas the phase signal may suffer from low precision at low CA (contrast agent) concentrations or phase drift4,5. Recently a method has been proposed in which the complex signal is used such that the advantageous properties of magnitude and phase are combined6. In this study, we investigate the repeatability of this complex method compared to AIFs extracted from magnitude or phase signal using test-retest DCE-MRI data of prostate cancer patients.Methods
Twelve biopsy-proven prostate cancer patients (mean 66, range 54–71 years) underwent a multi-parametric MRI exam twice on a 3T MRI system (which was upgraded during the trial, new parameters denoted in square brackets below). All patients gave written informed consent for participation in this study.
The DCE data were acquired with a 3D spoiled gradient echo sequence using a cardiac and endorectal coil (FOV 360x518.4x60mm3, acquired voxel size = 1.8x1.8x3mm [2.3x2.3x3mm]; reconstructed voxel size = 1.2x1.2x3mm [1.3x1.3x3mm]; TR/TE = 4.0/1.9ms [5.0/1.9ms]; flip angle = 20o; parallel imaging factor = 4; temporal resolution = 2.6s [2.9s]; acquisition time = 5min). At the 2nd dynamic series, gadolinium (15ml, 0.5M Dotarem, Guerbet, France) was injected with an injection rate of 3ml/s, followed by a 30ml saline flush.
ROIs in the femoral arteries of both sides were manually delineated in a straight part of the artery avoiding the bifurcation. The first three cranial slices were avoided for possible inflow artefacts. AIFMAGN was determined using Schabel’s method7, with a T1 value of 1664ms8. AIFPHASE was calculated using the method described by Korporaal et al.1. AIFCOMPLEX was determined by fitting the phase and magnitude signal together in the complex plane6, including a weighted least square fit to reduce phase drift effects. In all cases AIFs were first defined for the left and right artery separately and then averaged. All AIFs were corrected for hematocrit value by a factor of 1.189.
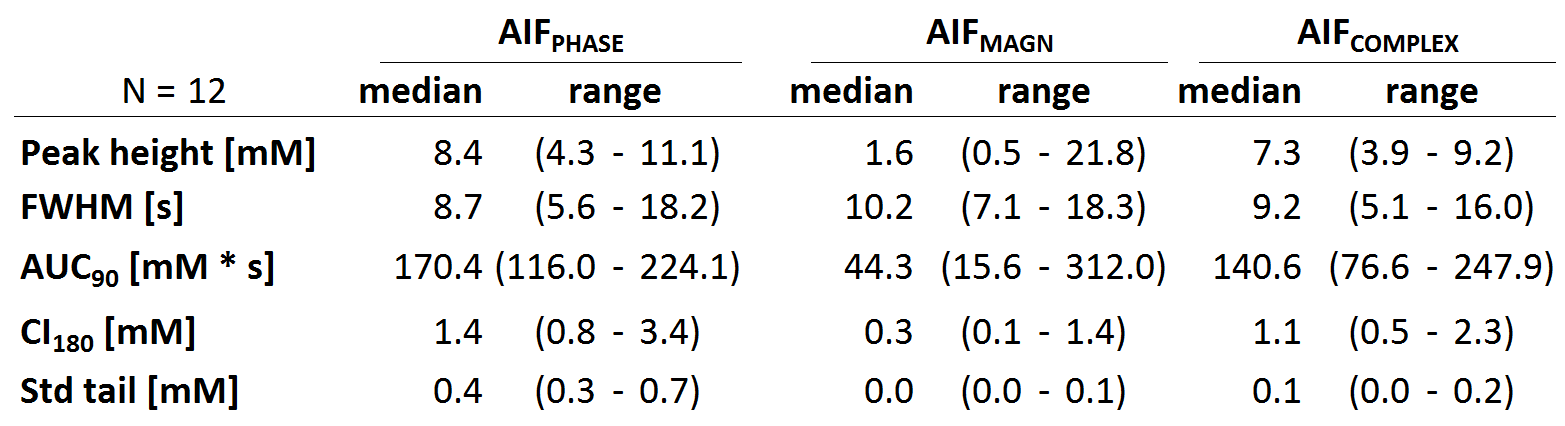
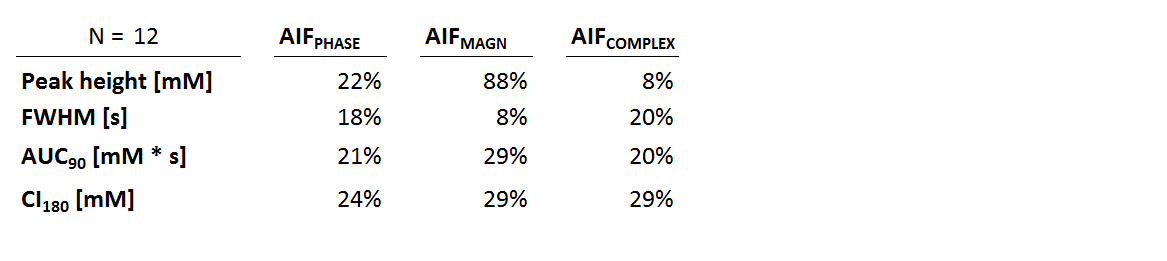
The peak height, the full-width at half-maximum (FWHM), AUC of the first 90 seconds (AUC90), the height of the tail at 180 seconds (CI180, averaged window of 52s) and the standard deviation of the tail (Std tail) were calculated for all AIFs. To estimate the repeatability of the different fitting methods, the within-subject coefficient of variation was calculated (wCV)10.
Results
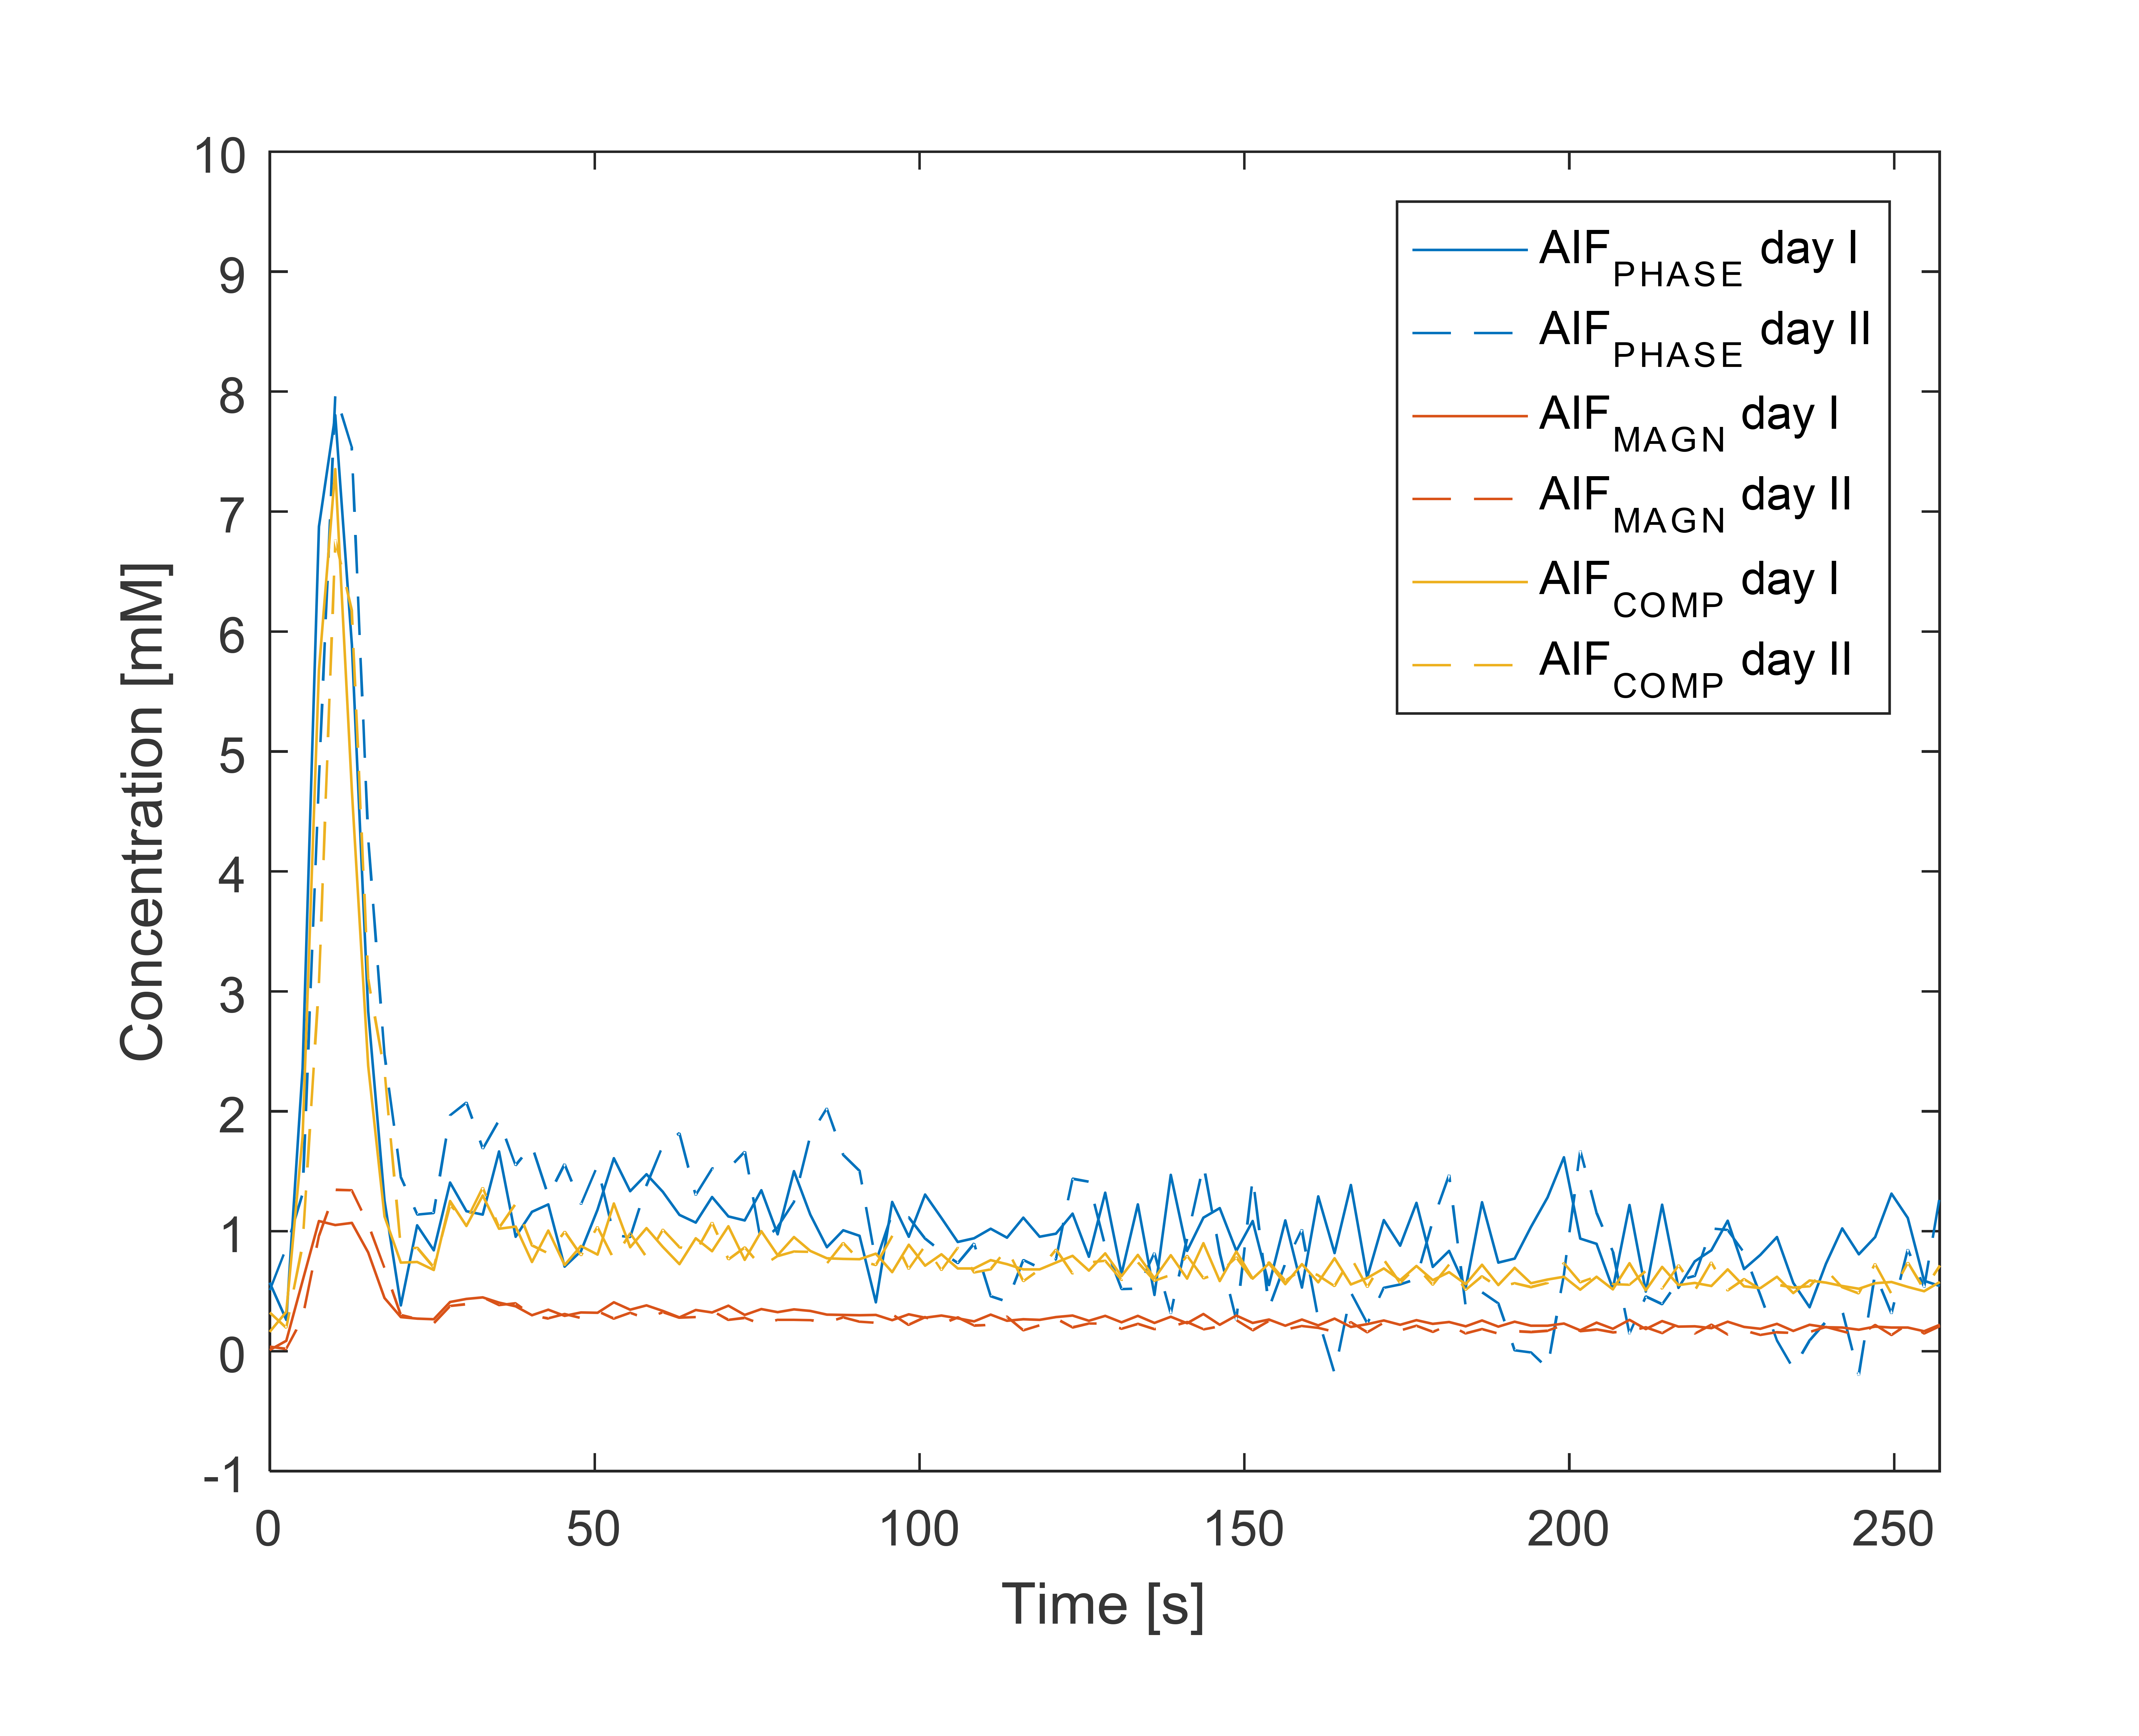
Median curve characteristics from all patients showed similar peak heights and AUC90 for AIFCOMPLEX and AIFPHASE (Table 1), whereas the peak height and AUC90 was lower for AIFMAGN. FWHM was comparable among all three methods. The CI180 of AIFCOMPLEX was lower (1.1mM) than for AIFPHASE (1.4mM), but higher than AIFMAGN. The standard deviation in the tail in AIFPHASE (0.4mM) was larger compared to AIFCOMPLEX (0.1mM) and AIFMAGN (0.03mM). This is illustrated with the example in Fig. 1.
When comparing the measurements of two different days, the peak height has a lower wCV for AIFCOMPLEX compared to AIFMAGN and AIFPHASE (Table 2). The repeatability of the other curve characteristics is comparable between methods.
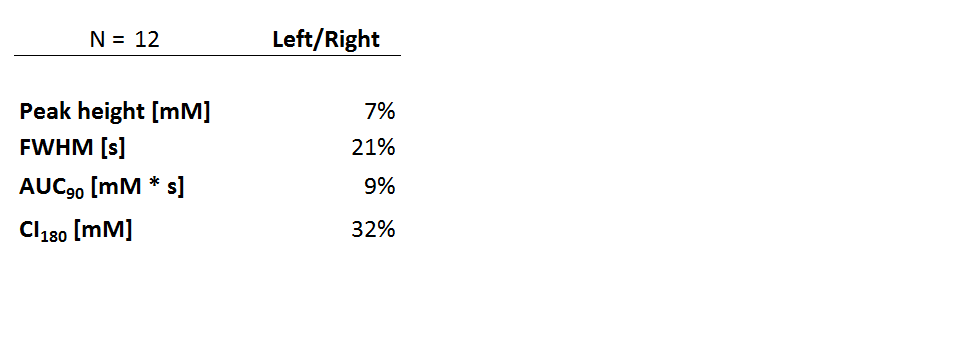
Comparing the first day AIFCOMPLEX between left and right femoral arteries showed high consistency in estimation of the peak height (7%), FWHM (21%) and AUC90 (9%), see Table 3. However, CI180 (32%) had a lower consistency than averaged AIFs.
Discussion and Conclusion
The repeatability of patient-specific AIFs improved by using the complex fitting method compared to magnitude or phase alone. This AIFCOMPLEX method seems to be less sensitive for saturation at high CA concentration, inflow artefacts and noise in the phase data by combining the magnitude and phase part from the DCE-MRI signal. By tackling these MR-specific artefacts, a reliable patient individualized AIF could be achieved as proposed by Simonis et al.6. This is illustrated by the high consistency obtained for left and right AIFs. In the original paper a weighted least squares method was used to reduce the effect of phase drift6. However, phase drift was less present in our data. AIFCOMPLEX will eventually result in an accurate quantitative DCE-MRI analysis by including patient inter and intra-variability (in longitudinal setting). However, the influence on the pharmacokinetic parameters (e.g. Ktrans) needs to be determined.Acknowledgements
This study was part of the DR THERAPAT project (FP7-ICT-2011-9, Project No. 600852)References
1. Korporaal JG, Van Den Berg C a T, Van Osch MJP, Groenendaal G, Van Vulpen M, Van Der Heide U a. Phase-based arterial input function measurements in the femoral arteries for quantification of dynamic contrast-enhanced (DCE) MRI and comparison with DCE-CT. Magn Reson Med. 2011;66(5):1267-1274. doi:10.1002/mrm.22905.
2. Heye T, Davenport MS, Horvath JJ, et al. Reproducibility of dynamic contrast-enhanced MR imaging. Part I. Perfusion characteristics in the female pelvis by using multiple computer-aided diagnosis perfusion analysis solutions. Radiology. 2013;266(3):801-811. doi:10.1148/radiol.12120278.
3. Ng CS, Raunig DL, Jackson EF, et al. Reproducibility of perfusion parameters in dynamic contrast-enhanced MRI of lung and liver tumors: effect on estimates of patient sample size in clinical trials and on individual patient responses. AJR Am J Roentgenol. 2010;194(2):W134-40. doi:10.2214/AJR.09.3116.
4. Haacke EM, Brown RW, Thompson MR, Venkatesan R. Magnetic resonance imaging: physical principles and sequence design. 1999.
5. Williams DF, Wang CM, Arz U. In-Phase / Quadrature Covariance-Matrix Representation of the Uncertainty of Vectors and Complex Numbers. 2004. http://129.6.13.54/ctl/rf-technology/rf_electronics/upload/ComplexRepresentations.pdf.
6. Frank FJ Simonis, Alessandro Sbrizzi, Ellis Beld, Jan JW Lagendijk and CA van den B. Improving the Arterial Input Function in Dynamic Contrast Enhanced MRI by fitting the signal in the complex plane. Proc Intl Soc Mag Reson Med. 2015;23:2373.
7. Schabel MC, Parker DL. Uncertainty and bias in contrast concentration measurements using spoiled gradient echo pulse sequences. Phys Med Biol. 2008;53(9):2345-2373. doi:10.1088/0031-9155/53/9/010.
8. Lu H, Clingman C, Golay X, Zijl PCM Van. Determining the Longitudinal Relaxation Time (T1) of Blood at 3.0 Tesla. 2004;682(September):679-682. doi:10.1002/mrm.20178.
9. Parker G, Buckley D. Tracer kinetic modelling for T1-weighted DCE-MRI. Dyn contrast-enhanced Magn, 2005;(1). http://link.springer.com/content/pdf/10.1007/3-540-26420-5_6.pdf. Accessed July 23, 2014.
10. Bland JM, Altman DG. Measurement error. BMJ. 1996;312(7047):1654. doi:10.1136/bmj.312.7047.1654.
Figures