0617
Diffusion and T2 characterizations in hindbrain and spinal cord in SOD1 mouse model of ALS1Biomedical Imaging, Genentech, South San Francisco, CA, United States, 2Neuroscience, Genentech, South San Francisco, CA, United States, 3Pathology, Genentech, South San Francisco, CA, United States
Synopsis
Amyotrophic lateral sclerosis (ALS) is a devastating neurological disease characterized by motor neuron loss and eventual paralysis and respiratory failure. The SOD1 transgenic mouse model exhibits many aspects of human ALS and is useful for evaluating treatment strategies. MRI of the nervous system can provide the critical insights to motor neuron and upper body functional deterioration in ALS. In this study, we applied T2 and DTI to assess gray and white matter degeneration in the brain and cervical spine in a SOD1 mouse model.
Introduction
Amyotrophic lateral sclerosis (ALS) is a devastating neurological disease characterized by motor neuron loss and eventual paralysis and respiratory failure, where the majority of patients pass away in 2-4 years (1). The SOD1 transgenic mouse model of ALS exhibits many aspects of the human disease and is a useful model for evaluating ALS therapies (2). Studies have assessed the brain and spinal cord in animal models and ALS patients using MRI (3-5). To our knowledge, studies have not evaluated the cervical spinal cord with diffusion and T2-weighted MRI. The cervical spinal cord is important for upper body and respiratory functions, which can help to determine disease progression and outcome of ALS patients (6). In this study, we applied T2 and DTI to assess gray and white matter degeneration in the hindbrain and cervical spine in a SOD1 mouse model.Methods
Animals: SOD1G93A positive mice (n=27, 18 weeks) and SOD1G93A negative littermates (n=16, 18 weeks) were imaged. During imaging, animals were anesthetized under isoflurane, breathing freely, and maintained at 37C.
Imaging: MRI was performed on a Bruker 7T with a volume transmit and cryogenic surface receive coil. A custom in vivo holder was constructed with 3D printing (Stratasys Dimension) to provide secure positioning of the brain and spine. A T2 map covering hindbrain and cervical spinal code was generated with a multi-slice multi-echo sequence with parameters: TR=4s, TE1/spacing/TE8=10/10/80ms, BW=50kHz, matrix=160×160×40, resolution=125×125×400μm3. Two separate DTI scans (single-shot EPI) with individual local shims were used for the hindbrain and spinal cord with parameters: TR=4s, TE=42ms, BW=250kHz, max b-value: 1200s/mm2, gradient directions=20, diffusion time= 21ms, encoding matrix=104×102×20, reconstructed matrix=128×128×20, reconstructed resolution=141×141×400μm3. DTI datasets were processed (7) and used to compute parametric maps: fractional anisotropy (FA), mean diffusivity (MD), axial diffusivity (AD), and radial diffusivity (RD). Data were analyzed using ROIs in the hindbrain (hypoglossal nucleus, nucleus ambiguous, facial nucleus, and trigeminal nucleus) and in the ventrolateral side of cervical spinal cord (C1 to C5 vertebrae).
Histology: Mice were transcardially perfused and fixed 24-48 hours after imaging. Brain and spinal cord sections were embedded in paraffin, stained (H&E and periodic acid-Schiff), and imaged with brightfield microscopy and TEM (brain only).
Results
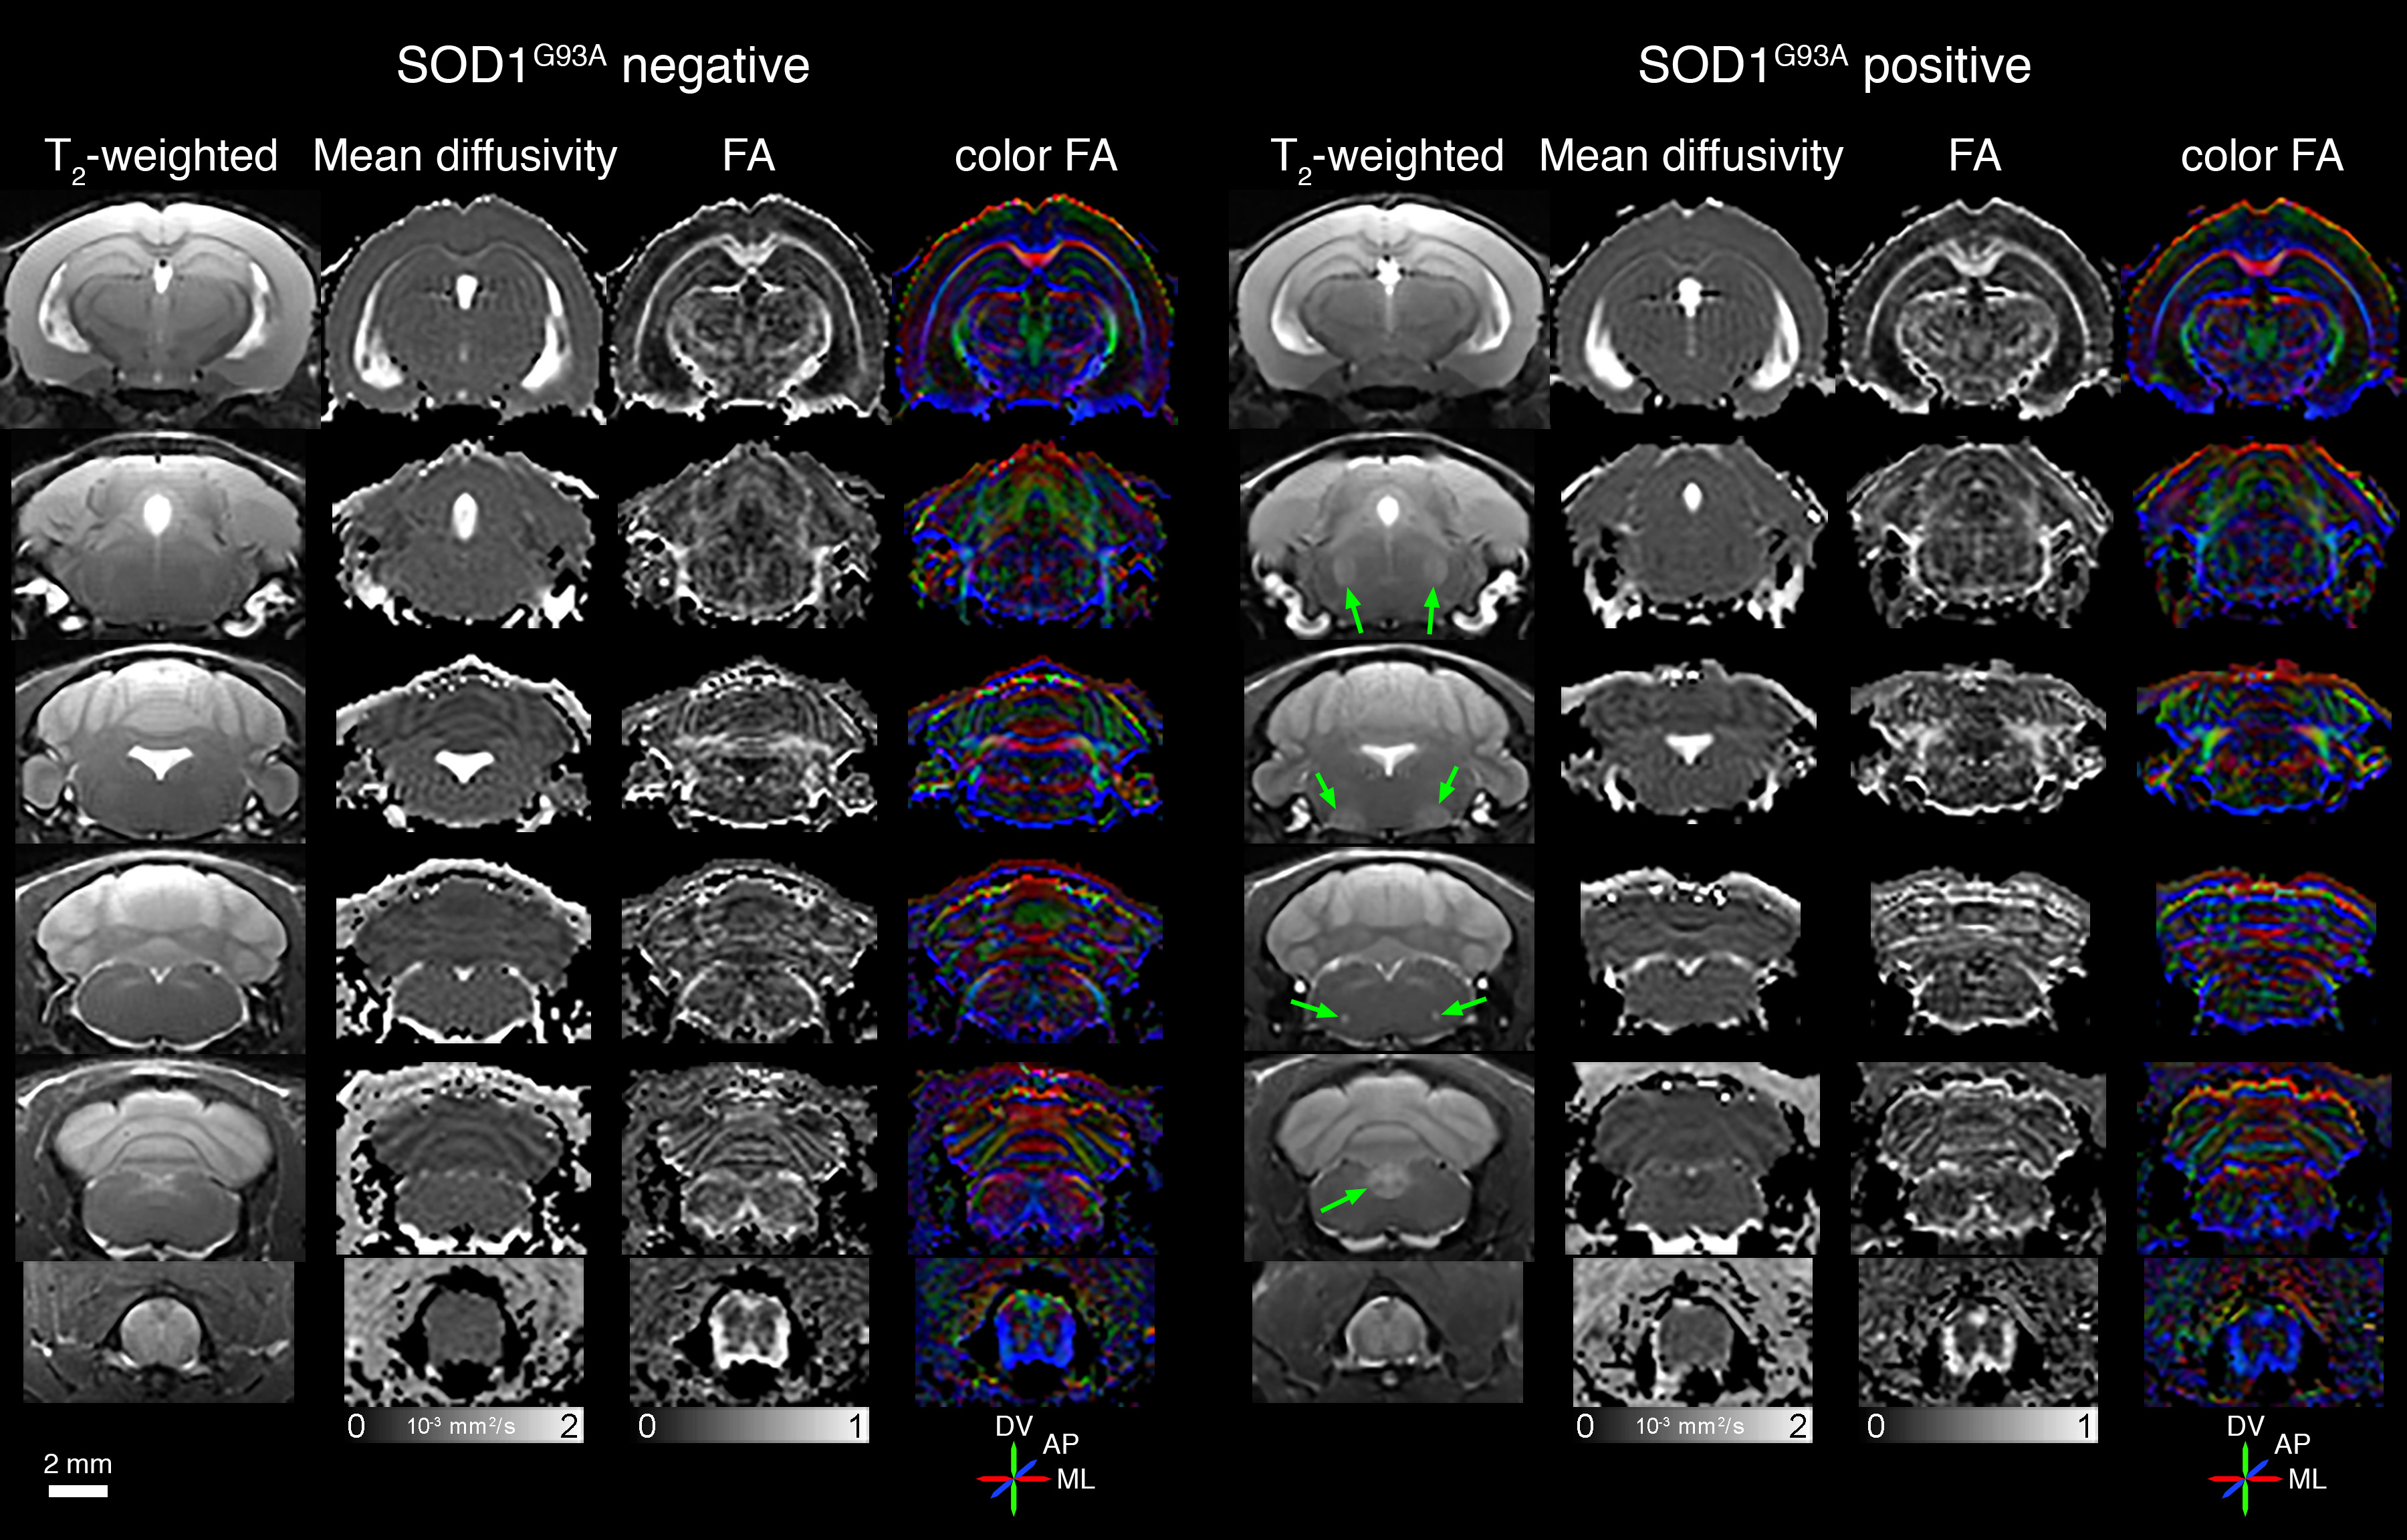
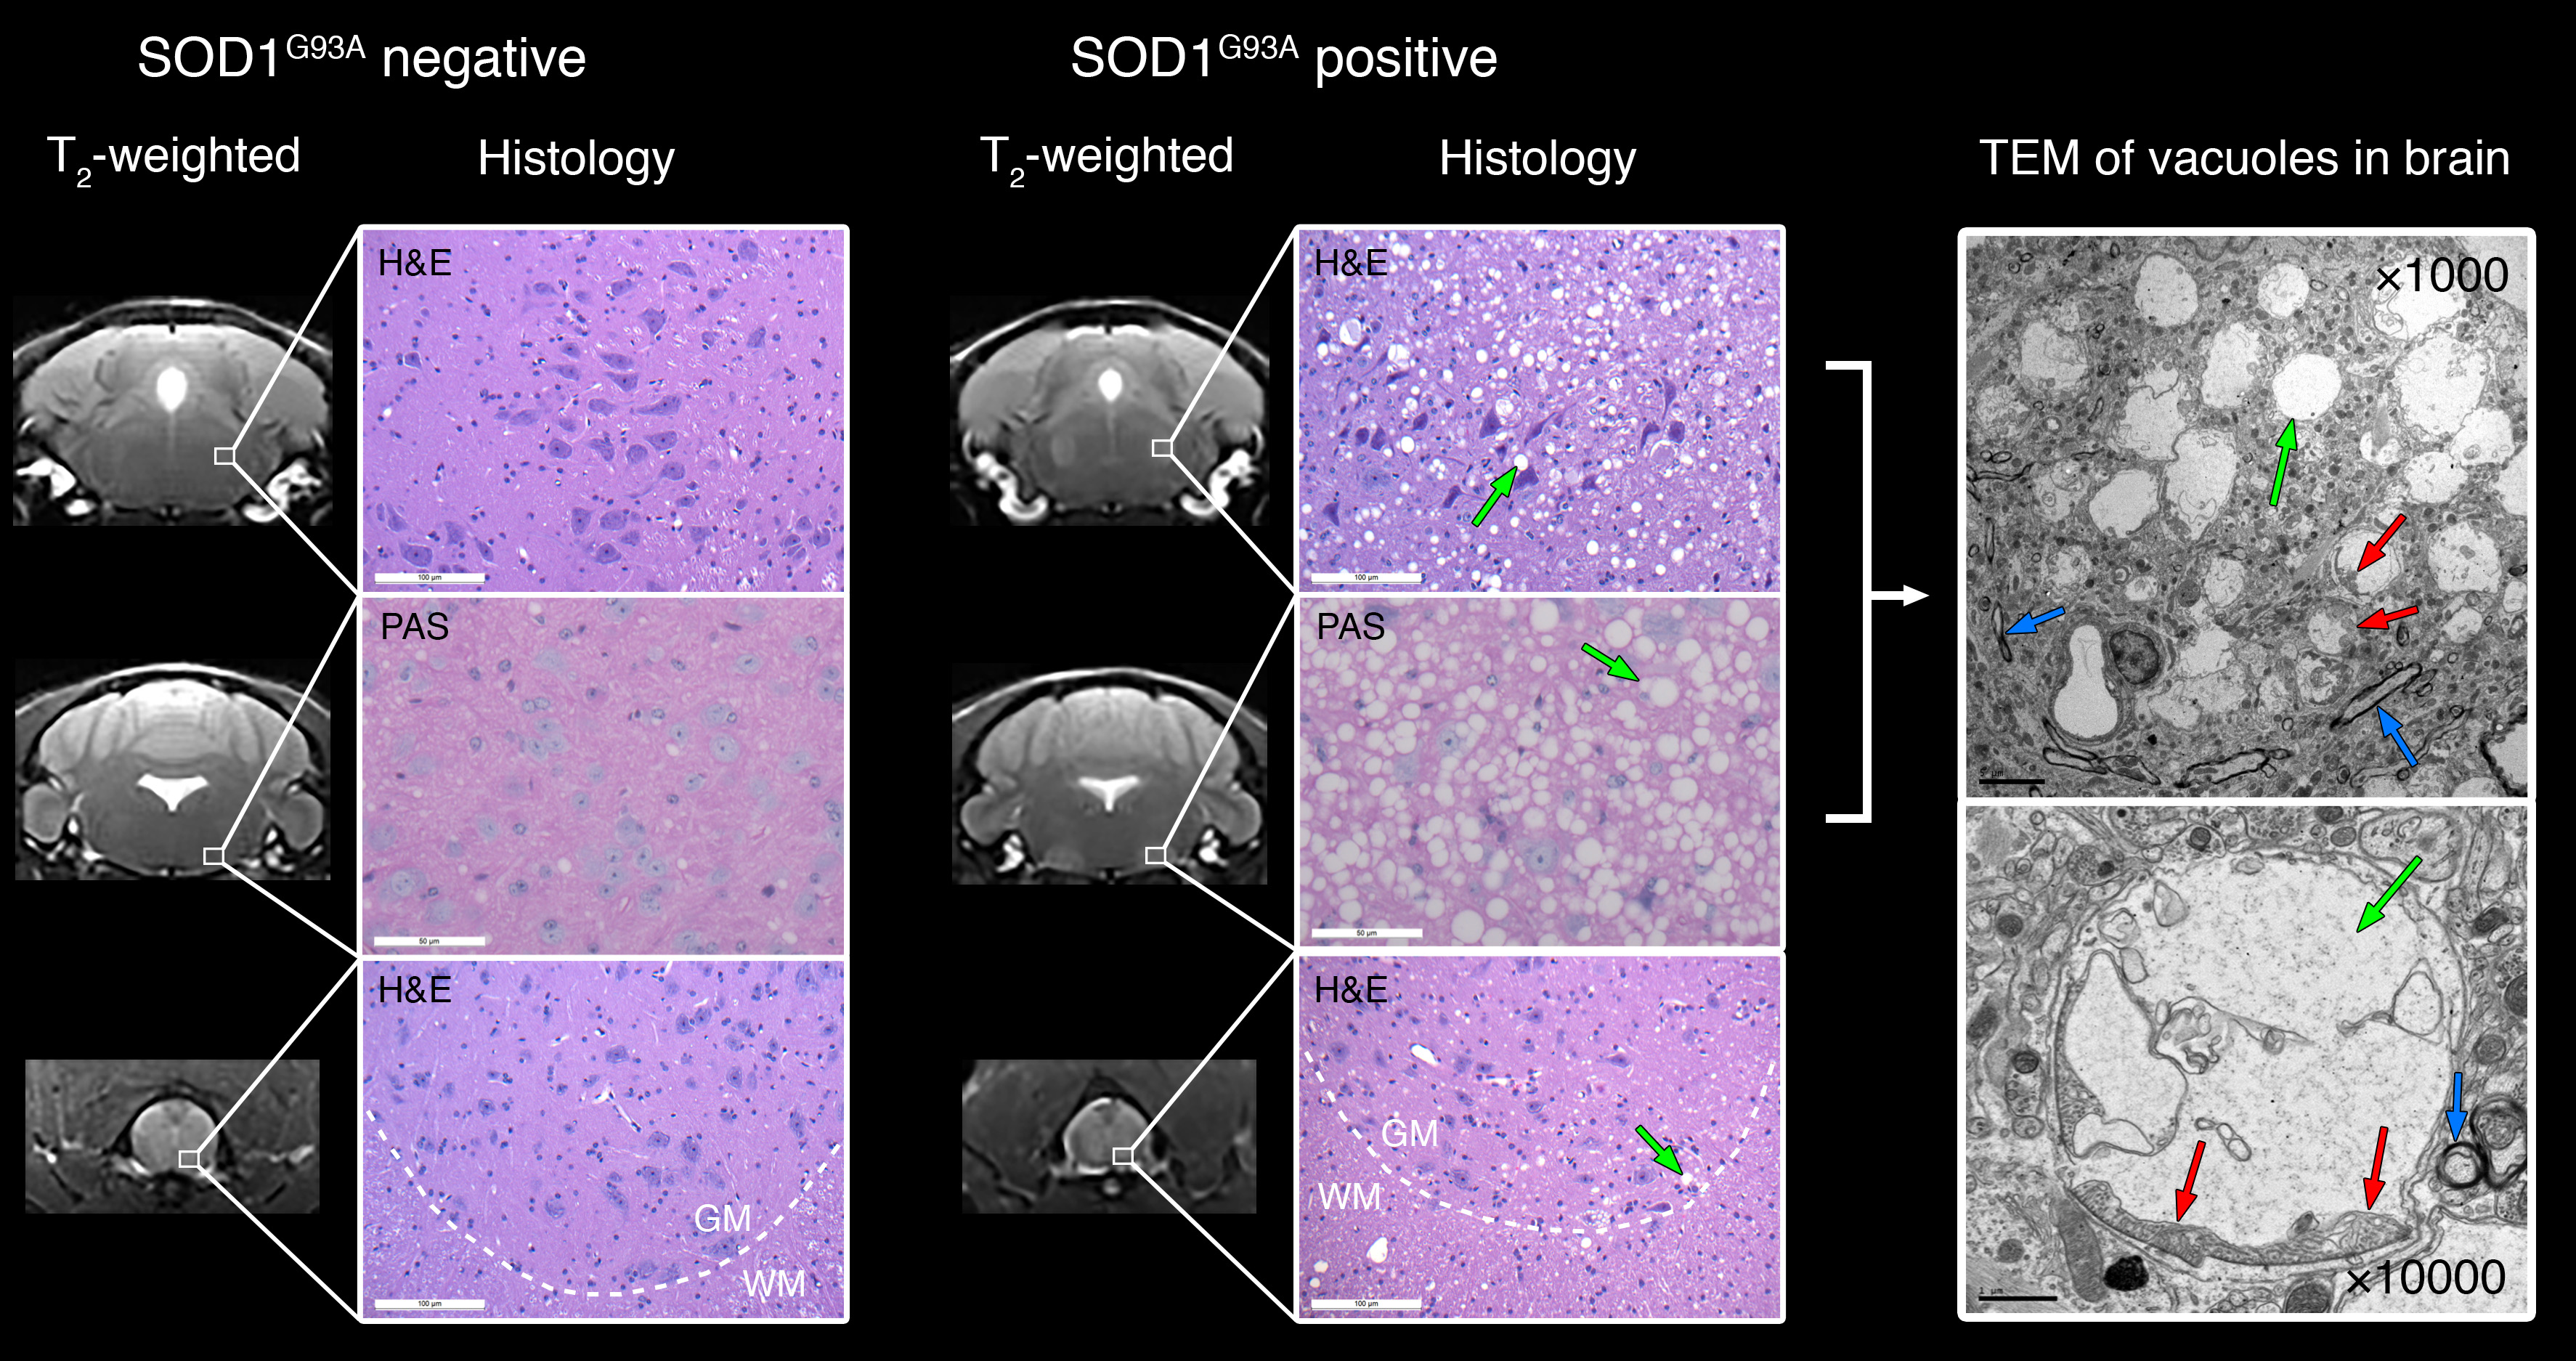
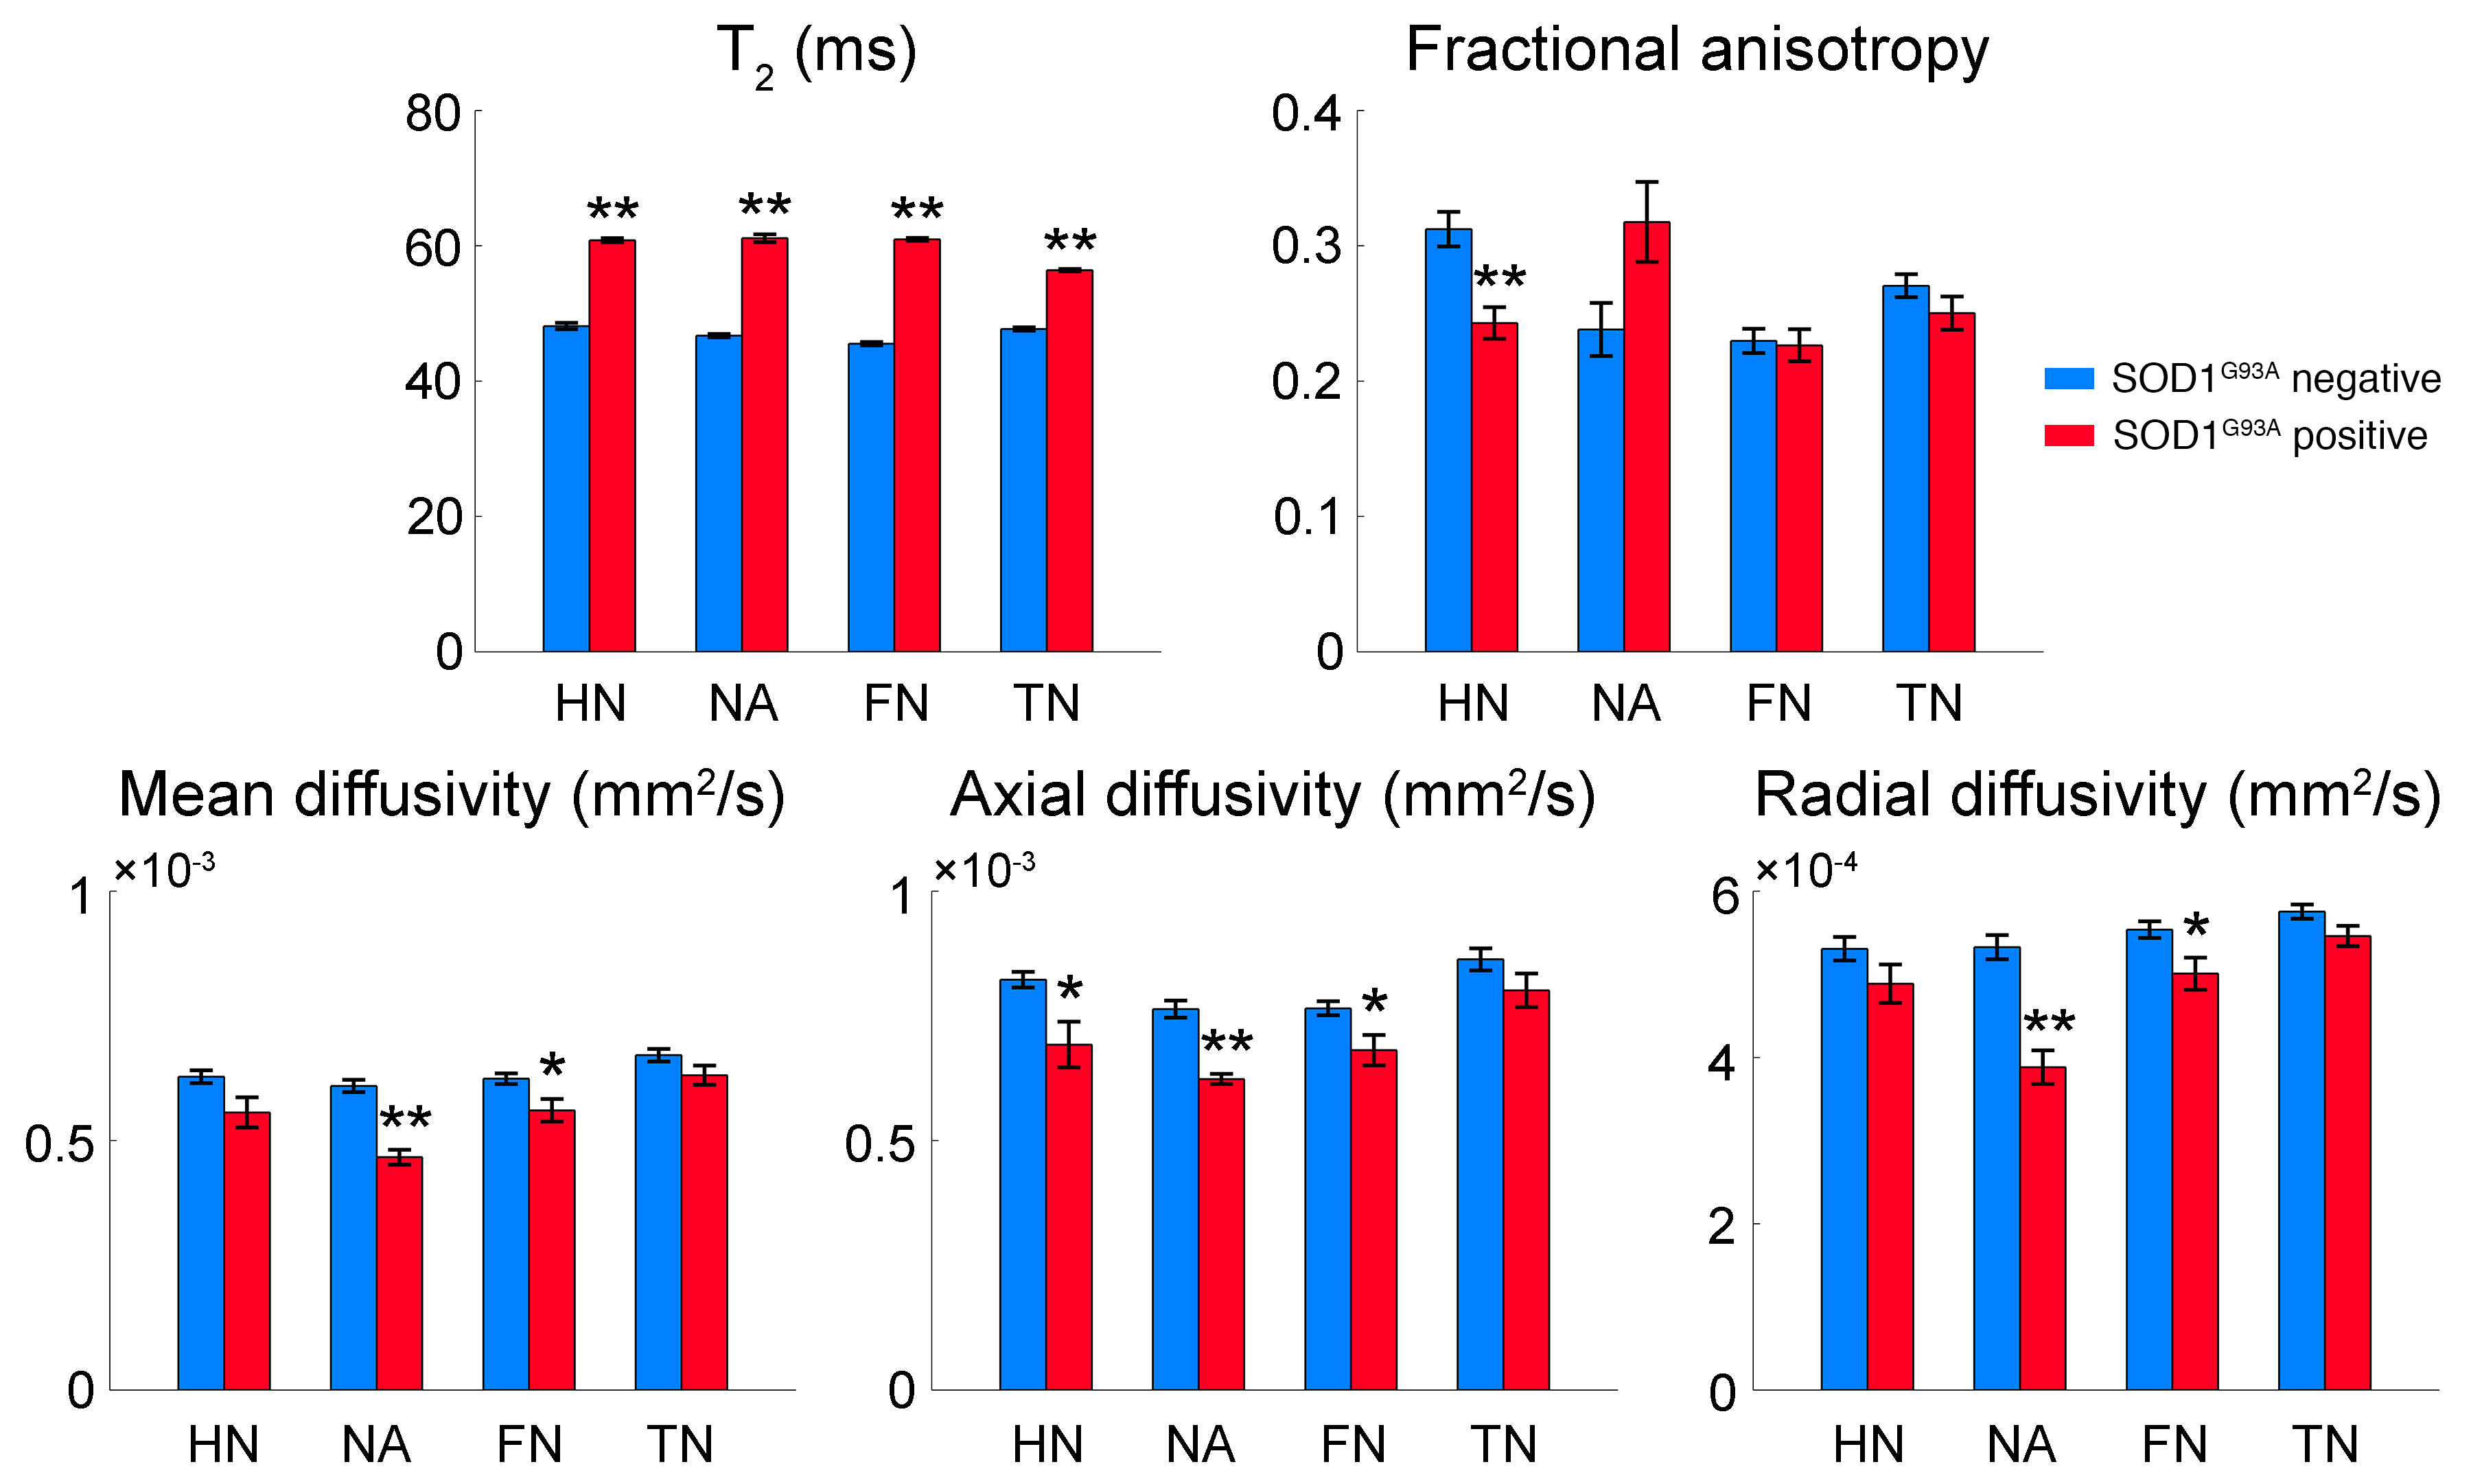
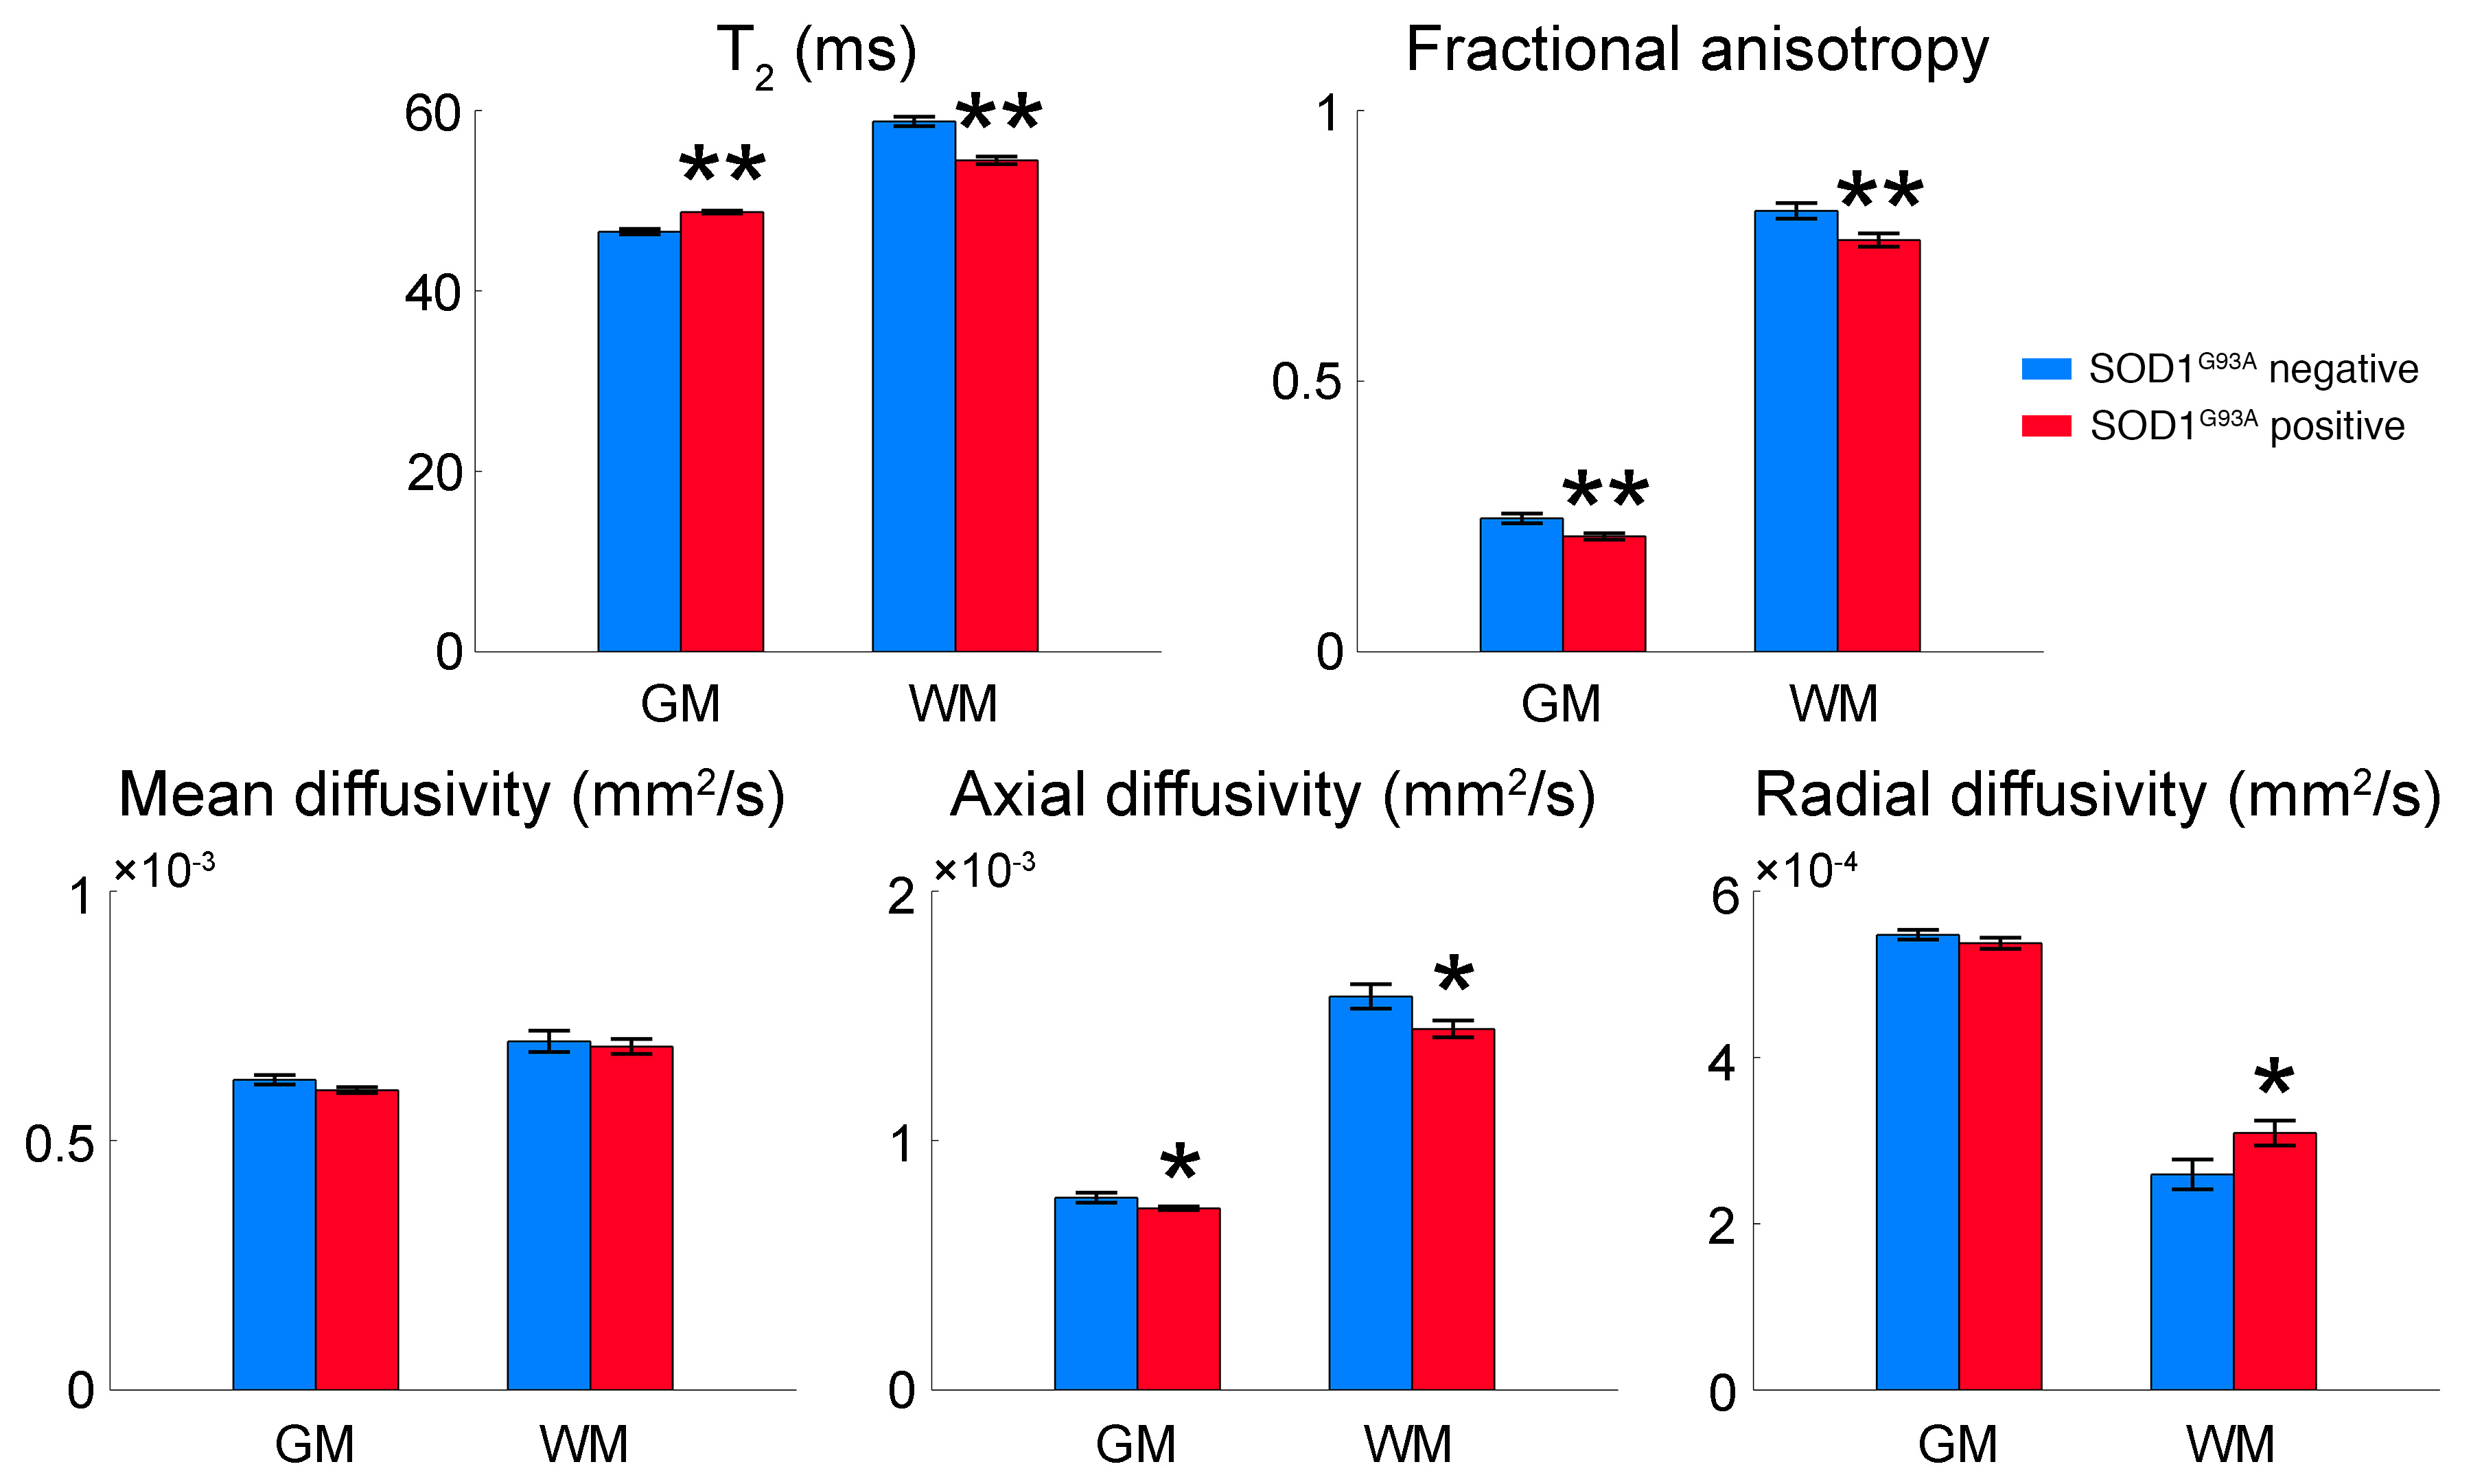
MR images of SOD1G93A negative and positive mice are shown in Fig. 1. Hyperintense regions are markedly distinct in the T2-weighted images of SOD1G93A positive mice, including the trigeminal nucleus, facial nucleus, nucleus ambiguous, and the hypoglossal nucleus. There is also a decrease in FA in the gray and white matter of cervical spinal cord. Histology was performed in the hindbrain and spinal cord regions (Fig. 2). In the brain, bilateral symmetrical vacuolization is observed in the trigeminal, facial, and hypoglossal nuclei. TEM revealed dilated axons containing electron-lucent vacuoles devoid of organelles (Fig. 2 green arrows). Mitochondria were swollen and cristae were disorganized and fragmented (Fig. 2 red arrows). In the cervical spinal cord, vacuoles are present in the gray matter and the descending ventral tracts of the white matter. The increase of water content in the vacuoles led to significantly higher T2 values in the hindbrain (Fig. 3). FA significantly decreased in the hypoglossal nucleus. Generally, MD, AD, and RD decreased in the hindbrain. In the cervical spinal cord, T2 values increased in the gray matter and decreased in the white matter (Fig. 4). FA decreased in both cases while MD did not change. AD decreased in gray and white matter, while RD increased in white matter alone.Discussion and Conclusion
In this study, we demonstrate that T2 and DTI reveal changes in motor neurons of the brain and spine of the SOD1G93A mice. In the hindbrain, the water content due to vacuolization can explain the significant increase of T2. In the cervical spine, the decrease of AD along the spinal cord axis can be due to a decrease in the number of axons, which has been shown in the lumbar spinal cord of SOD1 mice (2). The observed increase of RD has been associated with demyelination in mice (2,8) and correlated with decreasing limb tapping speeds in ALS patients (5). Of note, T2 decreased significantly in the white matter of the spinal cord. A decrease in T2 has been associated with tissue damage in multiple sclerosis, for instance (9). The data presented here demonstrates detection of gray and white matter degeneration in a mouse model of ALS. The T2 and DTI data can enable treatment studies to assess delay of motor neuron loss as well as motor neuron recovery in a longitudinal study.Acknowledgements
No acknowledgement found.References
1. Hobson EV, McDermott CJ. Supportive and symptomatic management of amyotrophic lateral sclerosis. Nat Rev Neurol 2016;12(9):526-538.
2. Underwood CK, Kurniawan ND, Butler TJ, Cowin GJ, Wallace RH. Non-invasive diffusion tensor imaging detects white matter degeneration in the spinal cord of a mouse model of amyotrophic lateral sclerosis. NeuroImage 2011;55(2):455-461.
3. Valsasina P, Agosta F, Benedetti B, Caputo D, Perini M, Salvi F, Prelle A, Filippi M. Diffusion anisotropy of the cervical cord is strictly associated with disability in amyotrophic lateral sclerosis. J Neurol Neurosurg Psychiatry 2007;78(5):480-484.
4. Caron I, Micotti E, Paladini A, Merlino G, Plebani L, Forloni G, Modo M, Bendotti C. Comparative Magnetic Resonance Imaging and Histopathological Correlates in Two SOD1 Transgenic Mouse Models of Amyotrophic Lateral Sclerosis. PloS one 2015;10(7):e0132159.
5. Nair G, Carew JD, Usher S, Lu D, Hu XP, Benatar M. Diffusion tensor imaging reveals regional differences in the cervical spinal cord in amyotrophic lateral sclerosis. NeuroImage 2010;53(2):576-583.
6. Kiernan MC, Vucic S, Cheah BC, Turner MR, Eisen A, Hardiman O, Burrell JR, Zoing MC. Amyotrophic lateral sclerosis. Lancet 2011;377(9769):942-955.
7. Chang LC, Jones DK, Pierpaoli C. RESTORE: Robust estimation of tensors by outlier rejection. Magnet Reson Med 2005;53(5):1088-1095.
8. Kim JH, Loy DN, Liang HF, Trinkaus K, Schmidt RE, Song SK. Noninvasive diffusion tensor imaging of evolving white matter pathology in a mouse model of acute spinal cord injury. Magnet Reson Med 2007;58(2):253-260.
9. Tjoa CW, Benedict RHB, Weinstock-Guttman B, Fabiano AJ, Bakshi R. MRI T2 hypointensity of the dentate nucleus is related to ambulatory impairment in multiple sclerosis. J Neurol Sci 2005;234(1-2):17-24.
Figures