0615
Reproducible detection of nigral iron deposition in Parkinson’s disease: Validation in two cohorts1Center for Advanced Neuroimaging, University of California Riverside, Riverside, CA, United States, 2Department of Radiology, Ruijin Hospital, Shanghai Jiao Tong University, People's Republic of China, 3Department of Neurology, Emory University, Atlanta, GA, United States, 4Department of Bioengineering, University of California Riverside, Riverside, CA, United States
Synopsis
A characteristic of Parkinson's disease is neuronal loss in substantia nigra pars compacta (SNpc).In healthy subjects, SNpc contains a dense distribution of neuromelanin containing dopaminergic neurons and significant degeneration in SNpc has occurred at the time Parkinsonian symptom onset. Furthermore, extensive evidence suggests that iron deposition is related to neuronal loss and reduction of neuromelanin in SNpc. In this abstract, we examine the reproducibility of iron deposition in SNpc.
Introduction
It is well established that Parkinson’s disease (PD) causes degeneration of the substantia nigra (SN). SN is a paired midbrain structure located near the red nucleus and is comprised of substantia nigra pars reticulata (SNr) and the substantia nigra pars compacta (SNpc). In healthy subjects, SNpc contains a dense distribution of neuromelanin containing dopaminergic neurons and at the time of Parkinsonian symptom onset, up to 50% of melaninzed neurons in SNpc have been lost1. Furthermore, extensive evidence suggests that iron deposition is related to neuronal loss and reduction of neuromelanin in SNpc2.
MRI techniques sensitive to iron have been used to measure iron deposition after onset of PD. However, a recent study found the SN as seen in T2/T2*-weighted contrasts to be spatially incongruent when compared to the SN seen in magnetization transfer (or neuromelanin-sensitive) images3. Thus, prior attempts4-7 to estimate iron deposition associated with PD may not have been placed in SN regions most sensitive to PD since neuromelanin containing neurons in SN are localized to SNpc and studies have co-localized neuromelanin sensitive signal from magnetization transfer effects with melanized neurons8,9. Here, we use neuromelanin sensitive contrast to localize SNpc and examine the reproducibility of SNpc iron deposition in two cohorts.
Image Acquisition
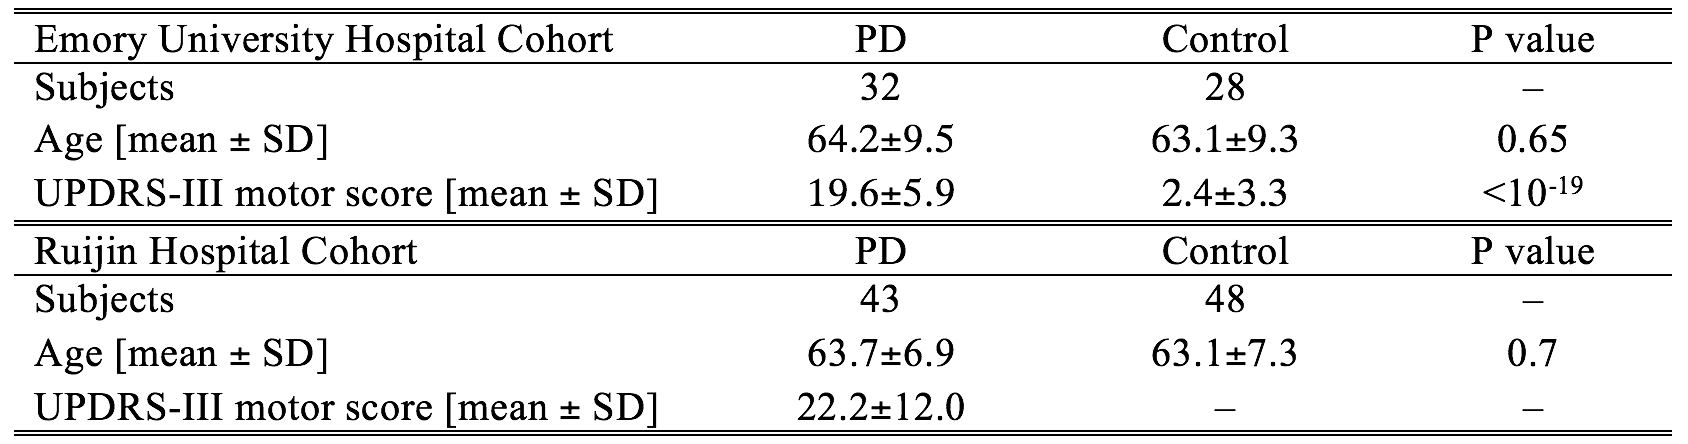
Two cohorts, one at Emory University Hospital (EUH) and one at Ruijin Hospital (RH), were scanned in this study. The EUH cohort consisted of 59 subjects and the RH cohort consisted of 91 subjects. All subjects gave written, informed consent. Demographic data for both cohorts is summarized in Table 1.
Data for the EUH cohort were acquired on a 3 T MRI scanner (Prisma Fit, Siemens Medical Solutions, Malvern, PA) using a 64-channel receive only coil. Images from a MP-RAGE sequence (echo time (TE)/repetition time (TR)/inversion time=3.02/2600/800 ms, flip angle (FA)=8°, voxel size=1.0×1.0×1.0 mm3) were used for registration from subject space to common space. T2*-weighted data were collected with an eight echo 3D gradient recalled echo (GRE) sequence: TE1/$$$\Delta$$$TE/TR = 4.92/4.92/50 ms, FOV = 212 × 212 mm2, matrix size of 448×336×80, slice thickness=1mm, acceleration factor=2.
Data at RH were acquired on a 3 T MRI scanner (Signa HDxT, GE Medical Systems, Milwaukee, WI) using an 8 channel receive only coil. T1-weighted structural images were acquired with the following parameters: TR/TE=5.52ms/1.724ms, acquisition slices=196, matrix=256×256, FOV=256mm, flip angle=12°, slice thickness=1mm. T2*-weighted data were collected with a sixteen echo GRE 3D sequence: TE1/$$$\Delta$$$TE/TR=59.1/2.9/59.3ms, FA=12°, FOV=220×220mm2, matrix size=256×256, slice thickness=1mm, acceleration factor=2.
Image Processing
R2* values were estimated in MATLAB by fitting a monoexponential model
$$S = S_{0} e^{-R_{2} ^{*}TE}$$
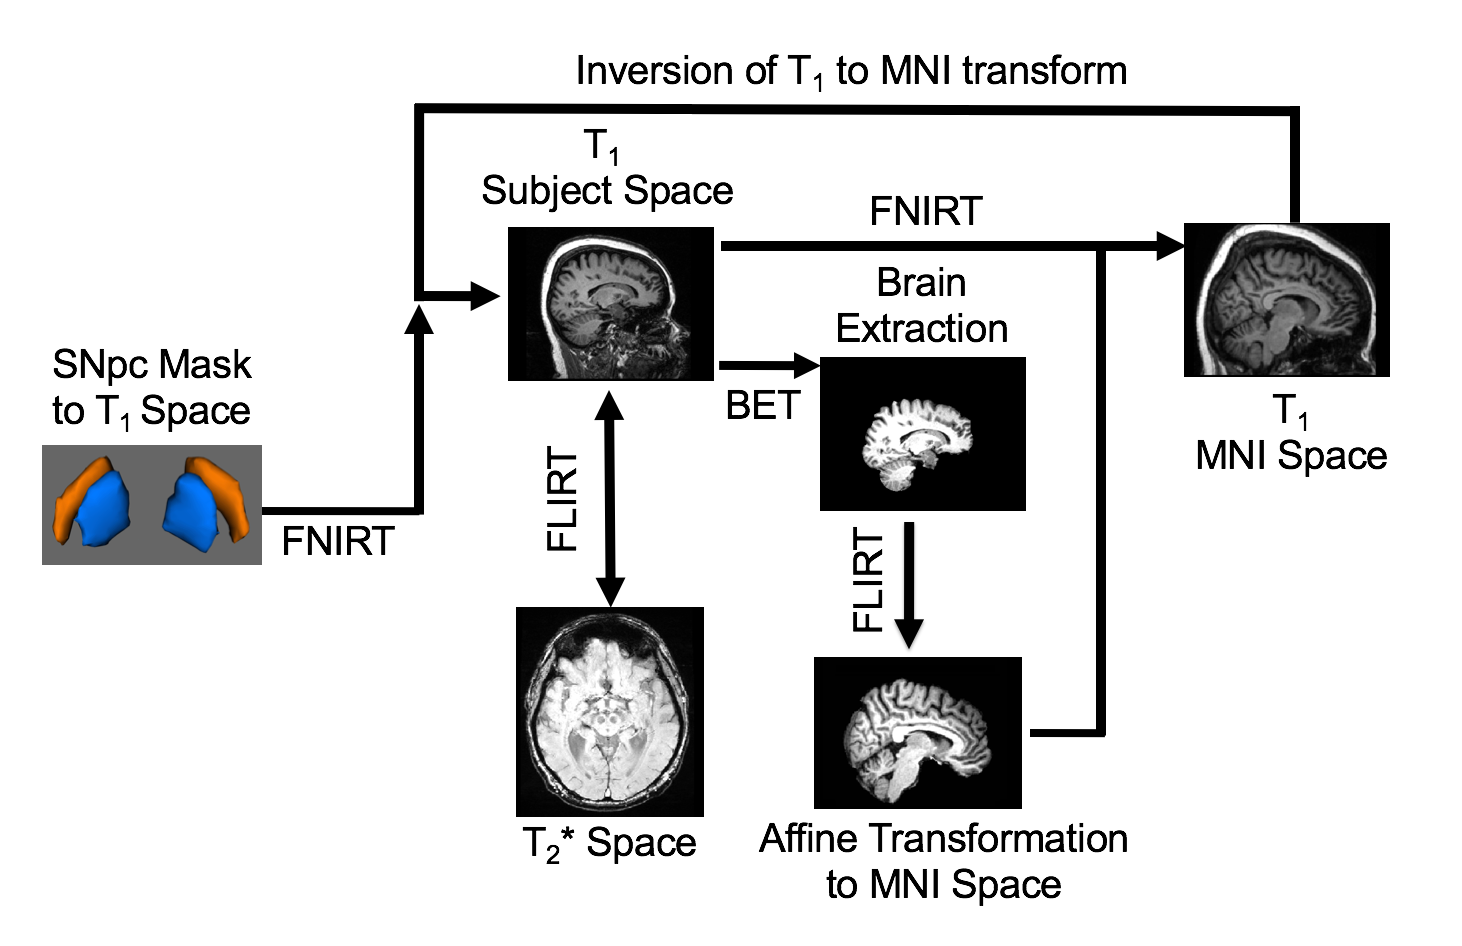
where $$$S_{0}$$$ denotes a fitting constant. Standard space SNpc regions of interest
(ROIs) were transformed from standard space to subject space using FSL. This is
schematically illustrated in Figure 1.
Results
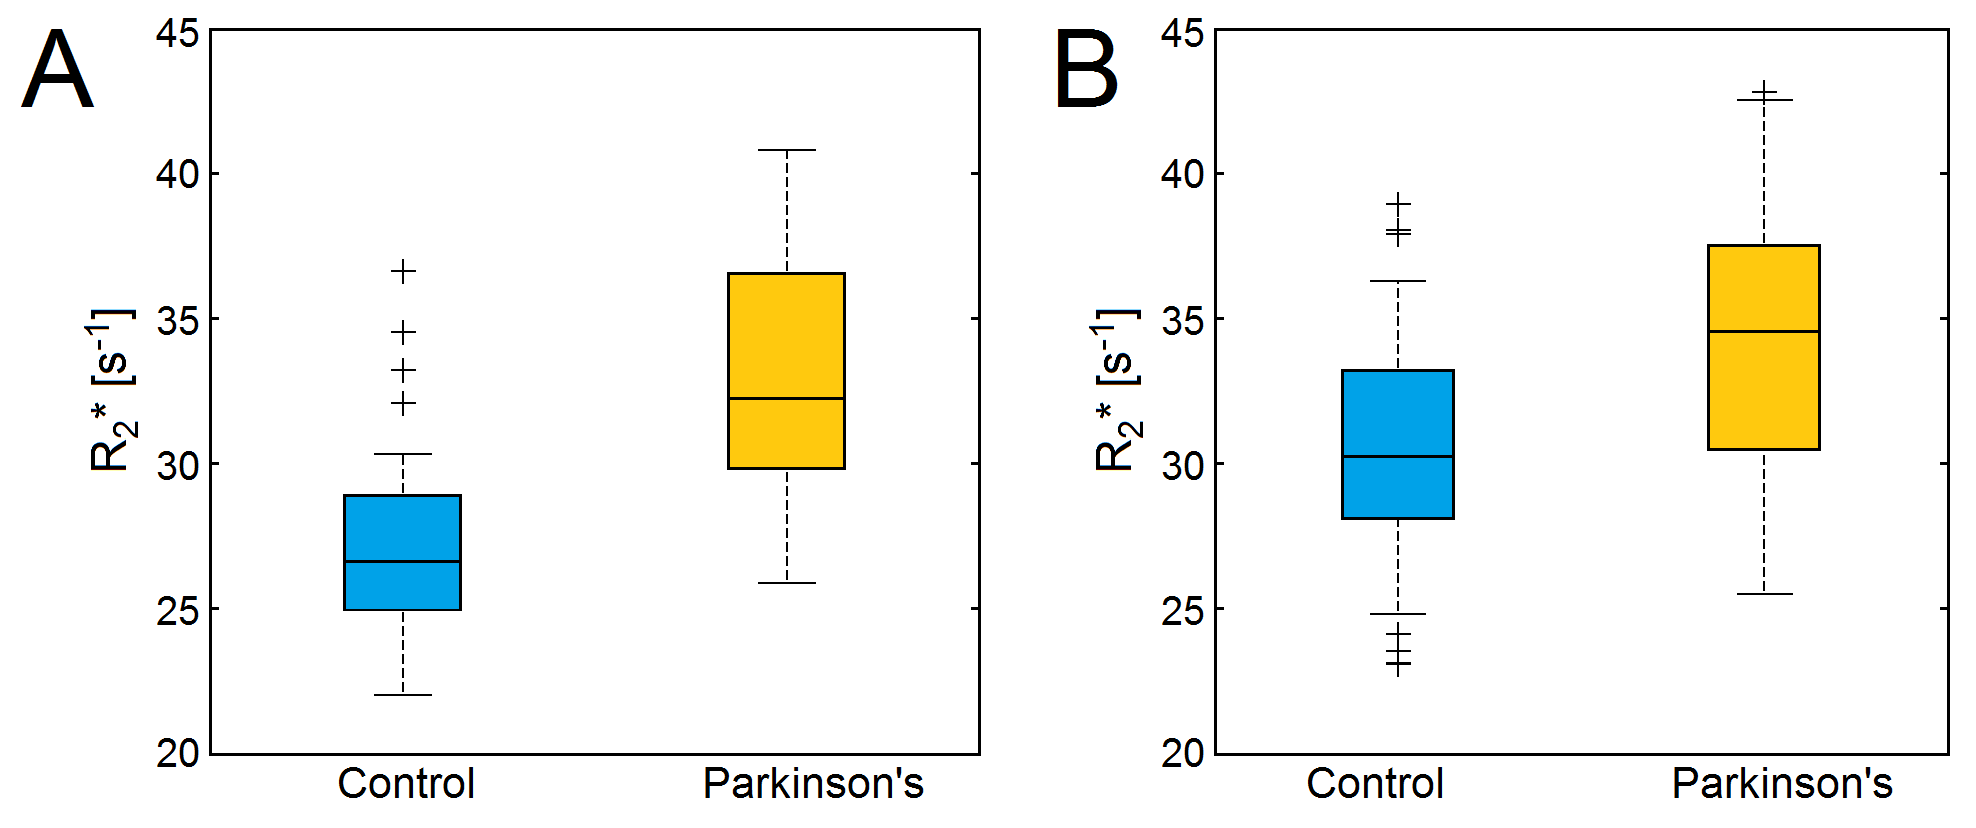
Mean R2* values in the SNpc, as defined by neuromelanin-sensitive MRI, were increased in the PD group of both cohorts. For the EUH cohort, mean SNpc R2* values were 33.1 s-1±5.1 s-1 and 27.4 s-1±3.7 s-1 (p=7x10⁻⁶) for PD and control groups, respectively. For the RH cohort, mean SNpc R2* values were 33.9 s-1±4.6 s-1 and 30.4 s-1±4.2 s-1 (p=7x10⁻⁴) for PD and control groups, respectively. These results are summarized in Figure 2. Mean SNpc R2* did not show any correlations were seen in either cohort with Unified Parkinson's Disease Rating Scale (UPDRS)-III score, which is a measure of symptom severity.Discussion
In this abstract, we found increased R2* values in SNpc of two cohorts and similar effect sizes were seen in both cohorts. As compared to RH, lower R2* values were seen in the EUH cohort and these may be due the EUH dataset being acquired at a higher resolution or may be due to scanner differences. SNpc ROIs were generated using neuromelanin-sensitive MRI data acquired from a group of healthy controls. This procedure is beneficial since it allows for retrospective analysis of acquired data. Furthermore, this process allows for the examination of PD related changes in a more standardized and unbiased manner since iron deposition occurs at different rates in PD patients. In PD patients, the size and morphology of the iron SN will depend on this deposition. Individual NM SN masks may be used in lieu of these masks. However, substantial nigral degeneration has occurred at the time of symptom onset and a reduction in NM sensitive contrast in PD is expected. Thus, in PD, individualized SNpc ROIs will be smaller than those derived from the controls, and SNpc regions most affected by PD will not be included in the analysis.Acknowledgements
XH, JL, and DH receive support from the Michael J Fox Foundation (MJF 10854).References
1. Fearnley & Lees. Ageing and Parkinson’s disease: substantia nigra regional selectivity. Brain 114:2283-2301
2. Dexter, et al. Alteration in the levels of iron, ferritin and other trace metals in Parkinson’s disease and other neurodegenerative diseases affecting the basal ganglia. Brain 114:1953-1975
3. Langley, et al. A multicontrast approach for comprehensive imaging of substantia nigra. Neuroimage 112:7-13
4. Martin, et al. Midbrain iron content in early Parkinson disease: a potential biomarker of disease status. Neurology 70:1411-1417
5. Peran, et al. Magnetic resonance imaging markers of Parkinson’s disease nigrostriatal signature. Brain 133:3423-3433
6. Du, et al. Combined R2* and diffusion tensor imaging changes in the substantia nigra in Parkinson’s disease. Movement Disorders 26:1627-1632
7. Ulla, et al. Is R2* a new MRI biomarkers for the progression of Parkinson’s disease? A longitudinal follow-up. PLoS ONE 8:e57904
8. Keren, et al. Histological validation of locus coeruleus MRI contrast in post mortem tissue. Neuroimage 113:235-245
9. Kitao, et al. Correlation between pathology and neuromelanin MR imaging in Parkinson’s disease and dementia with Lewy bodies. Neuroradiology 55:947-953
Figures