0614
Subtypes Evaluation of Motor Dysfunction in Parkinson’s Disease using Neuromelanin-sensitive Magnetic Resonance Imaging1MRI, Shandong Medical Imaging Research Institute, Shandong University, Jinan, People's Republic of China, 2Russell H. Morgan Department of Radiology and Radiological Science, The Johns Hopkins University School of Medicine, Baltimore, MD, United States, 3Shandong University, Jinan, People's Republic of China, 4MRI, Shandong Medical Imaging Research Institute
Synopsis
The aim of this study was to evaluate the differences in NM-MRI between PD motor subtypes. We compared the signal intensity contrast ratios in medial and lateral regions of the
Introduction and purpose
Parkinson’s disease (PD) is characterized by the loss of neuromelanin (NM)-containing neurons in the substantia nigra pars compacta (SNc), and it is divided into two motor subtypes: the postural instability gait difficulty (PIGD) and the tremor dominant (TD) subtypes. With NM-sensitive Magnetic Resonance Imaging (NM-MRI), investigators have been able to accurately detect signal attenuation in SNc of PD; however, the loss of NM in PIGD and TD subtypes is unclear. Thus, the aim of this study was to evaluate the differences in NM-MRI between PD motor subtypes.Method
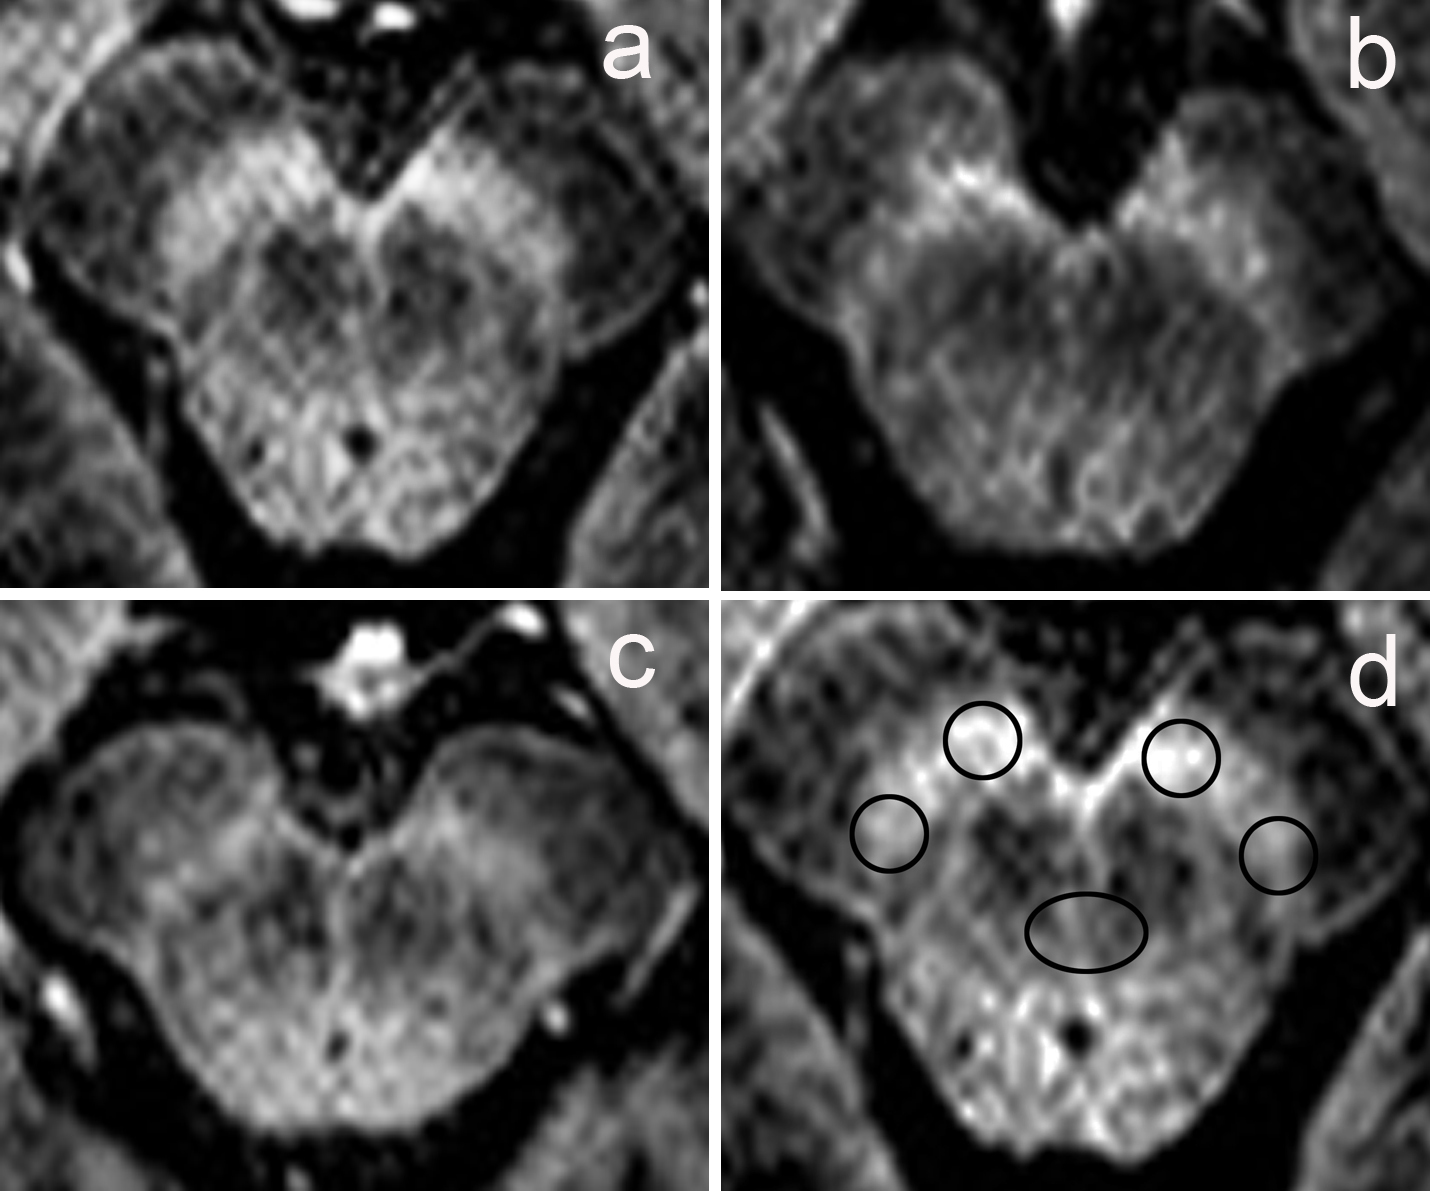
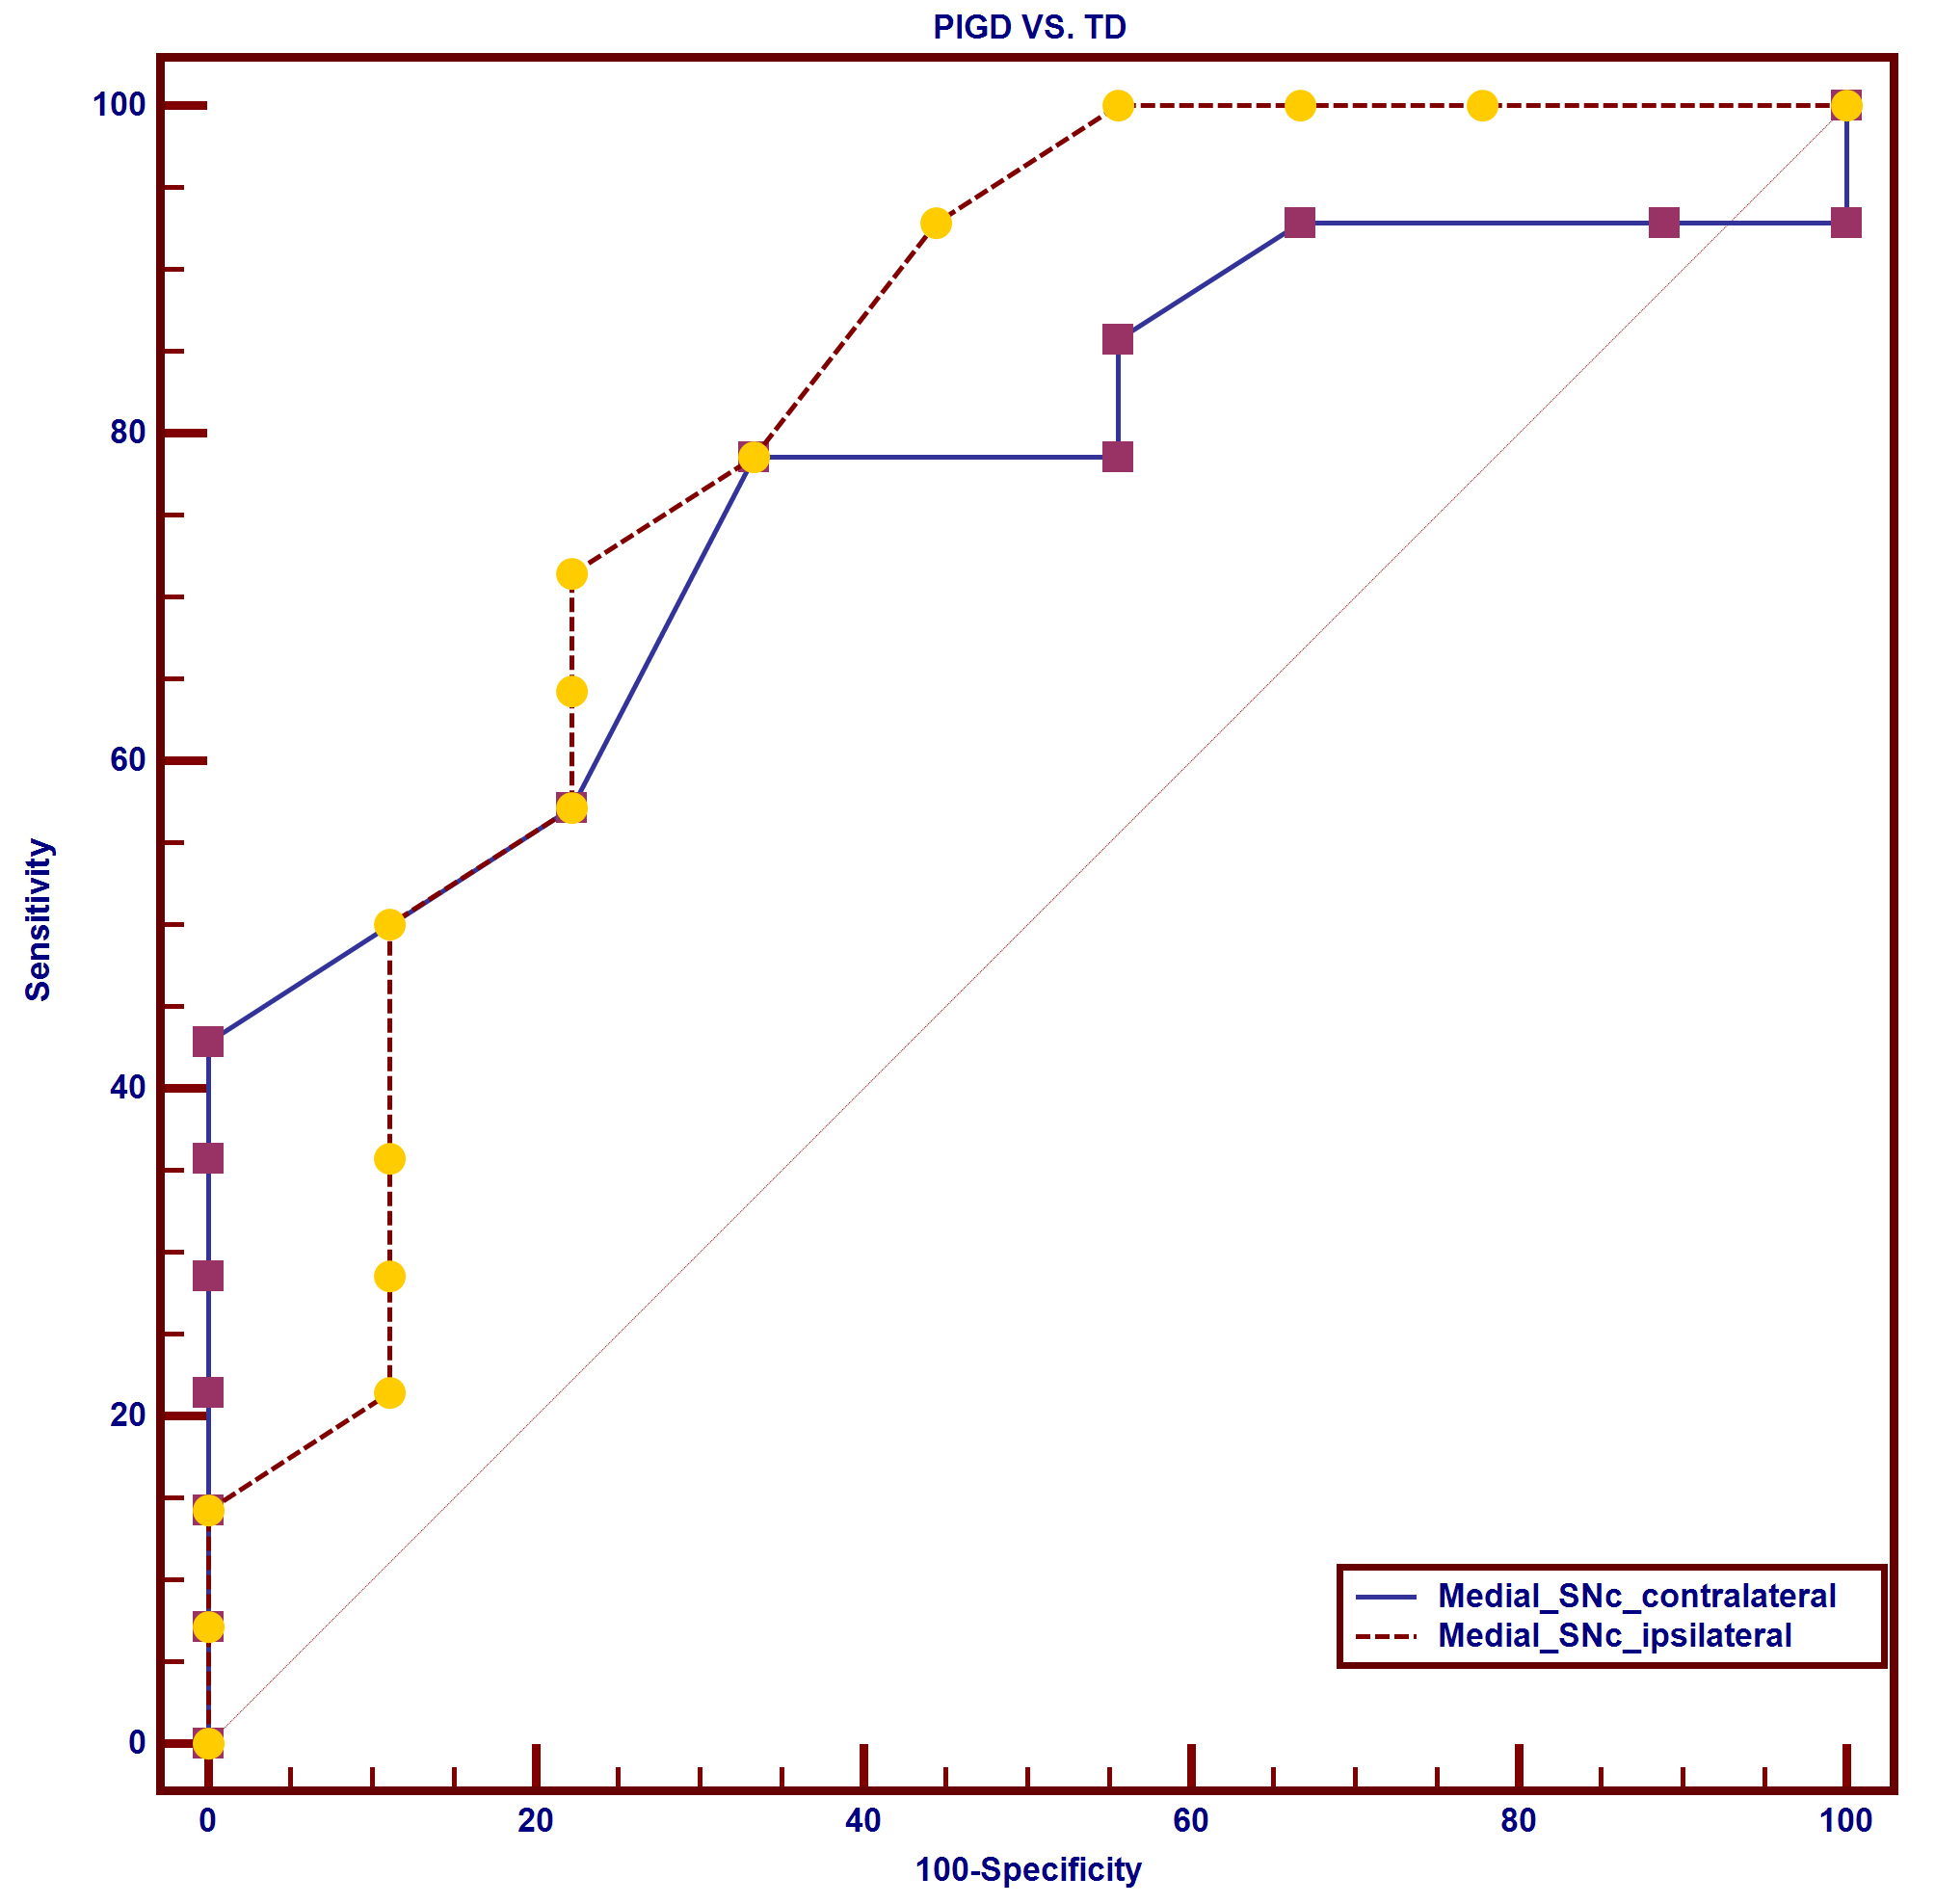
PD patients were classified into PIGD (n = 14) and TD groups (n = 9); 20 age and sex matched controls were recruited. All images were acquired using a 3.0-T MRI scanner (Philips Achieva TX, Best, Netherlands) with 8-channel head coil. The NM-MRI pulse sequence was a T1-weighted turbo field echo (TFE) sequence similar to that previously described by Ogisu et al. 1 with repetition time, 13 ms; echo time, 2.2 ms; flip angle, 20°; echo train length, 2; number of excitations, 8; matrix size, 320×326; field of view, 220 mm; pixel size, 0.69 mm×0.80 mm; number of slices, 40; slice thickness, 1.0 mm; gapless; MTC: angle, 600; duration, 20; frequency, 600. The total acquisition time was 5 min 21s. For quantitative evaluation of the signal intensity, the ROIs were measured using round cursors at the section through the inferior edge of the inferior colliculus. Contrast ratio (CR) of the SNc was calculated using the following equations: CR = (SSNc-SCP)/SCP, wherein SSNc stands for the signal intensity of the SNc (including a lateral and medial portion of the SNc), and the SCP represents that of the cerebral peduncle. Statistical analysis was performed to determine differences in the CR among PIGD, TD, and controls using ANOVA and Bonferroni tests. We used Student’s t-test to compare the CR between PIGD and TD. To determine the sensitivity and specificity of the NM-MRI for discriminating between PIGD and TD, receiver operating characteristic (ROC) analyses were performed. The alpha level for all analyses was 0.05.Results
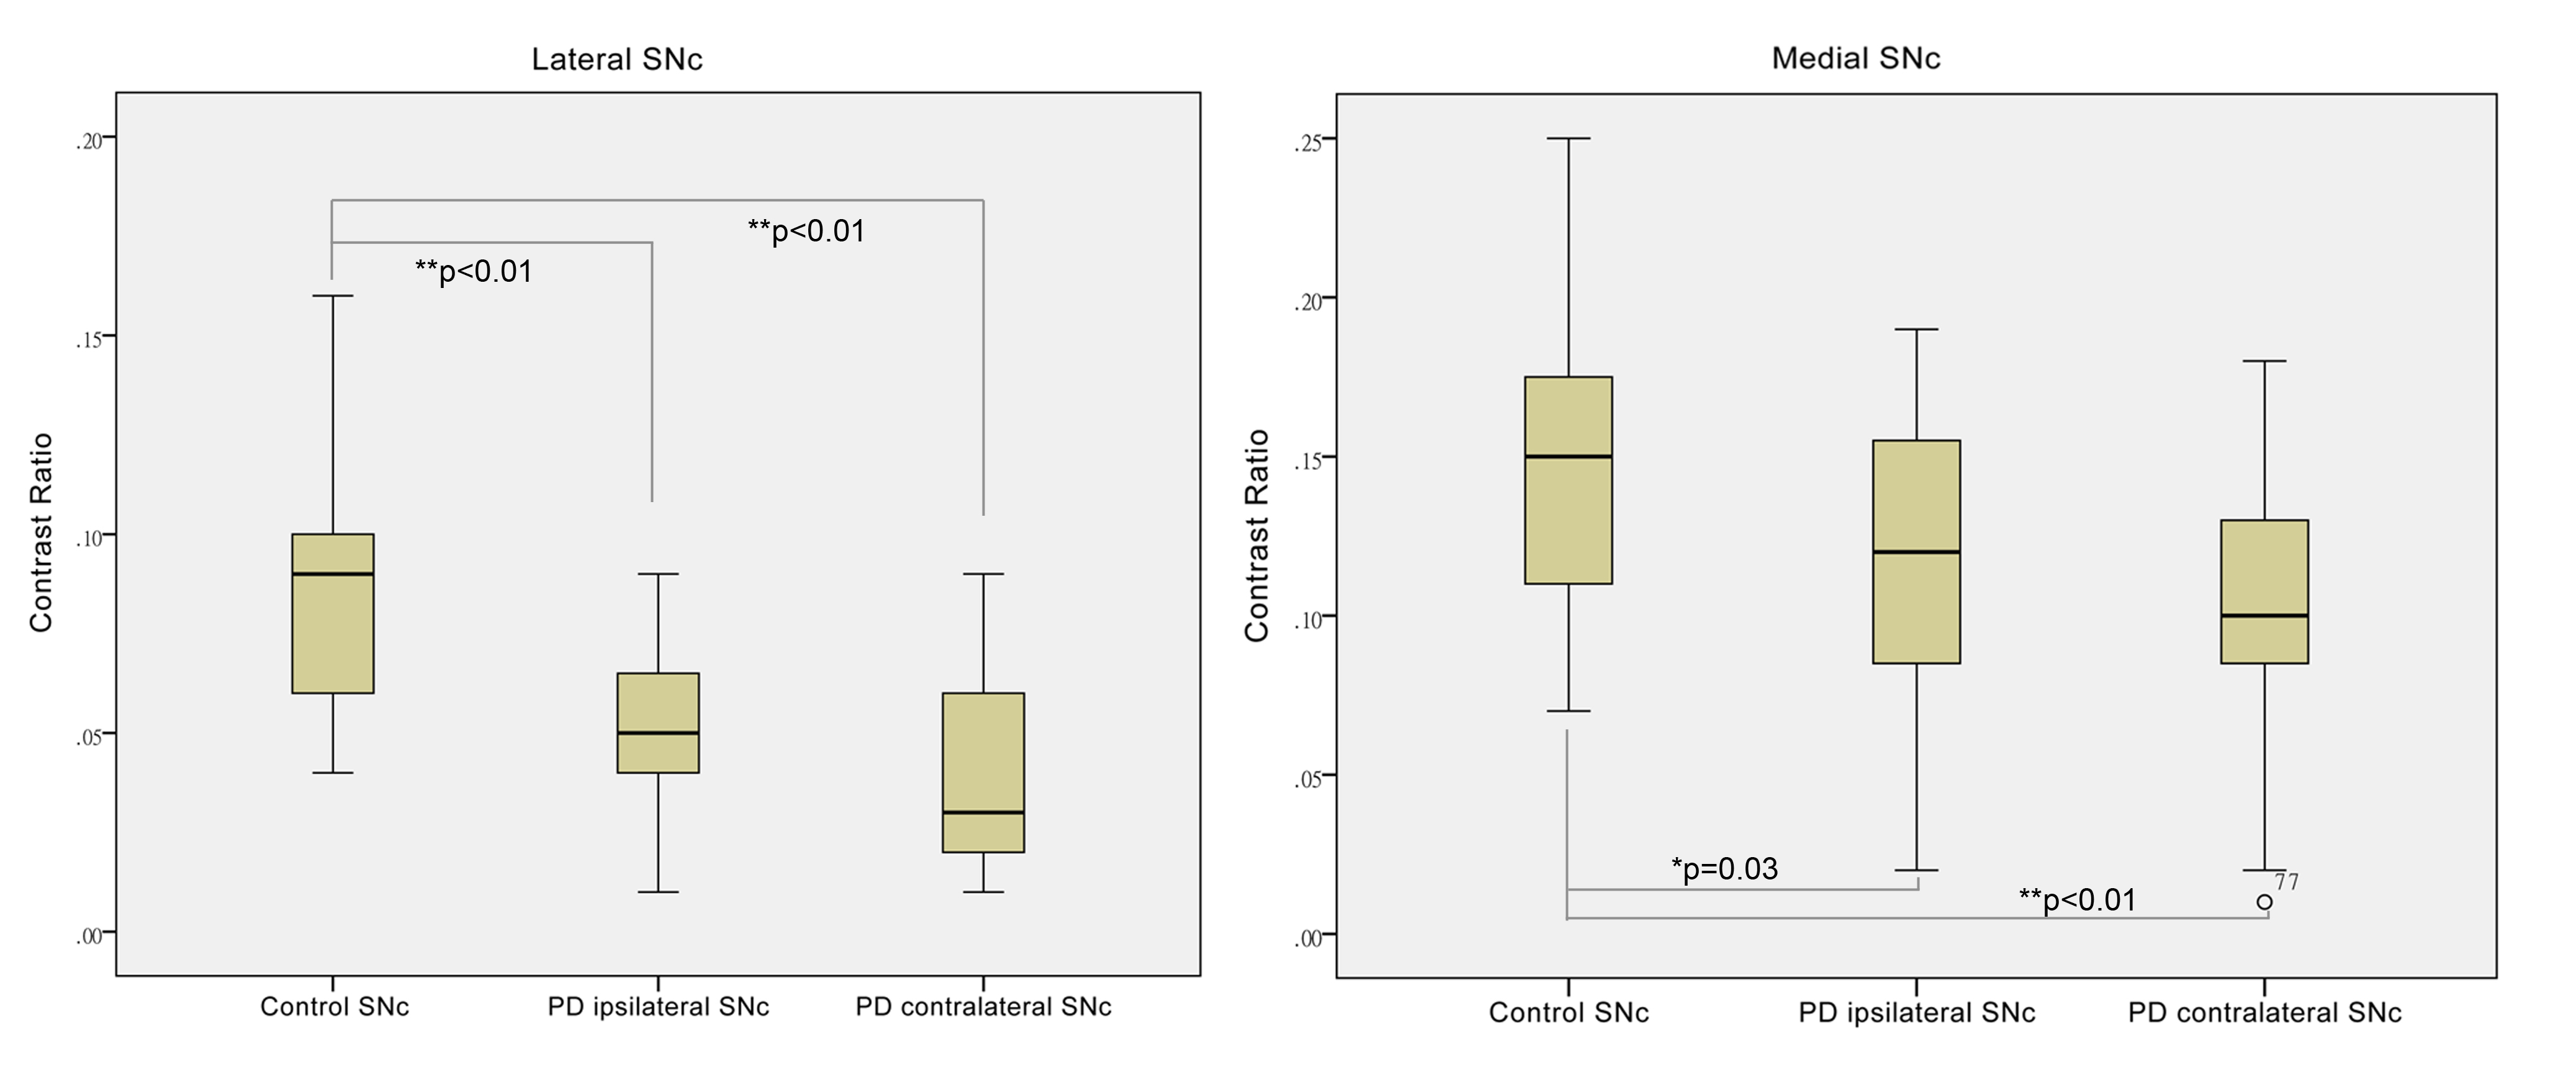
Remarkable signal attenuation was detected in the lateral part of SNc in PD when compared with the controls (Fig. 1), and we were able to detect more severe signal attenuation in the medial part of SNc in PIGD patients as compared to the TD group (Fig. 2). Also, the medial part of SNc, ipsilateral to the most clinically affected side showed the higher power to discriminate the PD motor subtypes (Fig. 3).Discussion
Significant signal attenuation was detected in the lateral part of the SNc in PD patients, which was consistent with neuropathological findings 2. We further found more severe signal attenuation in the medial part of SNc in PIGD patients compared to the TDs, enabling the differentiation of PIGD from TD group with relatively high sensitivity and specificity. Previous neuropathological findings also showed more severe SN neuronal loss and a faster progression of the PIGD patients than the TDs 3. Previous studies have shown that NM-MRI can help to detect specific PD subgroups, such as patients with RBD 4, and distinguish PD from atypical parkinsonism 5.To the best of our knowledge, this is the first report evaluating the differences between the PD motor subtypes by NM-MRI.Conclution
NM-MRI affords us a valuable examination method to discriminate the PD motor subtypes, providing new evidence for the neuropathological basis of differences between the two subtypes.Acknowledgements
No acknowledgement found.References
1. Ogisu K, Kudo K, Sasaki M, et al. 3D neuromelanin-sensitive magnetic resonance imaging with semi-automated volume measurement of the substantia nigra pars compacta for diagnosis of Parkinson's disease. Neuroradiology. 2013; 55(6):719-724.
2. R.J. Uitti, Y. Baba, N.R. Whaley, et al. Parkinson disease: handedness predicts asymmetry, Neurology. 2005; 64(11):1925-1930.
3. C. Rossi, D. Frosini, D. Volterrani, et al. Differences in nigro-striatal impairment in clinical variants of early Parkinson's disease: evidence from a FP-CIT SPECT study. European journal of neurology. 2010; 17(4):626-630.
4. F. Miyoshi, T. Ogawa, S.I. Kitao, et al. Evaluation of Parkinson disease and Alzheimer disease with the use of neuromelanin MR imaging and (123)I-metaiodobenzylguanidine scintigraphy. AJNR. 2013; 34(11): 2113-2118.
5. S. Reimao, P. Pita Lobo, D. Neutel, et al. Substantia nigra neuromelanin-MR imaging differentiates essential tremor from Parkinson's disease. Movement disorders: official journal of the Movement Disorder Society. 2015; 30(7): 953-959.
Figures