0611
Lateral Dependence of Brainstem Structural Abnormalities in Parkinson’s Disease as Revealed by High-Resolution Non-Gaussian Diffusion MR Imaging1Center for MR Research, University of Illinois at Chicago, Chicago, IL, United States, 2Department of Bioengineering, University of Illinois at Chicago, Chicago, IL, United States, 3Department of Neurological Sciences, Rush University Medical Center, Chicago, IL, United States, 4Departments of Radiology, Neurosurgery and Bioengineering, University of Illinois at Chicago, Chicago, IL, United States
Synopsis
Parkinson’s disease (PD) is a neurodegenerative disorder characterized by progressive degeneration of dopaminergic neurons in the substantia nigra (SN). With the ability to reveal tissue microstructural changes, non-Gaussian diffusion models with high b-values can provide a wealth of information related to the neurodegenerative process and complement the conventional Gaussian diffusion model. Non-Gaussian diffusion imaging is typically performed with limited spatial resolution and subject to image distortion. In this study, we have combined a high-resolution, distortion-free diffusion sequence with a non-Gaussian diffusion model to analyze the lateral dependence of tissue abnormalities in the SN of PD patients compared to healthy controls.
Introduction
Structural abnormalities in the substantia nigra (SN) have been reported in patients with Parkinson’s disease (PD) in both neuropathology and neuroimaging studies1,2. Clinical signs and symptoms of PD can be asymmetrical, and according to some studies, significantly related to handedness3. These findings suggest that structural changes of SN might also be laterally dependent. With the ability to probe tissue structural abnormalities, diffusion MRI has been increasingly used in PD studies. The vast majority of published work relies on a mono-exponential, or Gaussian, diffusion model. However, it is important to recognize that non-Gaussian diffusion models can provide additional information on tissue microstructures and microenvironment6. Non-Gaussian diffusion imaging is typically performed with limited spatial resolution and subject to image distortion, imposing challenges for studying fine structures such as the SN located in the distortion-prone brainstem. In this study, we have combined a high-resolution diffusion imaging sequence using reduced field-of-view (rFOV)4,5 with a novel non-Gaussian diffusion model – the continuous-time random-walk (CTRW) model6 – to investigate the possible lateral dependence of structural abnormalities in the SN of PD patients compared to healthy controls (HC).Materials and Methods
Subjects:
With IRB approval, 27 clinically confirmed PD patients (18 males, age: 71.2±6.3) and 23 age-matched healthy controls (13 males, age: 69.4±5.4) were included in the study.
Image Acquisition:
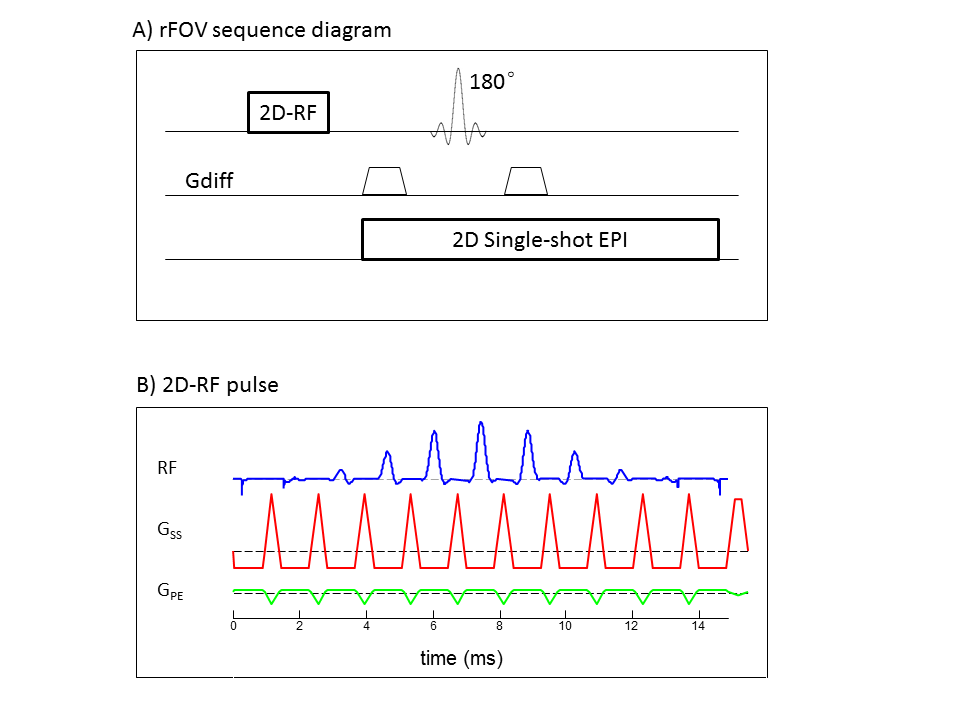
All subjects underwent diffusion MRI on a 3T GE MR750 scanner. Diffusion images were acquired from the brainstem using a customized rFOV sequence5 (Figure 1) with seven b-values: 04, 502, 2002, 5004, 10004, 20004, and 30004 s/mm2 (the subscript denotes NEXs). The other parameters were: TR/TE=3080/86ms, slice thickness=3mm, FOV=10cm×6cm, and matrix size=160×96, producing a voxel size of 0.6×0.6×3mm3. At each non-zero b-value, trace-weighted images were obtained to minimize the effect of diffusion anisotropy.
Image and Statistical Analyses:
The CTRW model describes the diffusion-weighted (DW) signal using a Mittag-Leffler function, Eα: $$M(b)=M_{0}E_{\alpha}(-(bD_{m})^{\beta}), [1]$$
where Dm is an anomalous diffusion coefficient, and α and β are the temporal and spatial diffusion heterogeneity parameters, respectively6,7. Eq. [1] was used to fit the multi-b-value diffusion images voxel-by-voxel, producing maps of Dm, α, and β. For comparison, apparent diffusion coefficient (ADC) was also computed using b-values of 0 and 1000 mm2/s.
For each subject, regions of interest (ROIs) were drawn on each side of the SN separately. The mean value of each diffusion parameter within the ROIs was calculated and compared between the PD patient group (PG) and the HC using a 2-tailed Student’s t-test. To evaluate the performance of differentiating PG and HC, receiver operating characteristic (ROC) analysis was employed for individual and combinations of CTRW parameters8, as well as ADC.
Results
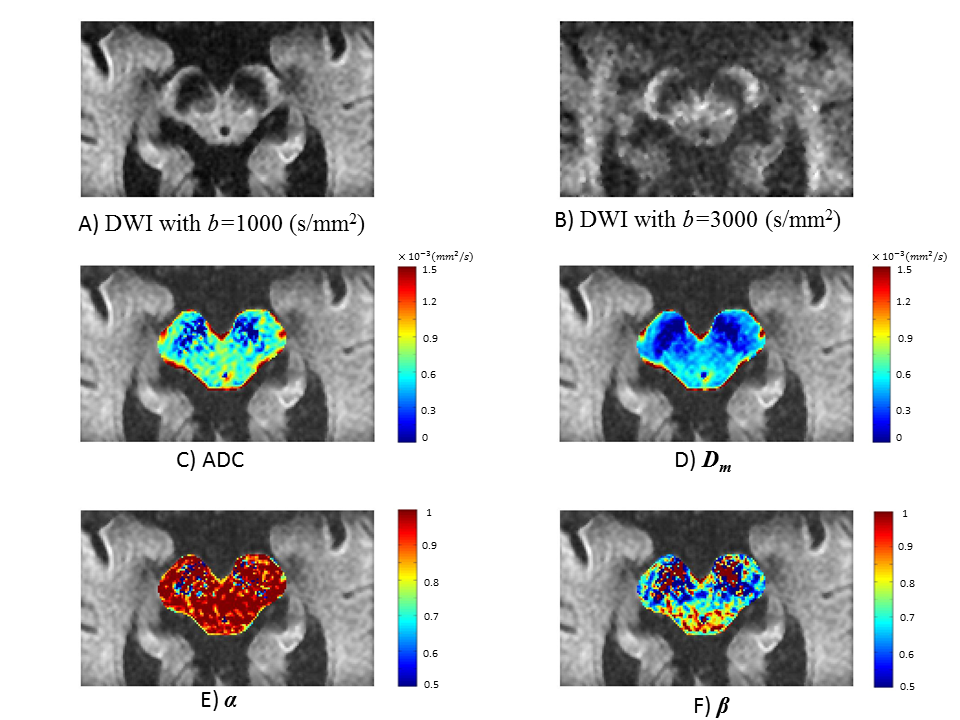
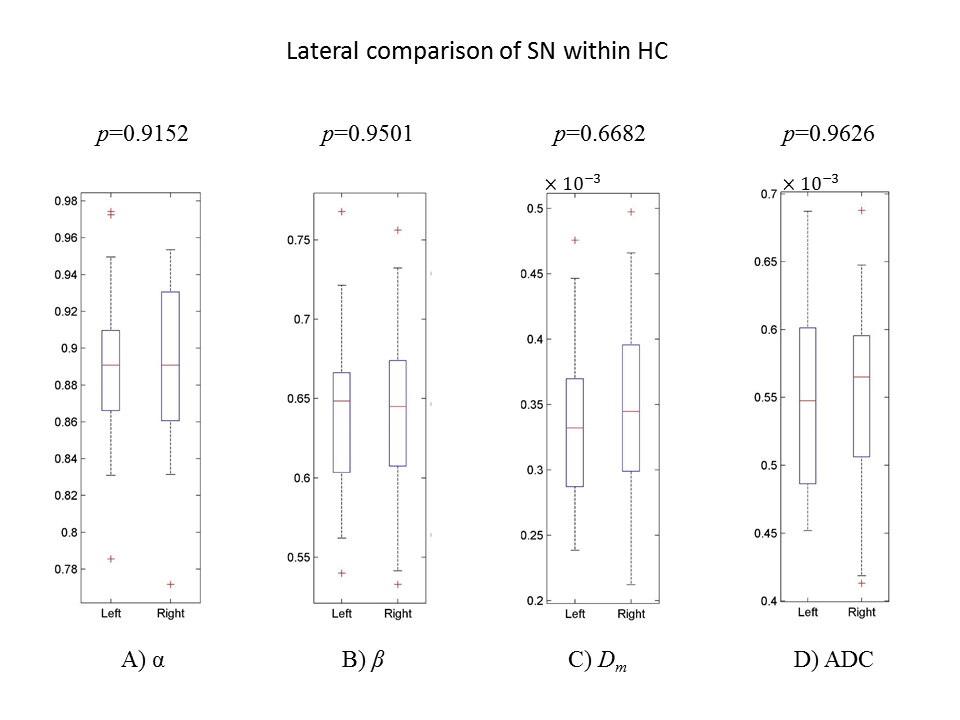
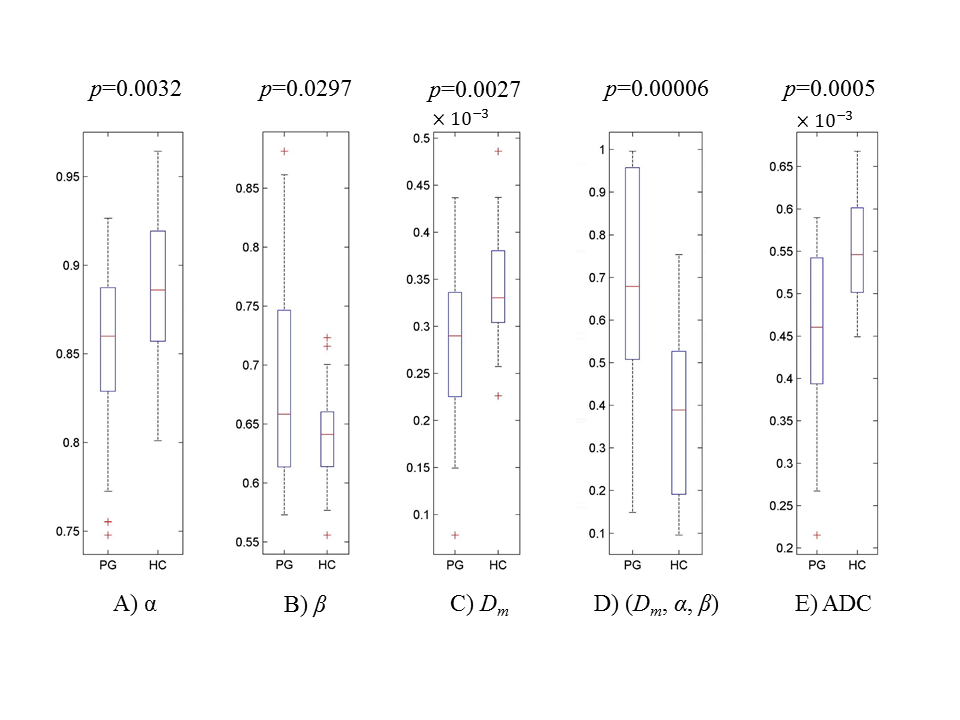
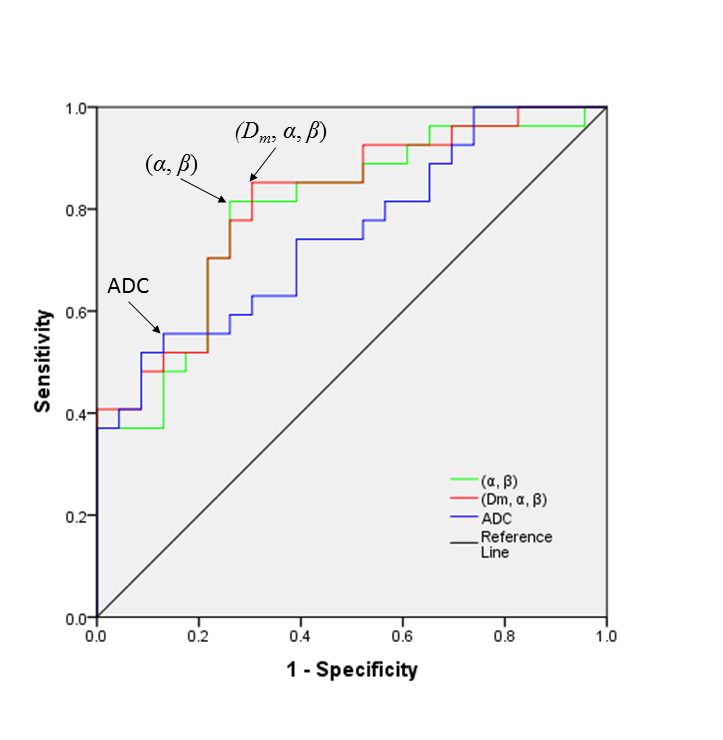
Figures 2A&B display two DW images of the brainstem from a representative PD patient at two b-values. Figures 2C-F show a set of maps of ADC, Dm, α, and β obtained from the same patient. The ADC within the brainstem was higher than Dm, possibly due to the non-Gaussian behavior that was not accounted for in the ADC calculation9. For the HC, no significant difference was observed between the left and right SN in any of the parameters (Figure 3, p>0.05). The bilateral SN regions were therefore combined and used as a reference for the subsequent comparison. For the PG, significant differences were found in the left SN, but not the right SN, when compared to the HC in all four parameters, α, β, Dm, and ADC, as well as the combination of (Dm, α, β) (Figure 4; p<0.05). The ROC curves for differentiating between the left SN of the PG and the HC are displayed in Figure 5. The combination of Dm, α, and β produced the highest area under the curve (AUC=0.812), which outperformed the ADC (AUC=0.750).Discussion and Conclusion
Significant differences in CTRW parameters, as well as ADC, between the PD patients and healthy controls were observed only on the left side of SN, whereas no such lateral distinction was seen in healthy controls. The high-resolution rFOV sequence allowed for observation of the laterally dependent abnormalities, which has not been reported previously in imaging studies. The use of the CTRW diffusion model has allowed this lateral dependence be studied based on not only diffusion coefficient (Dm or ADC), but also spatial and temporal diffusion heterogeneities (α and β)6. It is plausible to speculate that tissue microstructural changes preferentially occurred on the left side of PD patients, possibly due to handedness (all patients included in this study were right-handed). The similar change in ADC reinforces this explanation. This important observation may provide new insights into understanding the progression of PD.Acknowledgements
This work was supported in part by NIH 1S10RR028898, NIH K23NS060949, and Michael J. Fox Foundation for Parkinson's Disease. We thank Drs. Kejia Cai, Frederick C. Damen, Rong-Wen Tain, Liping Qi, and Jiaxuan Zhang for valuable discussions, and Michael Flannery and Hagai Ganin for technical assistance.References
1. Gibb, W. R. et al. Anatomy, pigmentation, ventral and dorsal subpopulations of the substantia nigra, and differential cell death in Parkinson’s disease. J. Neurol. Neurosurg. Psychiatry 54, 388–396 (1991).
2. Nagae, L. M. et al. Microstructural Changes within the Basal Ganglia Differ between Parkinson Disease Subtypes. Front. Neuroanat. 10, (2016).
3. Barrett, M. J. et al. Handedness and motor symptom asymmetry in Parkinson’s disease. J. Neurol. Neurosurg. Psychiatry 82, 1122–1124 (2011).
4. Skare, S. et al. Clinical multishot DW-EPI through parallel imaging with considerations of susceptibility, motion, and noise. Magn. Reson. Med. 57, 881–890 (2007).
5. Yi Sui et al. Image Domain Segmented Diffusion Imaging Using A 2D Excitation RF Pulse for Distortion Reduction. ISMRM, 2014
6. Karaman, M. M. et al. Differentiating low- and high-grade pediatric brain tumors using a continuous-time random-walk diffusion model at high b-values. Magn. Reson. Med. 76, 1149–1157 (2015).
7. Budday, S. et al. Physical biology of human brain development. Front. Cell. Neurosci. 9, (2015).
8. Gortmaker, S. L. et al. Applied Logistic Regression. Contemp. Sociol. 23, 159 (1994).
9. DeLano, M. C. et al. High-b-value diffusion-weighted MR imaging of adult brain: image contrast and apparent diffusion coefficient map features. AJNR Am. J. Neuroradiol. 21, 1830–1836 (2000).
Figures