0610
Diffusion tensor and restriction spectrum imaging reflect different aspects of neurodegeneration in Parkinson’s disease1Oslo University Hospital, Oslo, Norway, 2Akershus University Hospital, Lørenskog, Norway, 3Central European Institute of Technology, Brno, Czech Republic, 4University of California San Diego, La Jolla, CA, United States
Synopsis
Diffusion measures within the brain are assumed to be associated with neuronal and glial structure and integrity. In this study, we compare how diffusion tensor imaging (DTI) and restriction spectrum imaging (RSI) detect micro-structural changes within brain regions associated with motor function in Parkinson's Disease.
Introduction
Parkinson’s disease (PD) is a neurodegenerative disease, affecting both motor function and cognition. Advanced MRI such as diffusion tensor imaging (DTI), measuring diffusion of water molecules in the brain, has been utilized to study changes in neuronal integrity related to disease progression. However, conflicting results urge further investigations [1]. Motor symptoms in PD are commonly quantified by the Unified Parkinson’s Disease Rating Scale Part III (UPDRS3) [2]. Some studies have related UPDRS3 to changes in various DTI-derived parameters [3,4]. A new technique called Restriction Spectrum Imaging (RSI) [5] uses high-angular diffusion weighted (DW) imaging data obtained across multiple b-values in order to separate intracellular “restricted” diffusion behavior from extracellular diffusion over a wide range of diffusion length scales. In this study we compare the sensitivity of these parameters to discriminate between controls and PD patients, and correlate RSI- and DTI-derived parameters to the motor function in PD within pertinent regions of interest (ROIs); cerebellar cortex (CC), cerebellar white matter (CWM), and thalamus, all of which are associated with motor function.Materials and Methods
47 PD patients (age: 63.2+/-9.9) and 57 controls (age: 67.2+/-7.2) were imaged on a 3 T Siemens Prisma scanner. The protocol included T1 weighted MRI, Spin-Echo Echo-Planar-Imaging (SE-EPI) with DW-contrast of b=0, 500, 1000, 2000, 3000 and 4000s/mm^2, and 30 non-collinear diffusion gradient directions for each b-value, and a single SE-EPI volume acquired at b=0 and opposite phase to allow for EPI-distortion correction. EPI-distortion, eddy-current and movement corrections were done using FMRIB Software Library v5.0. A standard tensor model was fit to the DW-data and the descriptive parameters Fractional anisotropy (FA), Mean (MD), Axial (AD) and Radial diffusivity (RD) were derived. RSI [5] models the high-angular DW data based on the parameterization of the fiber orientation density function (FOD) using spherical harmonics, combined with an axially-symmetric Gaussian model. At each reconstruction point, the spectrum was defined by DT/DL = [0, ... , 0.9] at intervals of 0.1 (DL being the longitudinal, and DT the transversal diffusivity). In addition, spherically restricted diffusion, i.e. DT = 0 and DL = 0, hindered/free diffusion at max DT = DL = 3e^-3 were included in the model. For the purpose of this study we focused on the signal weight from the spherically restricted diffusion compartment (”cellularity index; CI) and the weight of the 0th-order of the deconvoluted restricted FOD (DT/DL = 0, defined here as "mean tubularity"; MT). RSI post-processing was done in Matlab R2015b. The structural images underwent the FreeSurfer pipeline, and DW-images were coregistered and resliced into common space using FreeSurfer v5.3.0. ROIs as defined and implemented by FreeSurfer [6] (figure 1), average values for each diffusion parameter, and ROI volume size were extracted from the thalamus (left and right), and the cerebellum (left and right). Statistical analyses were performed using SPSS. The effect of age and relative ROI-size were regressed out, and differences between groups were determined using a two-tailed t-test of independent samples. Correlation between UPDRS3 and diffusion indices (PD-group only, age and volume regressed out) was measured using Pearson correlation.Results
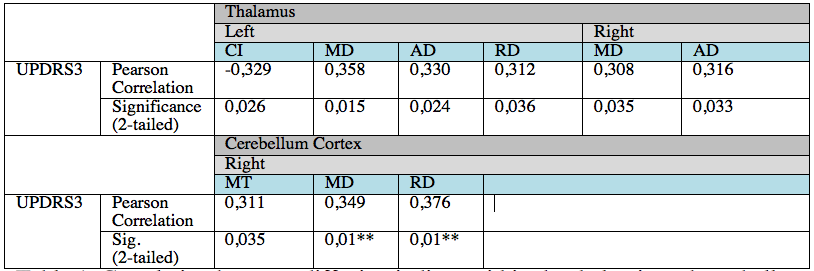
Correlation results in table 1 along with correlation plot of RD and UPDRS3 score in figure 2.A. Group differences were significant for MT and AD within the thalamic ROIs, with decreased MT and AD within the patient group compared to the control group (approx 2% decrease; MT: left/right p = 0.007/0.001 and AD; left/right p=0.035/0.025). Controlling for multiple comparisons (p<0.008), only the right thalamic ROI demonstrated significant group difference using MT (figure 2.B), whereas MD and RD within the Cerebellar cortex (right side) are close to significant correlation with UPDRS3 at p=0.01 .Discussion and Conclusion
By analyzing group differences in diffusion parameters between controls and PD patients, and testing correlations between UPDRS3 score and diffusion parameters within two ROIs suspected to be related to motor dysfunction, we show that the DTI and the RSI models likely reflect different aspects of neurodegeneration in PD. RSI-derived MT within the thalamus significantly differentiated between groups, whereas DTI-derived RD and MD demonstrated the strongest correlation with motor function. DTI-derived parameters represent extracellular diffusion, and increased RD (and MD) is commonly associated with demyelination and loss of structural organization. In contrast, decreased MT, which represents intracellular restricted anisotropic diffusion, may implicate neuronal/axonal damage in regions where motor function is not affected. We hypothesize that as MT and RD relate to different pathological features of PD, MT might act as a complimentary measure of neurodegeneration. Further investigations are needed in order to identify MT as a sensitive, independent biomarker of brain pathology.Acknowledgements
No acknowledgement found.References
[1] Al-Radaideh, et al. The role of magnetic resonance imaging in the diagnosis of Parkinson's disease: a review. Clinical Imaging 40.5 (2016): 987-996. 1.
[2] Fahn S, Elton R, Members of the updrs Development Committee. In: Fahn S, Marsden CD, Calne DB, Goldstein M, eds. Recent Developments in Parkinson’s Disease, Vol 2. Florham Park, NJ. Macmillan Health Care Information 1987, 153-163, 293-304.
[3] Planetta, Peggy J., et al. Thalamic projection fiber integrity in de novo Parkinson disease, American Journal of Neuroradiology 34.1 (2013): 74-79.
[4] Modrego, Pedro J., et al. Correlation of findings in advanced MRI techniques with global severity scales in patients with Parkinson disease, Academic radiology 18.2 (2011): 235-241.
[5] White, Nathan S., et al. Probing tissue microstructure with restriction spectrum imaging: histological and theoretical validation., Human brain mapping 34.2 (2013): 327-346.
Figures
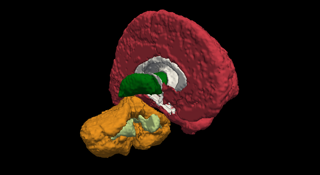
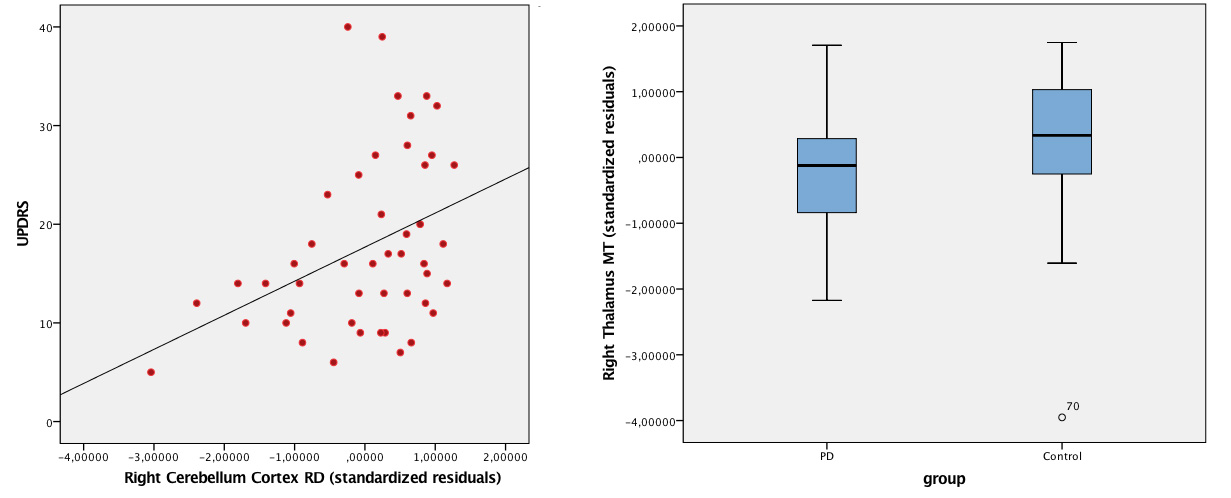
Figure 2: A: correlation plots between UPDRS3 and RD Right Cerebellum Cortex. B: Boxplot of group difference between PD and Controls within Right Thalamus, using MT. Plots show the standard residuals of RD and MT when correcting for age and ROI-volume.