0609
Phantom Validation of Diffusion-Relaxation Correlation Spectroscopic Imaging (DR-CSI)1Electrical Engineering, University of Southern California, Los Angeles, CA, United States, 2Biomedical Engineering, University of Southern California, Los Angeles, CA, United States, 3Cardiology, Children's Hospital Los Angeles, Los Angeles, CA, United States, 4Radiology, Children's Hospital Los Angeles, Los Angeles, CA, United States
Synopsis
Diffusion-relaxation correlation spectroscopic imaging (DR-CSI) is a novel multidimensional MR imaging approach that infers microscopic tissue compartments using simultaneous diffusion and relaxation information. The approach was previously demonstrated with biological data, although validation was not possible in the absence of a gold standard reference. In this work, we perform simulation and experimental studies, using a gold standard for validation. Specifically, we custom-built a multi-compartment diffusion-relaxation phantom with known characteristics, and performed extensive comparisons between DR-CSI and conventional multi-compartment estimation methods. Our results demonstrate that DR-CSI has good performance, enabled by the combination of multidimensional encoding and constrained spectroscopic image reconstruction.
Purpose
Diffusion-relaxation correlation spectroscpic imaging (DR-CSI) was recently proposed as a novel multidimensional MR imaging approach for probing microstructure1. DR-CSI combines the multidimensional encoding of diffusion and relaxation information with an advanced multidimensional spectroscopic image reconstruction approach. Specifically, DR-CSI measures data with different combinations of multiple b-values and echo times, and then estimates a 2D diffusion-relaxation correlation spectrum at every voxel using the multi-compartment signal model defined by:
$$M(x,y,b,TE)=\int\int F(x,y,D,T_2 )~e^{-bD} e^{-TE/T_2} dD~dT_2$$
where $$$M(x,y,b,TE)$$$ is the measured data at position $$$(x,y)$$$, and $$$F(x,y,D,T_2)$$$ is the unknown (to be estimated) 4D spectroscopic image. Spectroscopic image estimation is performed by solving a dictionary-based spatially-regularized nonnegative least squares optimization problem1. In previous work1, DR-CSI was evaluated on control and injured ex vivo mouse spinal cords, and was demonstrated to resolve several apparent tissue compartments that were not resolved using standard methods. While these compartmental maps showed great promise (consistent with the expected anatomy), no gold standard was available to confirm the accuracy of the DR-CSI results. In this work, we construct gold standards and validate DR-CSI with numerical simulations and phantom experiments.
Methods
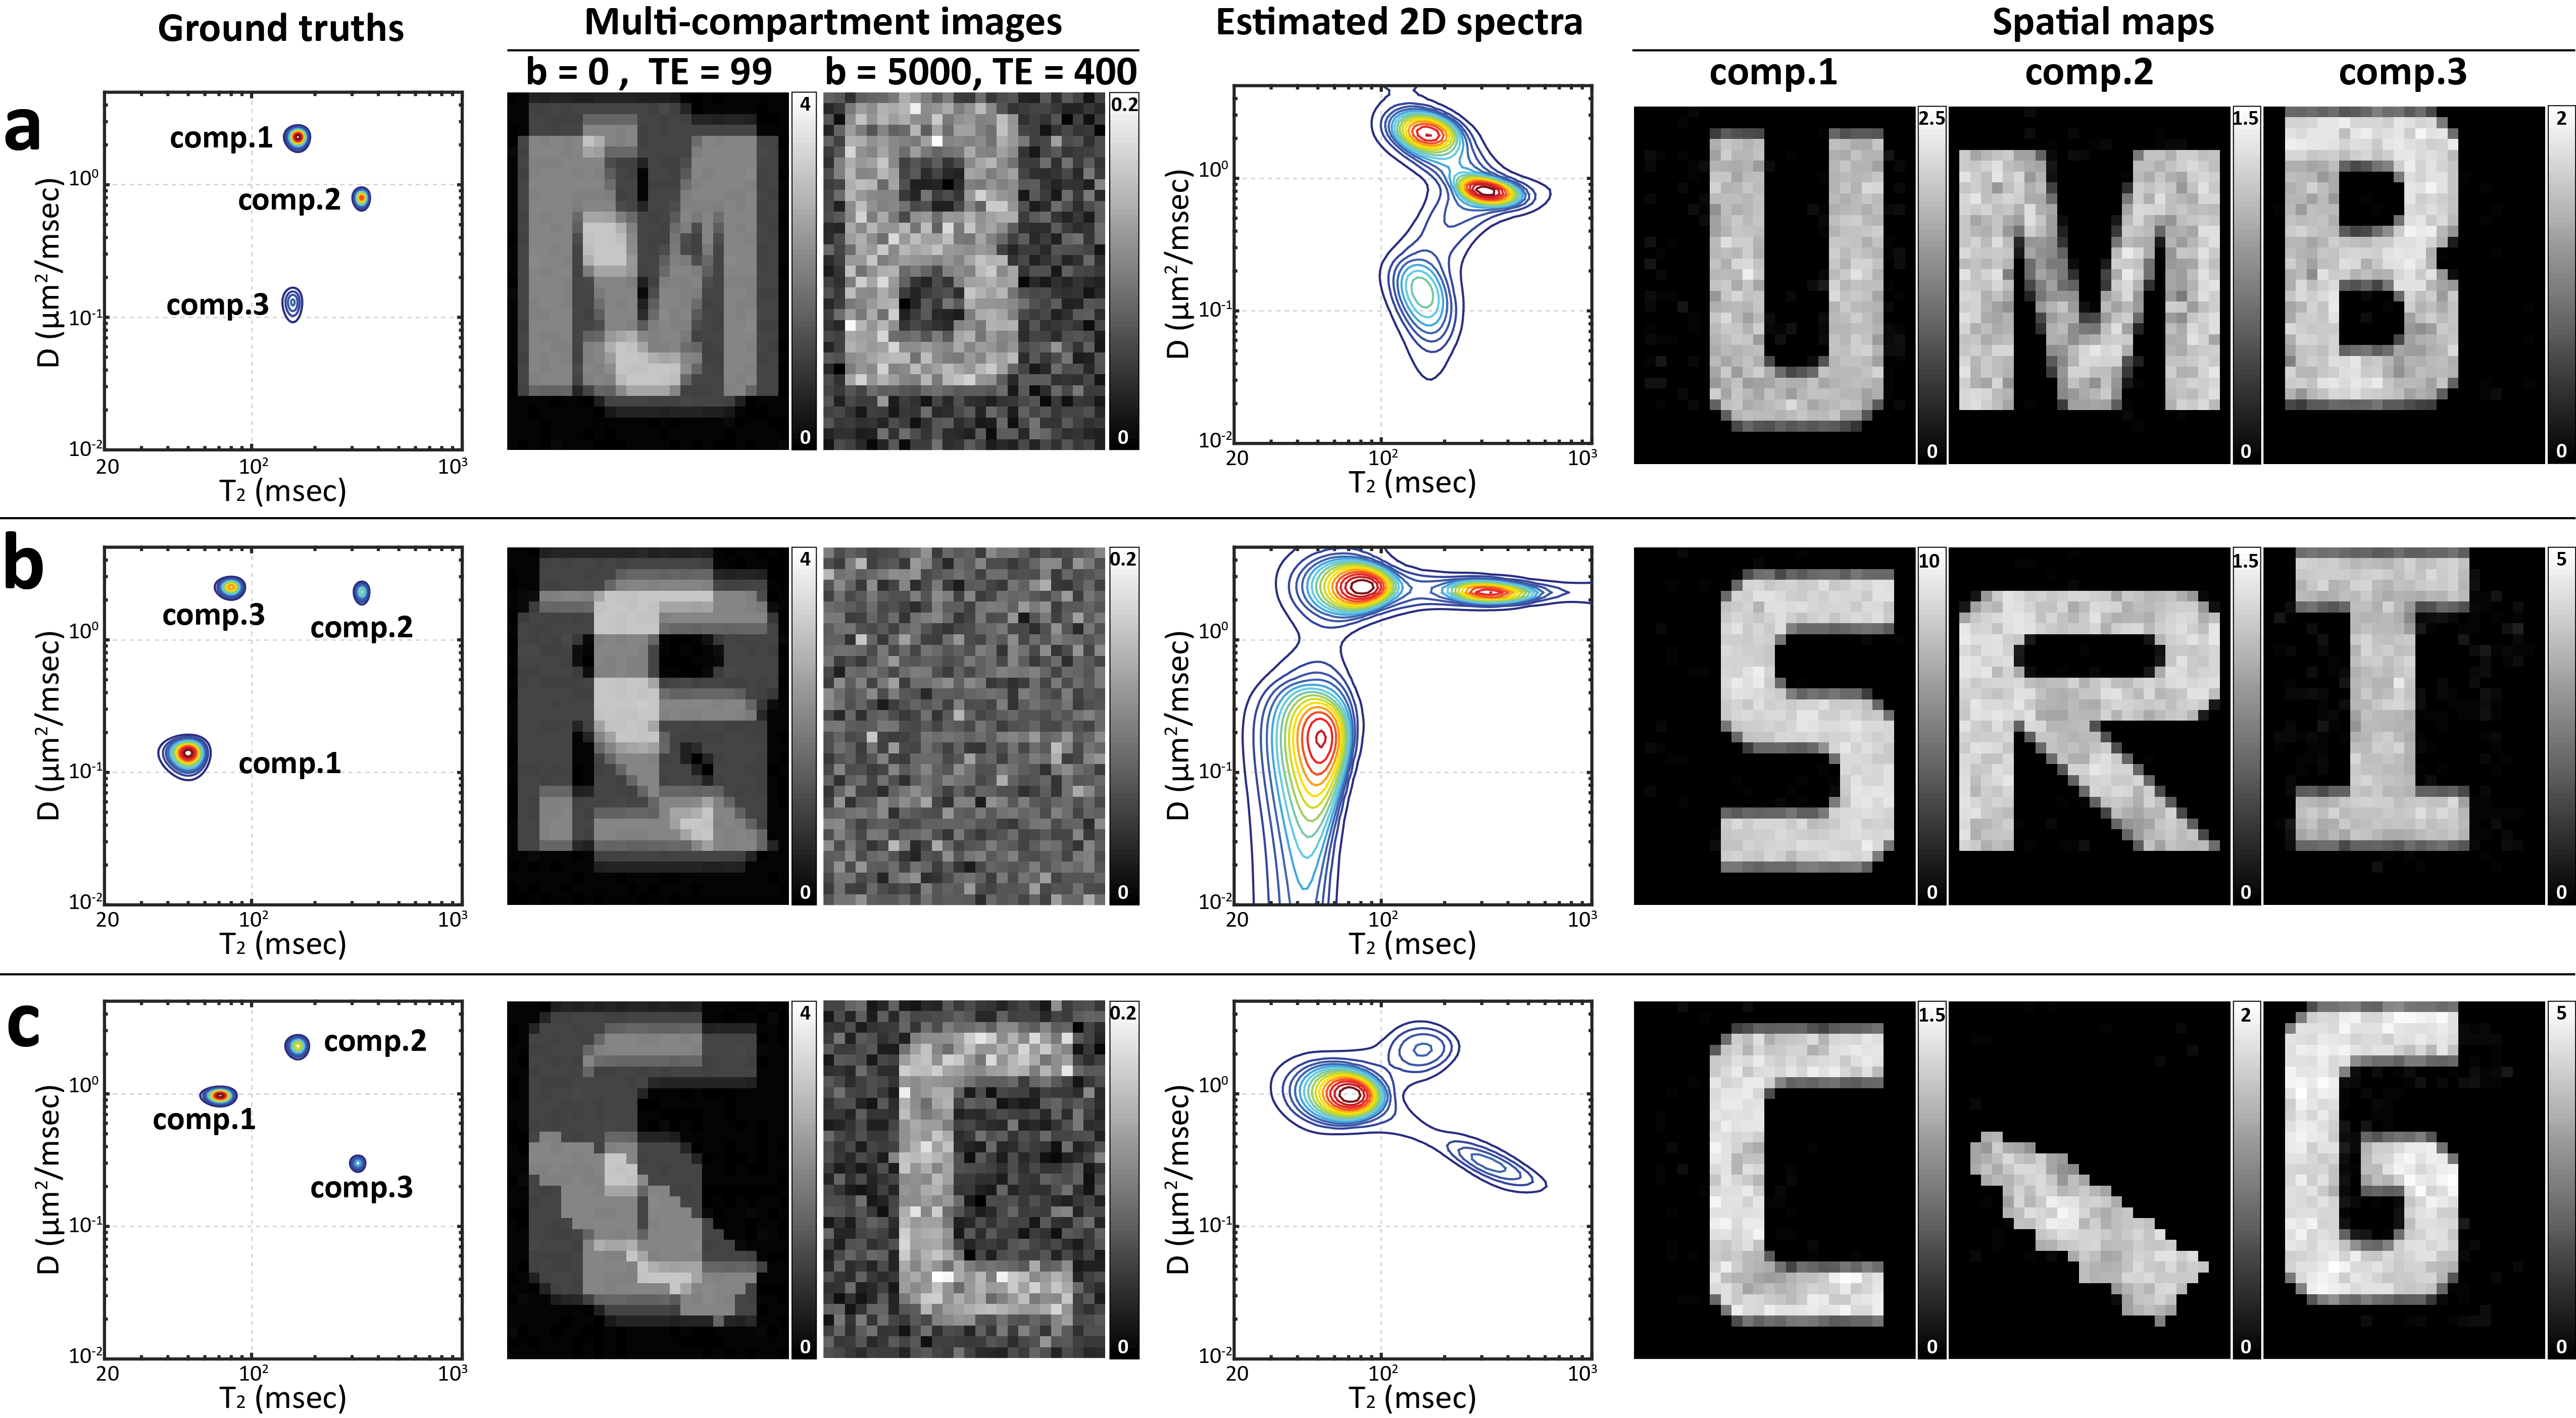
Numerical simulations: Three different numerical simulation datasets were constructed. Each simulation was designed using a 3-compartment model where each compartment has a distinct single-peak $$$D$$$-$$$T_2$$$ spectrum. For each multi-compartment simulation, noiseless DR-CSI data was sampled at every combination of 7 b-values (0, 200, 500, 1000, 1500, 2500 and 5000s/mm2) and 7 TEs (99, 120, 150, 190, 240, 300 and 400ms), for a total of 49 images. Gaussian noise was added to these images, and the magnitude was taken leading to Rician-distributed signal. The left three columns of Figure 1 illustrate the setup of each simulation.
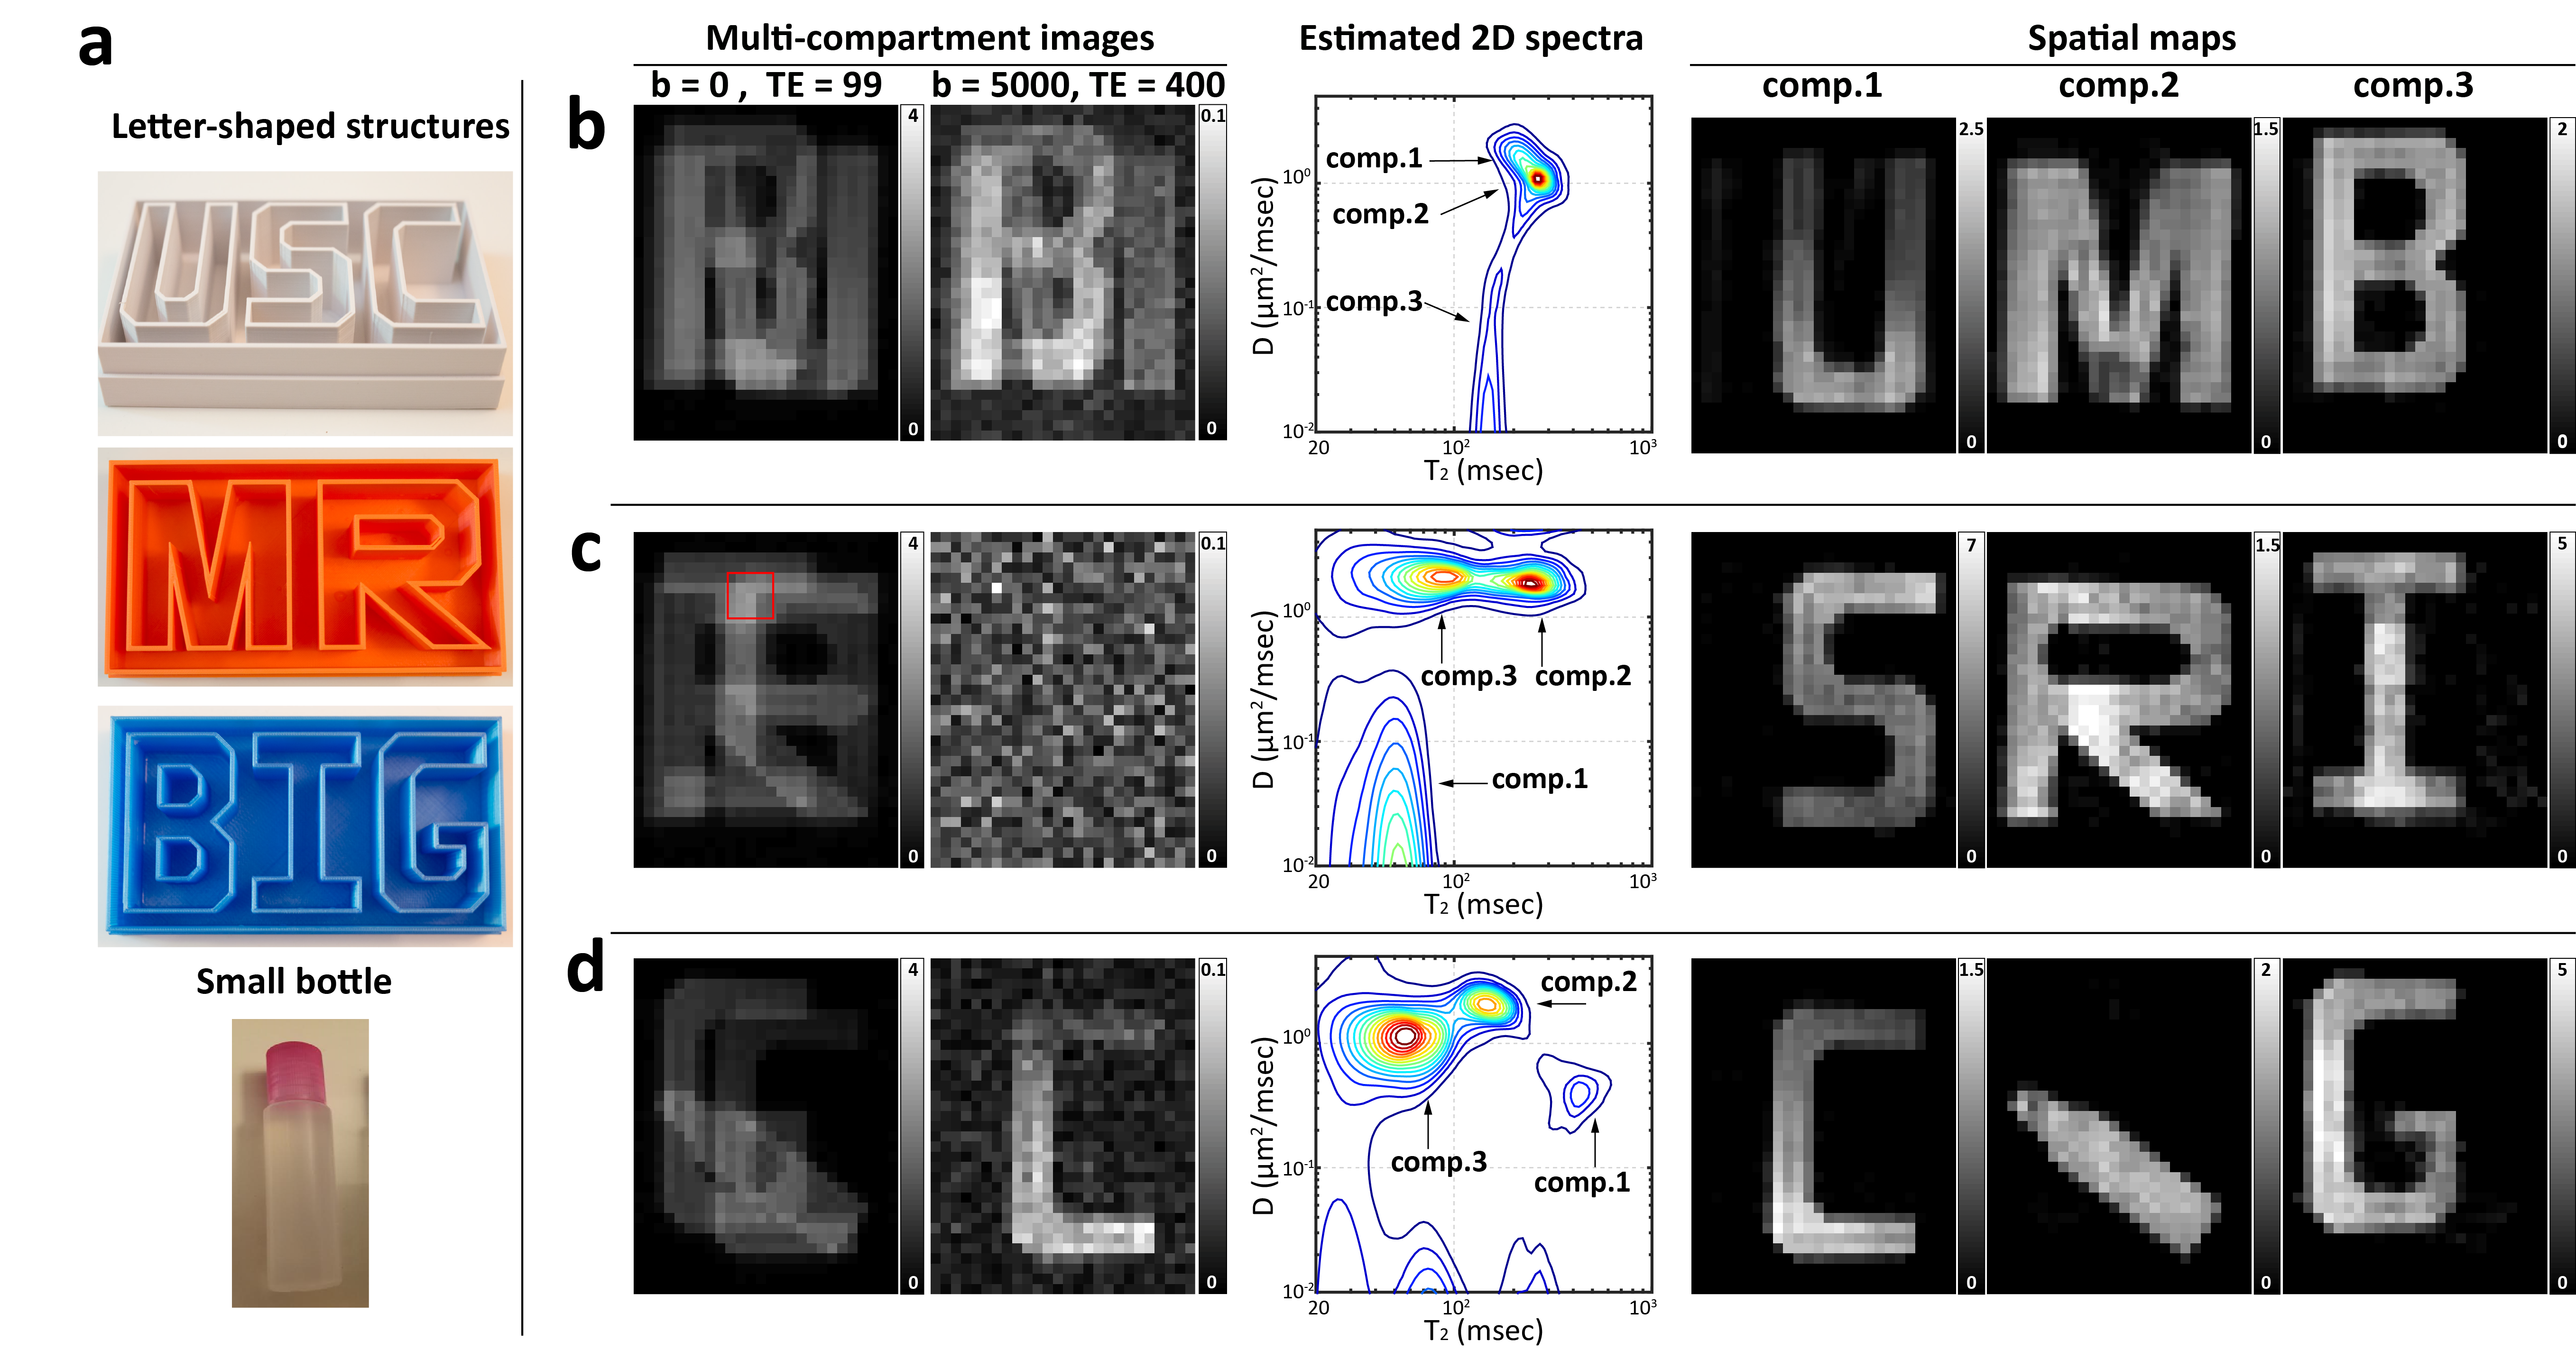
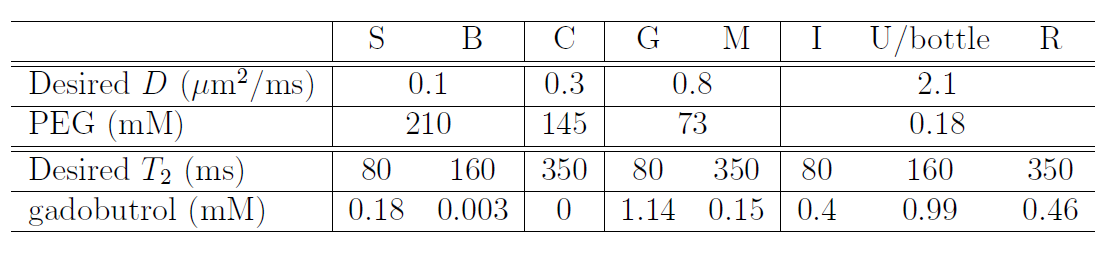
Phantom experiment: We built a diffusion-relaxation phantom with similar geometric structures to the previous numerical simulation, as shown in Figure 2(a). The letter-shaped structures were 3D printed, and waterproofed using liquid rubber2. Each compartment of the phantom was filled with a different solution of Polyethylene Glycol (PEG) and gadobutrol to achieve the specific $$$D$$$ and $$$T_2$$$ values listed in Table 13. Experimental data was acquired at 3T MRI (Philips, Best, The Netherlands) using a diffusion-weighted spin-echo imaging sequence with the following parameters: TR=11000ms, voxel size=3mmx3mm, matrix size=64x40, slice thickness=5mm, and 33 slices. For contrast encoding, we used the same set of b-values and TEs from the numerical simulations. Three different 3-compartment datasets were generated by overlaying single-compartment data from different slices (the left two columns of Fig. 2(b-d)).
Results and Discussion
Fig.1 shows the DR-CSI results of the numerical simulations. The DR-CSI based spectra (averaged across all voxels) are plotted in the fourth column. Each spectrum shows three distinct peaks that are consistent with the ground truth spectra. Compared to the ground truth, the estimated peaks have broader lineshapes as a consequence of the finite spectral resolution related to finite data sampling and noise. In each simulation, spatial maps of each integrated peak are shown in the last 3 columns, and the maps reveal successful separation of the three original compartments.
Fig. 2(b-d) shows the DR-CSI results from the phantom experiment. In each case, the integrated spectral peaks are consistent with the characteristics of the PEG-gadobutrol solutions from Table 1. The spectral characteristics of real data are less regular than they were in simulation. This is likely due to a variety of factors, including truly non-Gaussian spectral lineshapes, spatial variations in the PEG-gadobutrol concentration, chemical shift artifacts from the PEG spectrum3, and external factors like B0 inhomogeneity. Nevertheless, three distinct spectral peaks are still resolved in all cases, which successfully map back to the original compartmental geometry. Figure 3 shows individual DR-CSI spectra from the dataset of Fig. 2(c) at voxels where different compartmental geometries are superposed.
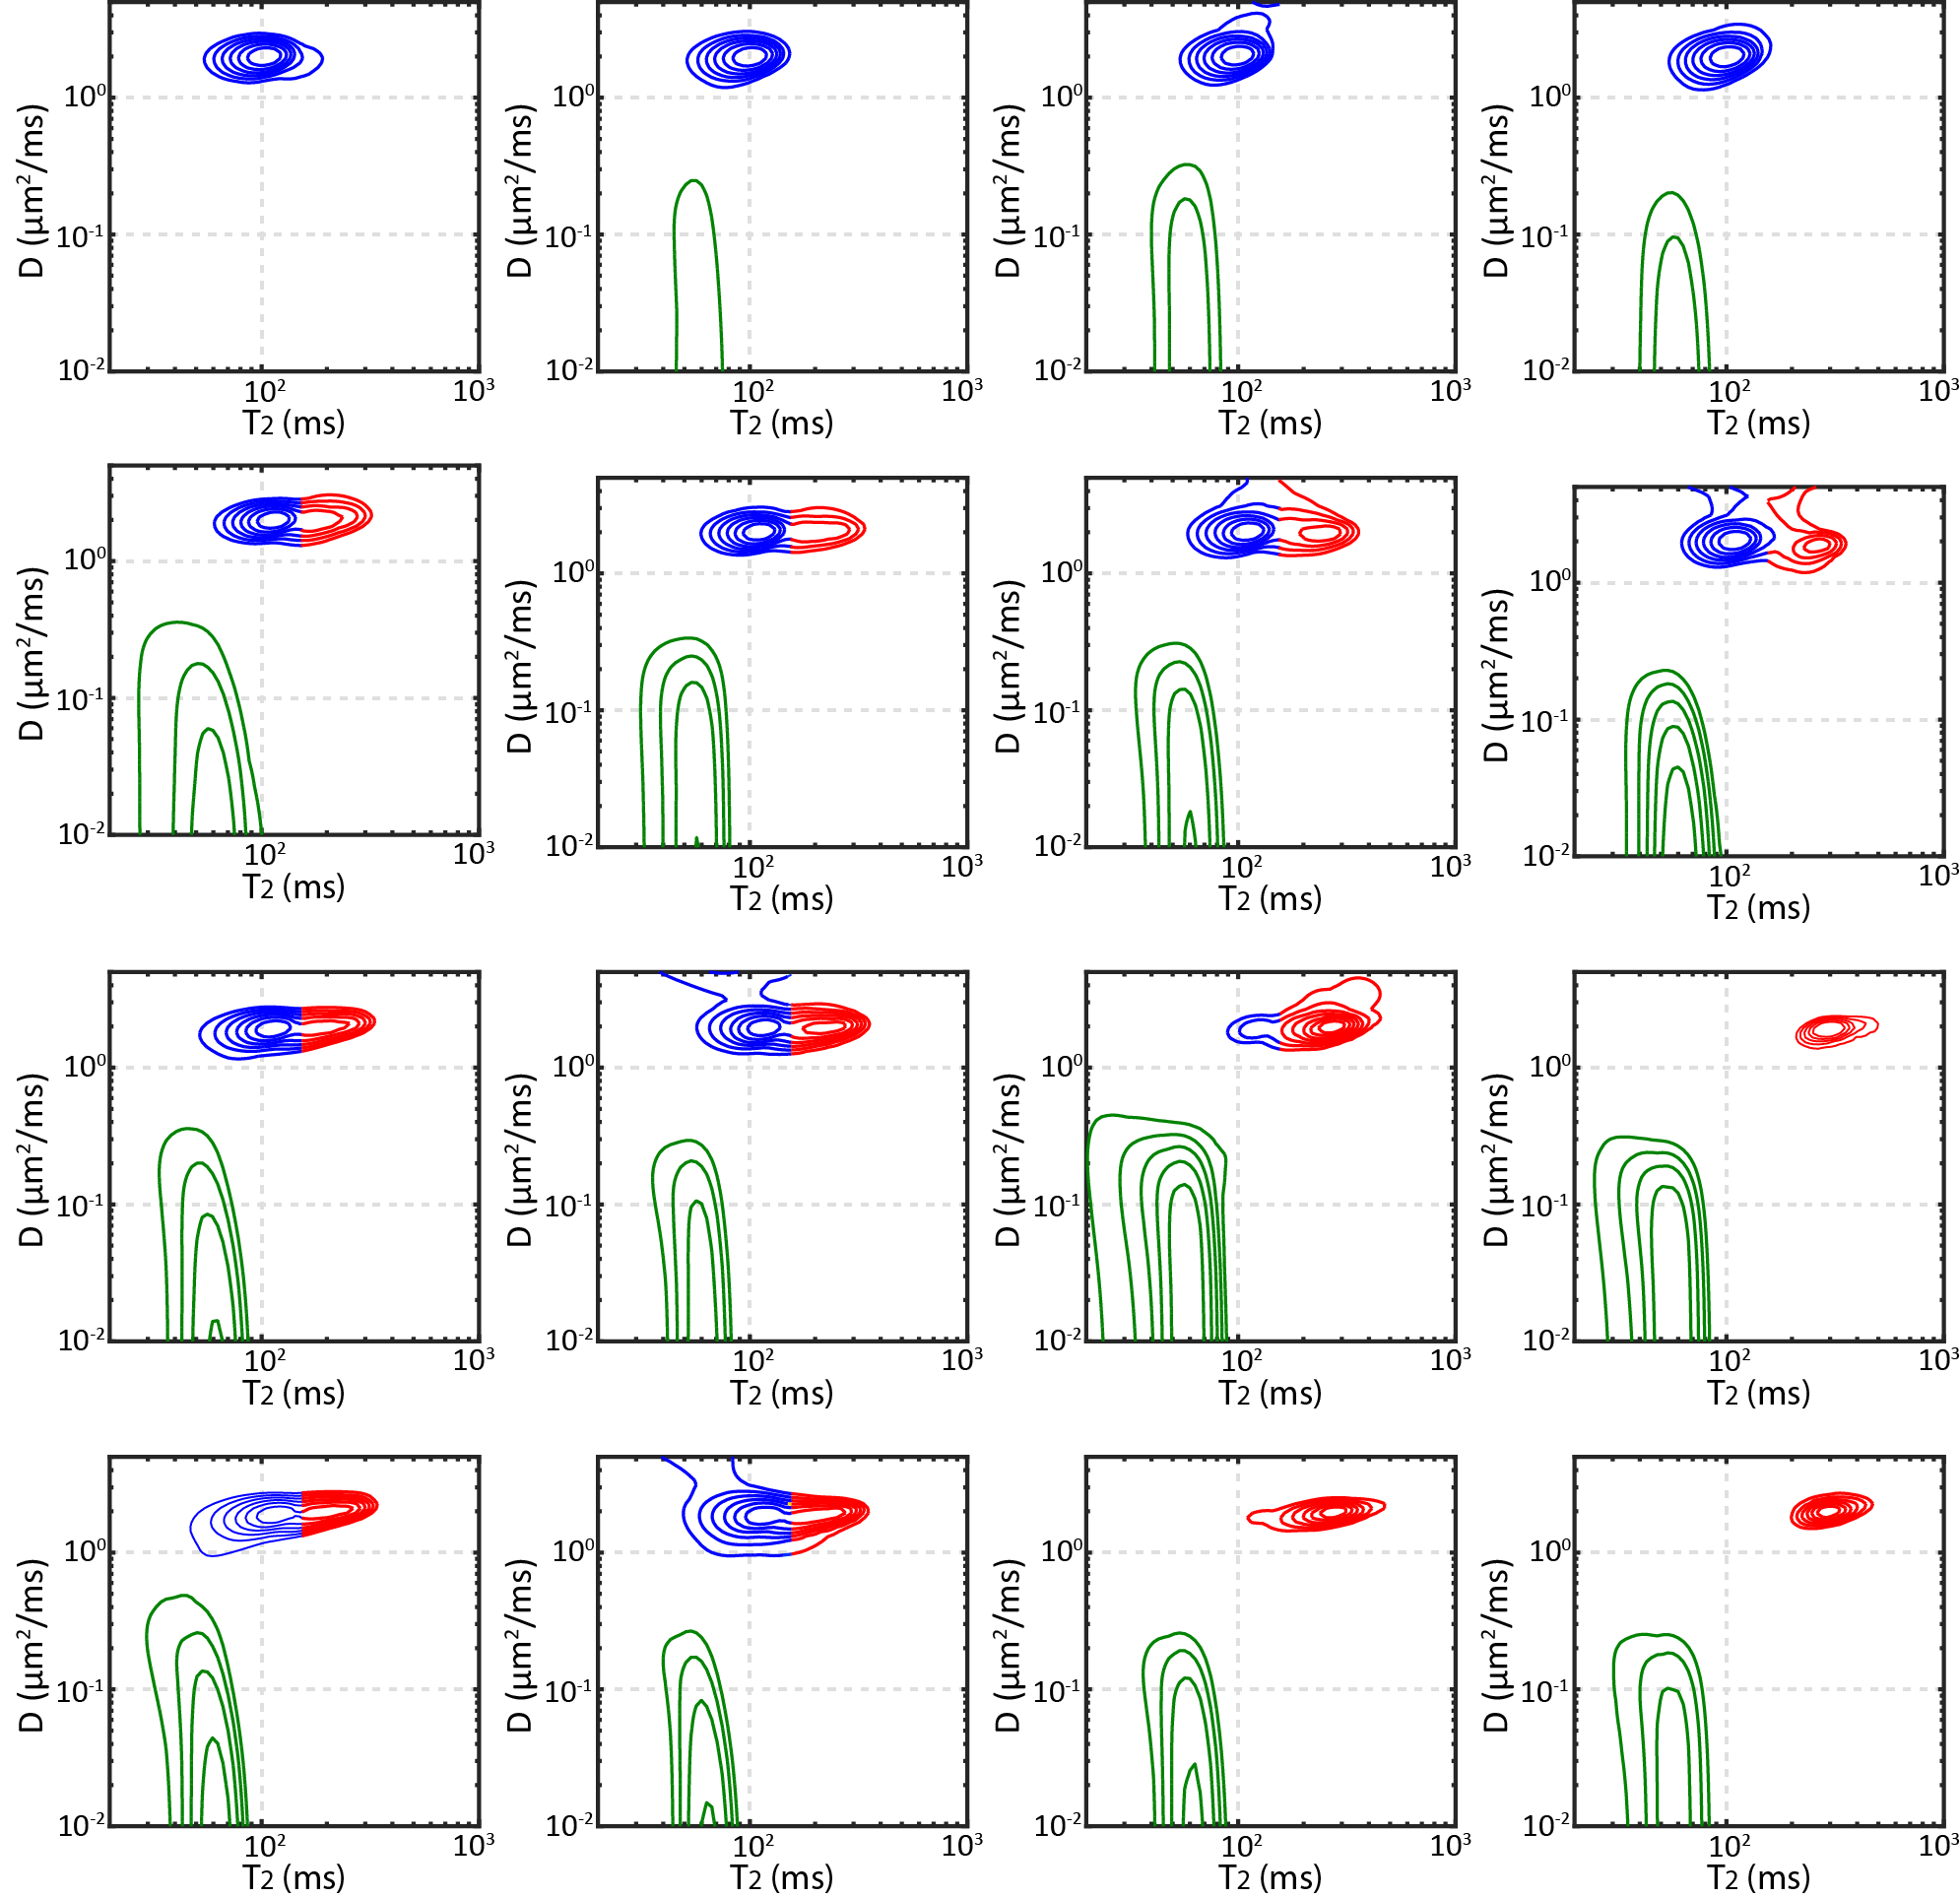
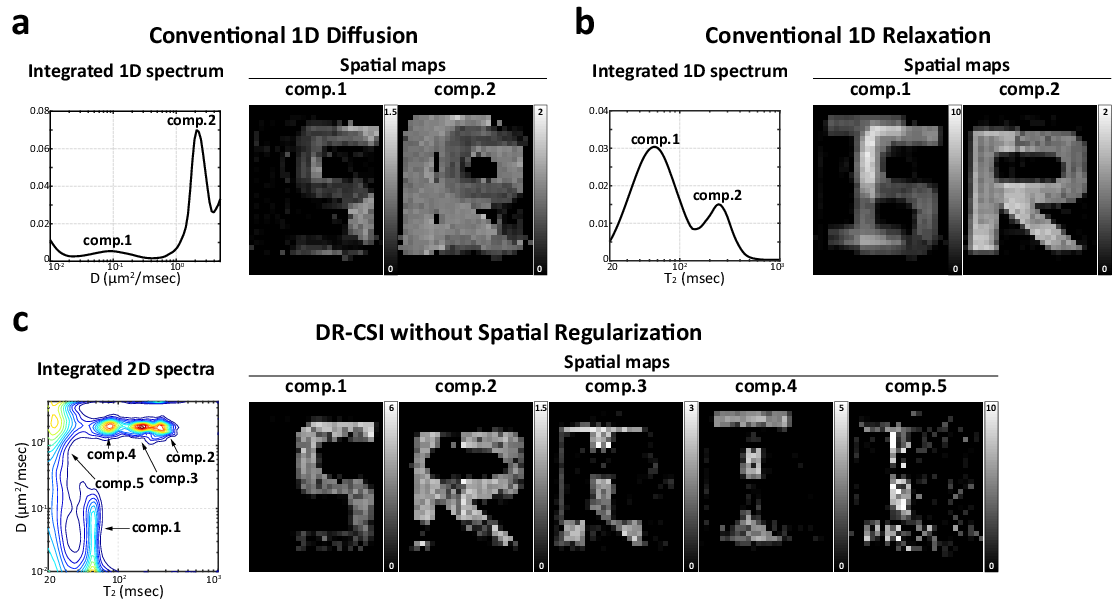
Figure 4 shows the results from conventional 1D diffusion, conventional 1D relaxation, and voxel-by-voxel DR-CSI (with no spatial regularization, like DR-COSY4-5). The integrated spectra for the conventional 1D methods only show two distinct peaks instead of three. Corresponding spatial maps of these peaks demonstrate that it is difficult to separate compartments when the decay parameters are too similar to one another. The voxel-by-voxel DR-COSY results contains more peaks than the original number of compartments, which also leads inaccurate spatial maps. These results demonstrate that both the multidimensional contrast encoding and the constrained image reconstruction are important for the performance of DR-CSI.
Conclusions
We have validated DR-CSI with numerical simulations and phantom experiments, and demonstrated that DR-CSI can successfully resolves overlapping multi-compartments. Combined with the results from previous work1, these results strongly support the potential advantages of DR-CSI for imaging microscopic tissue compartments.Acknowledgements
This work was supported in part by NSF award CCF-1350563 and NIH grants R21-EB022951, R01-NS089212 and R01-DK097115. The authors thank Dr. John Wood for providing access to wet lab facilities and supplies, and Philips Healthcare for clinical science support.References
1. Kim D, Kim JH, Haldar JP. Diffusion-relaxation correlation spectroscopic imaging (DR-CSI): An enhanced approach to imaging microstructure. In: Proc. Int. Soc. Magn. Reson. Med. 2016; p. 660.
2. Larry Wald's group. Martinos Center Anthropomorphic Phantoms. https://phantoms.martinos.org/Main_Page. Accessed November 7, 2016.
3. Gatidis S, Schmidt H, Martirosian P, Schwenzer NF. Development of an MRI phantom for diffusion-weighted imaging with independent adjustment of apparent diffusion coefficient values and T2 relaxation times. Magn Reson Med 2013;72:459-463.
4. Hürlimann MD, Venkataramanan L, Flaum C. The diffusion-spin relaxation time distribution function as an experimental probe to characterize fluid mixtures in porous media. J Chem Phys 2002;117:10223-10232.
5. Callaghan PT, Godefroy S, Ryland BN. Use of the second dimension in PGSE NMR studies of porous media. Magn Reson Imaging 2003;21:243-248.
Figures