0605
Histological Validation of Orientation Dispersion and Fiber Orientation1Department of Biomedical Engineering, Vanderbilt University, Nashville, TN, United States, 2Department of Psychology, Vanderbilt University, Nashville, TN, United States, 3Department Electrical Engineering, Vanderbilt University, Nashville, TN, United States
Synopsis
In this study, using 3D confocal microscopy to extract histological fiber orientation distributions, we validate tract-specific measures of dispersion and orientation derived from high angular resolution diffusion imaging techniques. We find a correlation between histological and diffusion measures of dispersion in q-ball imaging and constrained spherical deconvolution. We also find that an increased dispersion leads to greater error in fiber orientation estimates, as well as the presence of false positive peaks in the diffusion profiles. Future work will validate these measures in more high angular resolution diffusion techniques and microstructural models.
PURPOSE:
Diffusion MRI (dMRI) allows characterization of neurite orientation and morphology, which have been used to map structural connectivity and provide clinically relevant microstructural indices. Recently, tract-specific metrics of anisotropy based on the fiber (and diffusion) orientation distribution functions (fODF, dODF) have been proposed [1-3].Specifically, measures of orientation dispersion (OD) have been shown to increase specificity to neurite microstructure and aid in fiber tractography. Here, using 3D confocal microscopy, we extract the histological fODF and examine the relationship between the histological OD and the dMRI estimates of OD. We investigate the relationships (1) between OD and the accuracy of orientation estimation and (2) between histological OD and the presence of false positive peaks.METHODS:
MRI: Three formalin fixed squirrel monkey brains were imaged on a 9.4T Varian scanner, with dMRI performed at a b-value of 6,000s/mm2 and with 107 gradient directions. Local reconstruction was performed using DTI, constrained spherical deconvolution (CSD) [4] and q-ball imaging (QBI) [5]. The resulting ODF was fit to Bingham (or multi-Bingham) distributions, from which OD(s) and peak orientation(s) were extracted.
HISTOLOGY: 3D confocal data was collected in ~250 volumes equivalent in size to MRI voxels. Confocal data were registered to the same specimens’ MRI data, and histological fODFs were extracted following [6]. Those exhibiting the presence of only a single fiber population (only 1 local maximum) were used for this study (N=188), and subsequently fit to a Bingham distribution to extract peak orientation and OD.
RESULTS:
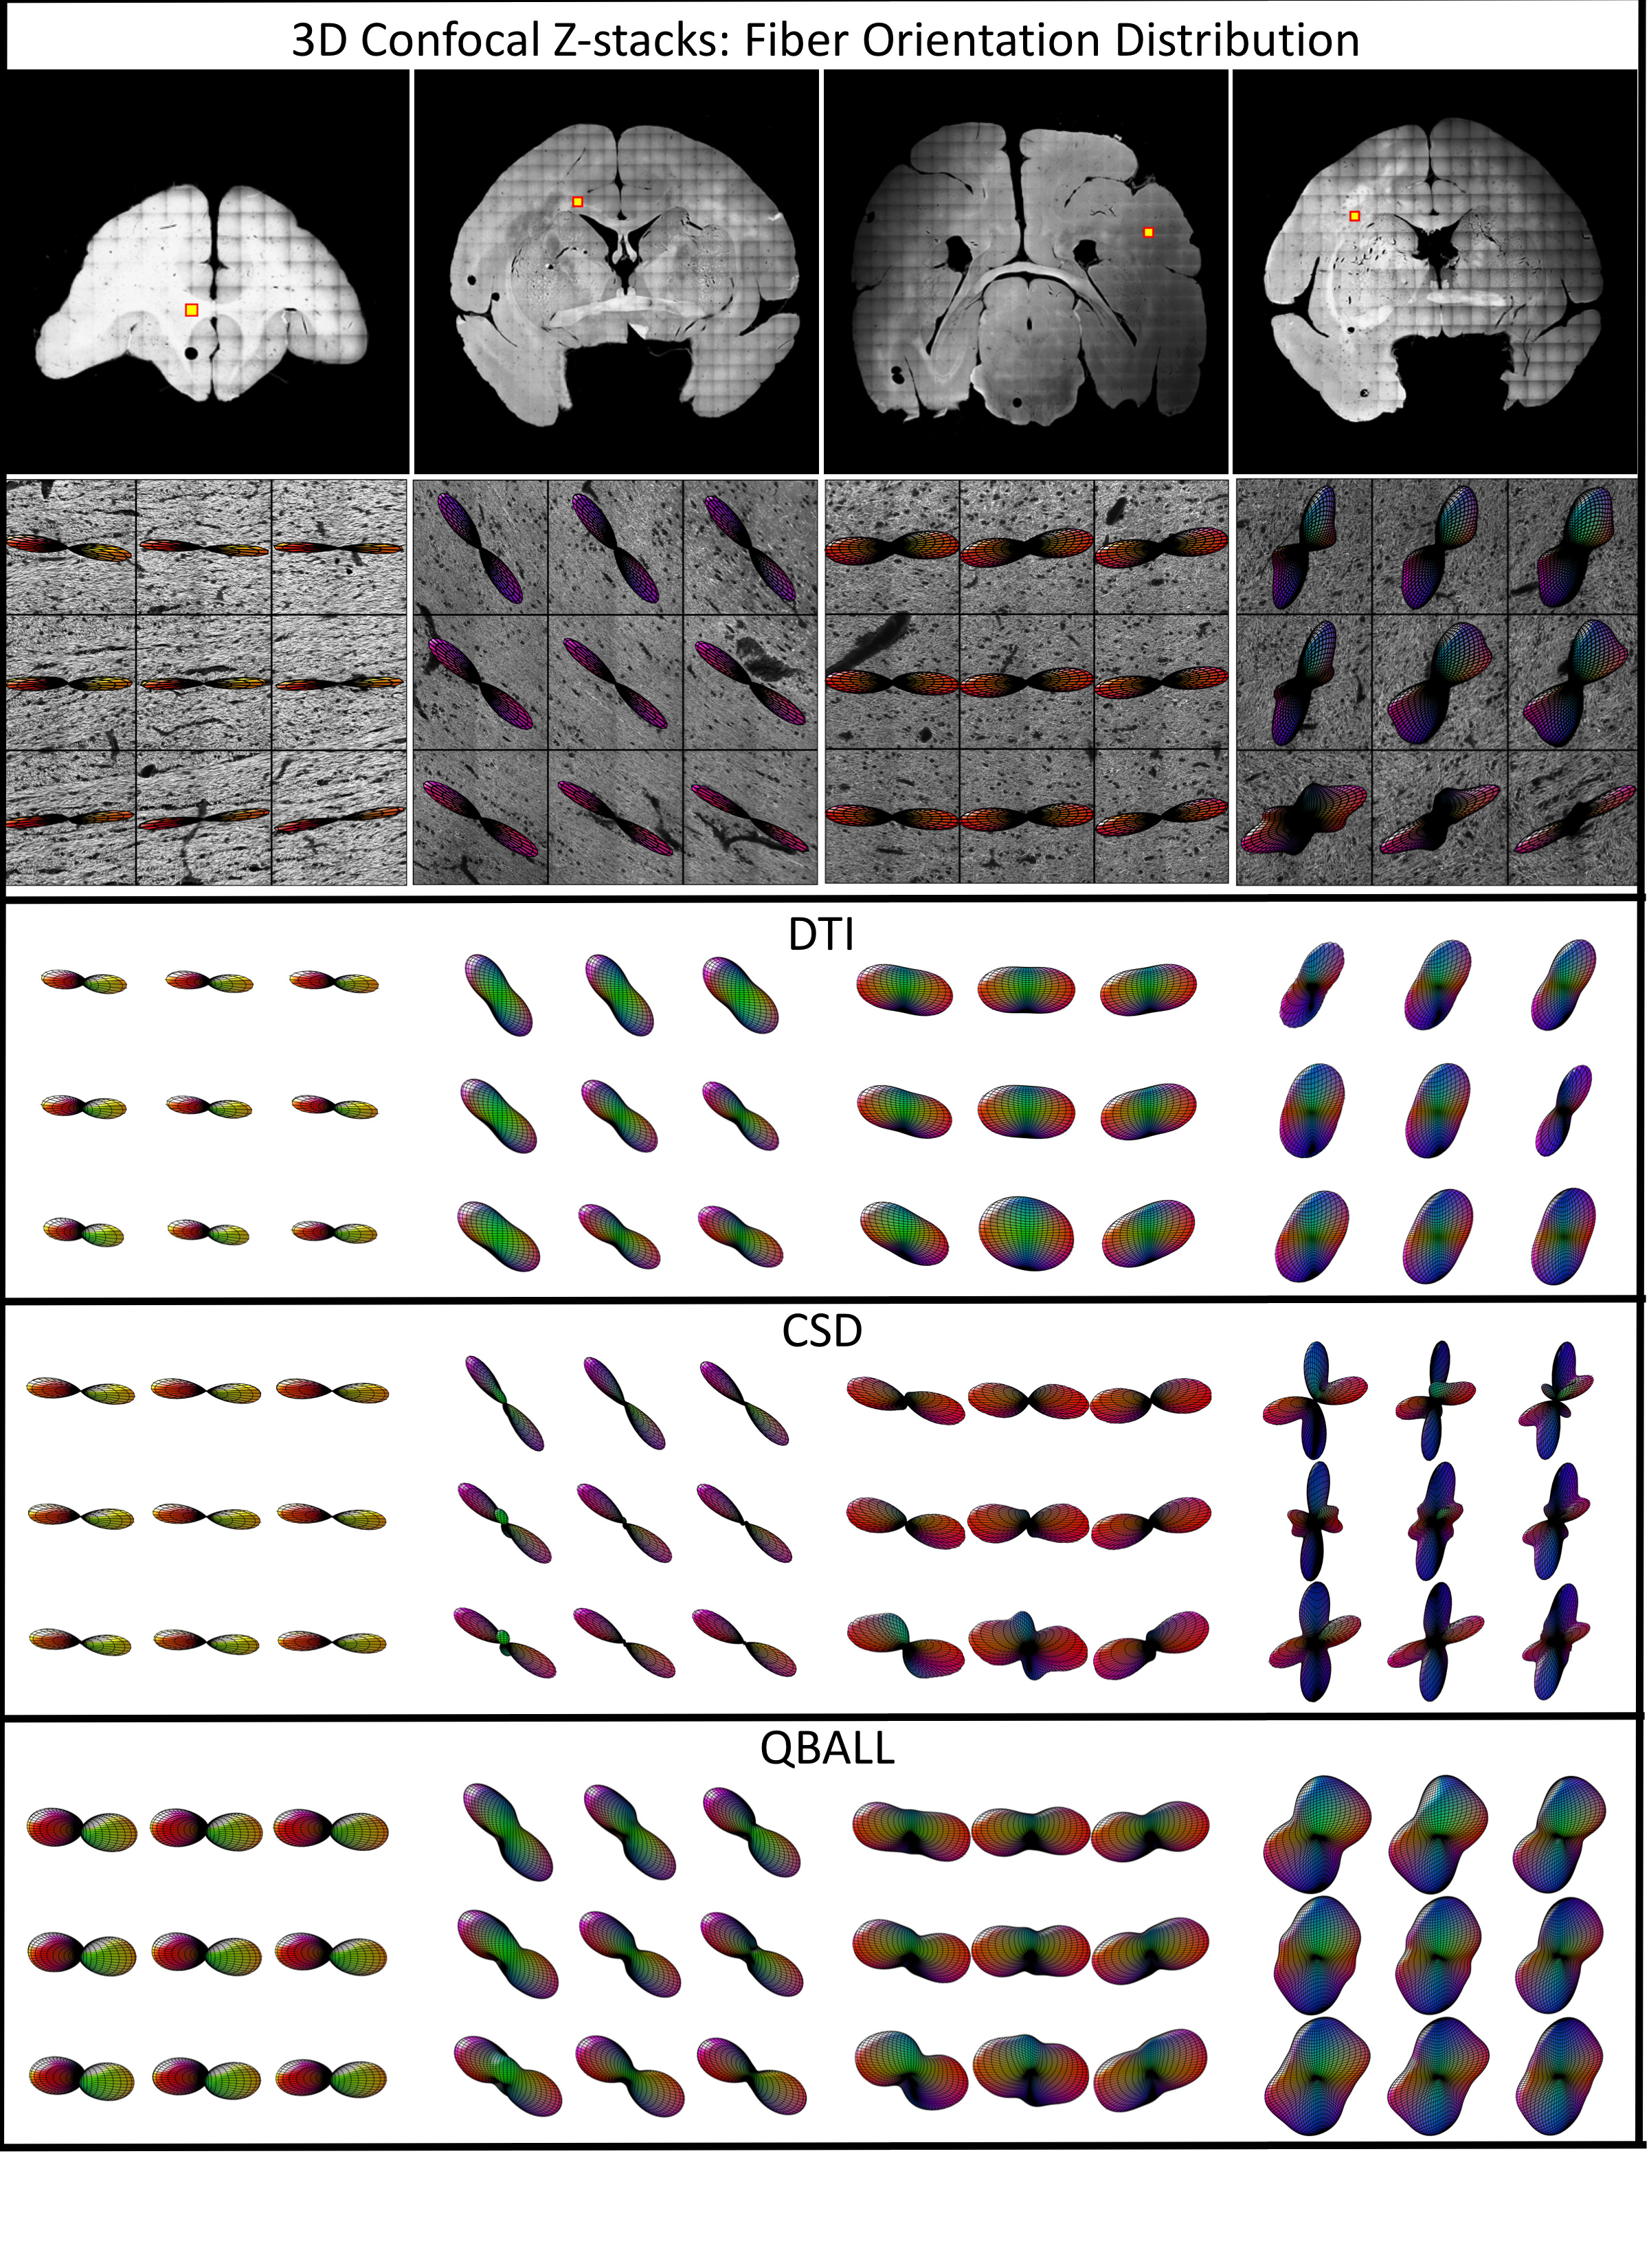
Qualitative: Figure 1 shows the histological fODF in four regions of interest, along with glyphs from DTI, CSD, and QBI. The histological orientation dispersion increases from left to right (4 voxels in the right-most FOD’s actually exhibit multiple local maxima, or crossing fibers, and were not used in this study).
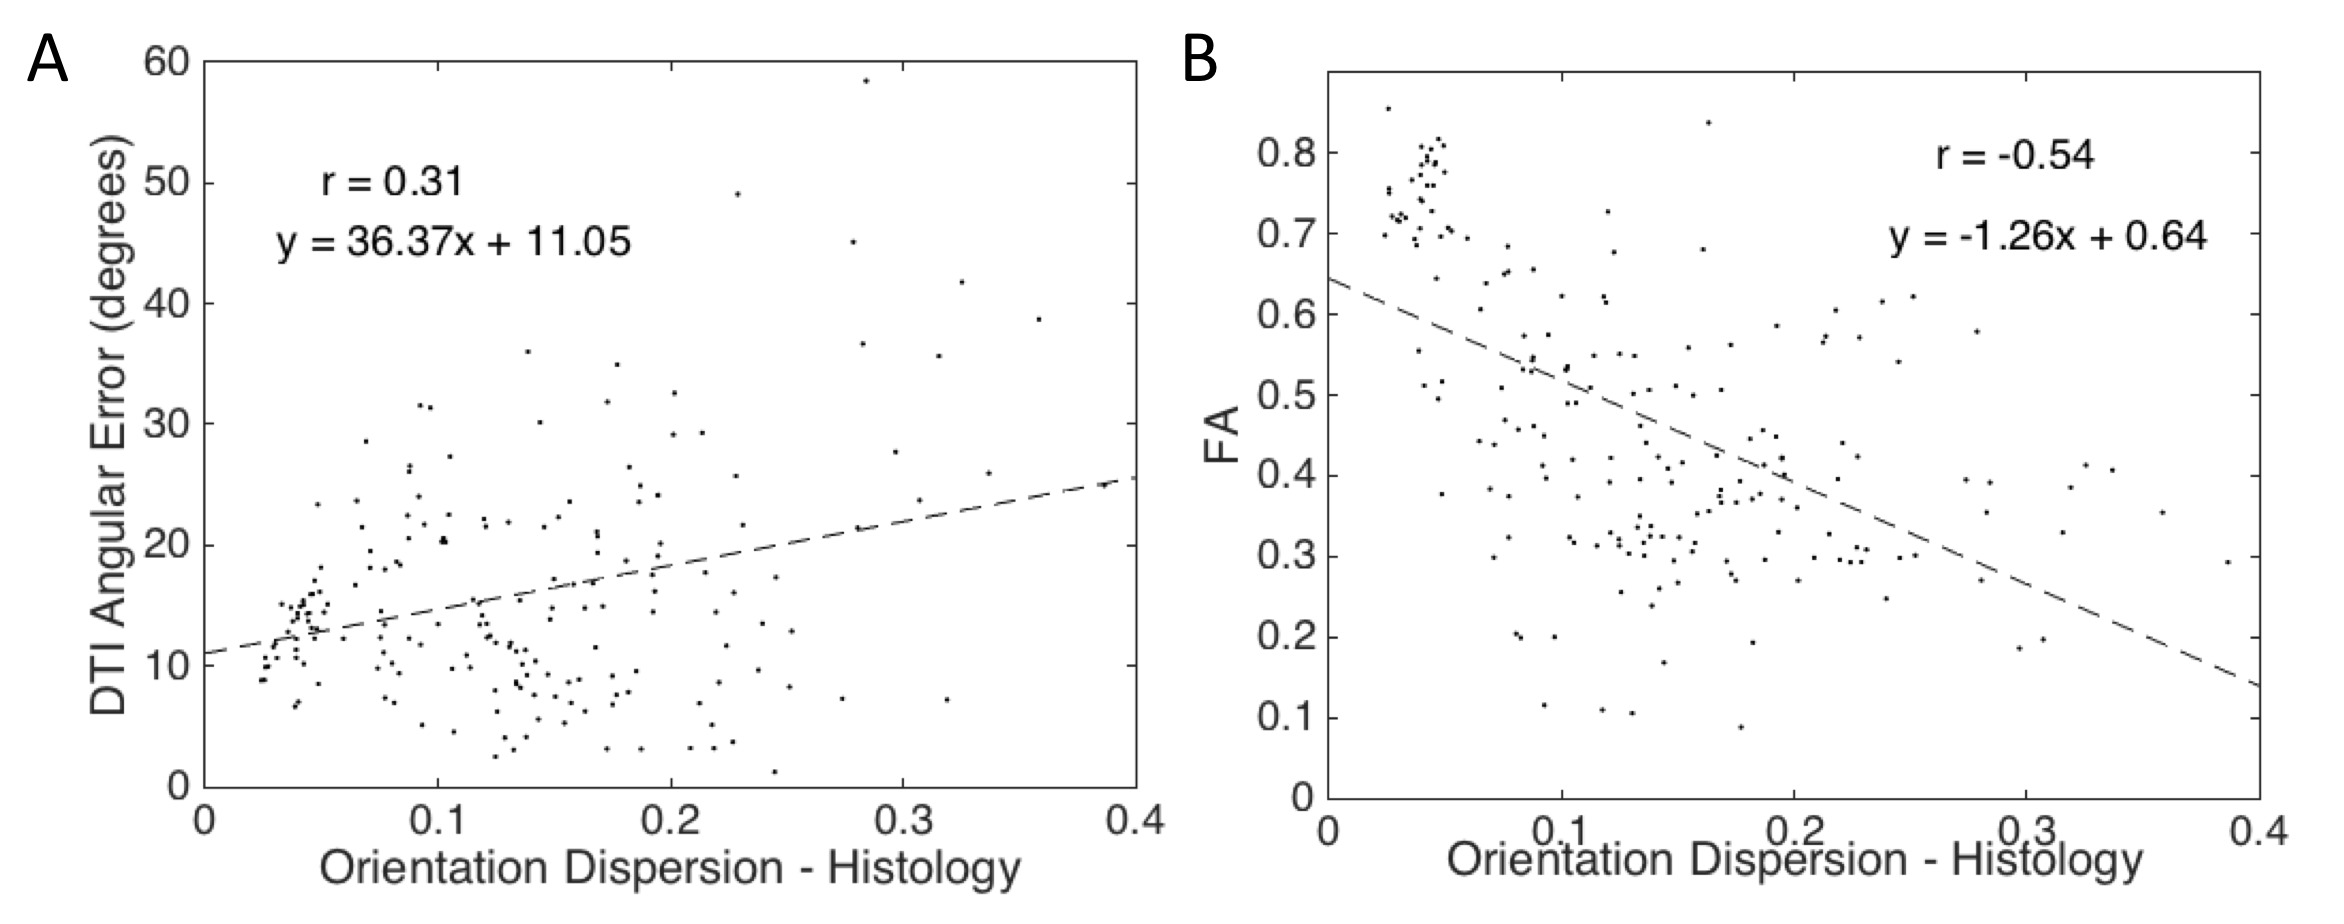
DTI: The angular error between the DTI primary eigenvector and the ground truth peak fiber orientation is plotted against histological OD (Fig 2A). As the dispersion increases, the fiber orientation estimation becomes less accurate (weak positive correlation). There is also a moderate/strong negative correlation between FA and dispersion (Fig 2B).
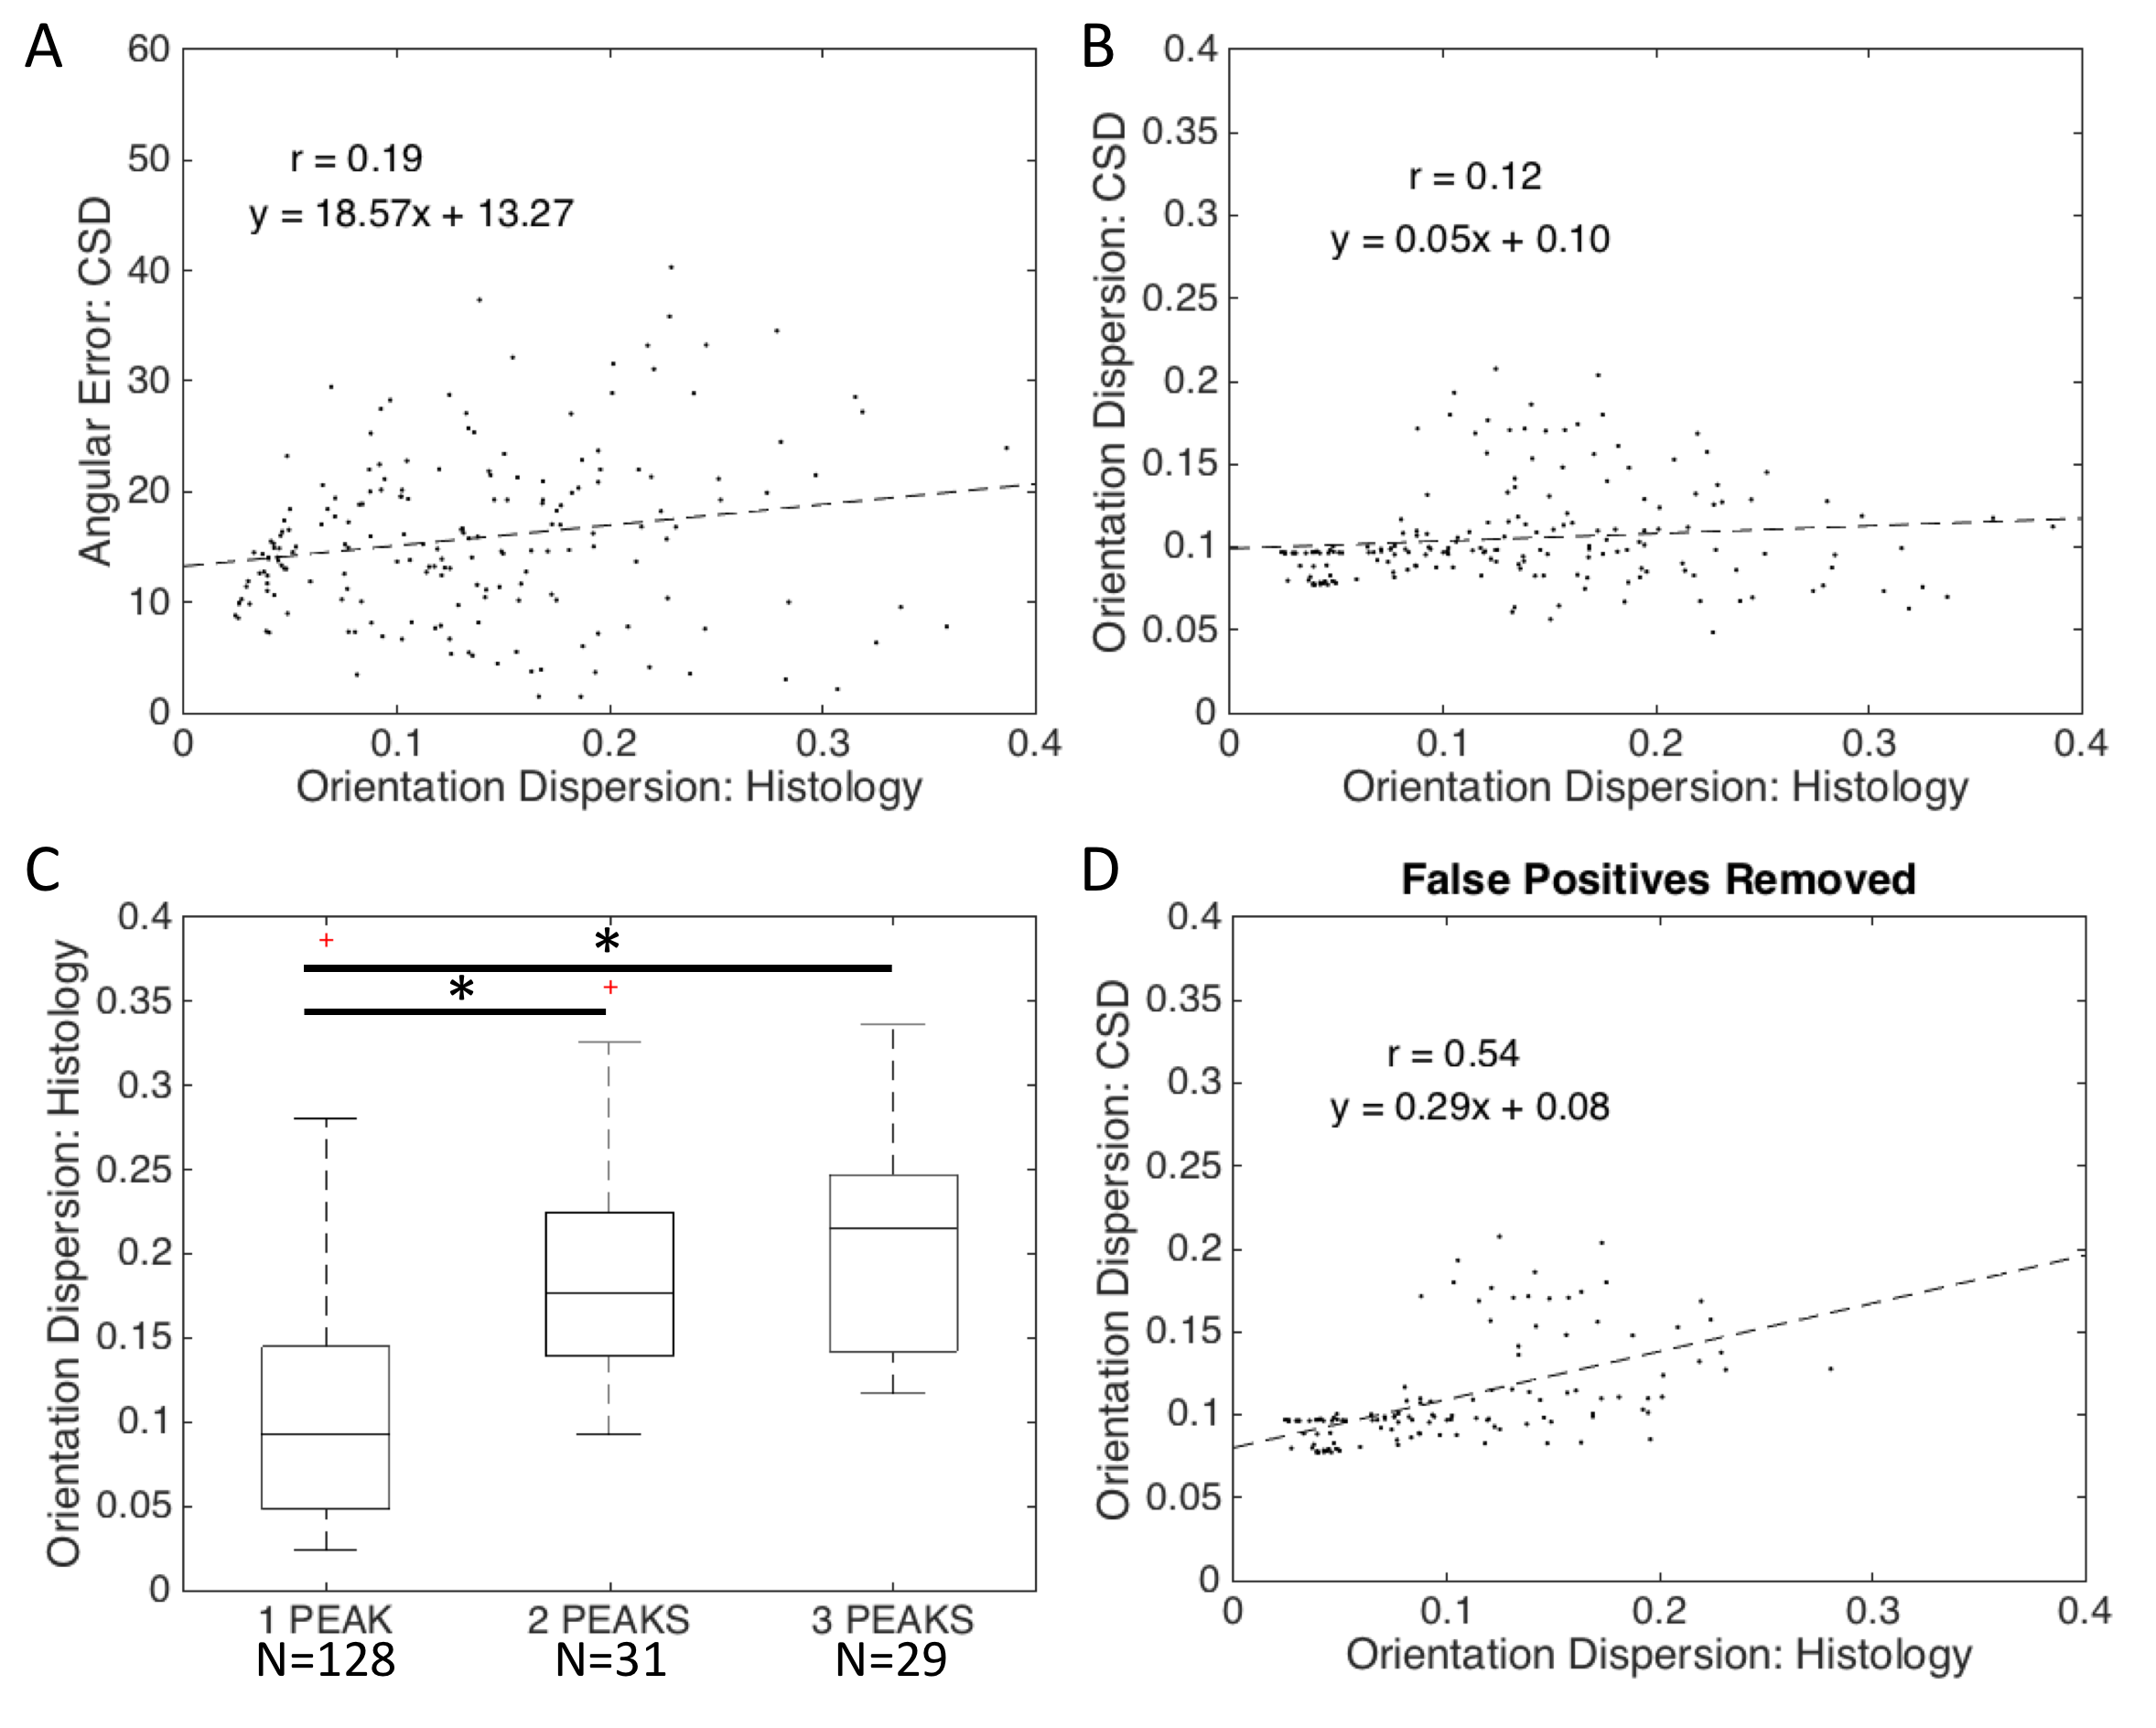
CSD: Similarly, there is a low positive correlation between the CSD angular error and histological OD (Fig 3A). The OD derived from CSD was not strongly correlated with histological OD (Fig 3B); however, we found that a high OD typically resulted in false positive peaks (Fig 3C). When false-positive voxels were removed from analysis, the CSD-derived OD was more strongly correlated with the ground truth OD (Fig 3D).
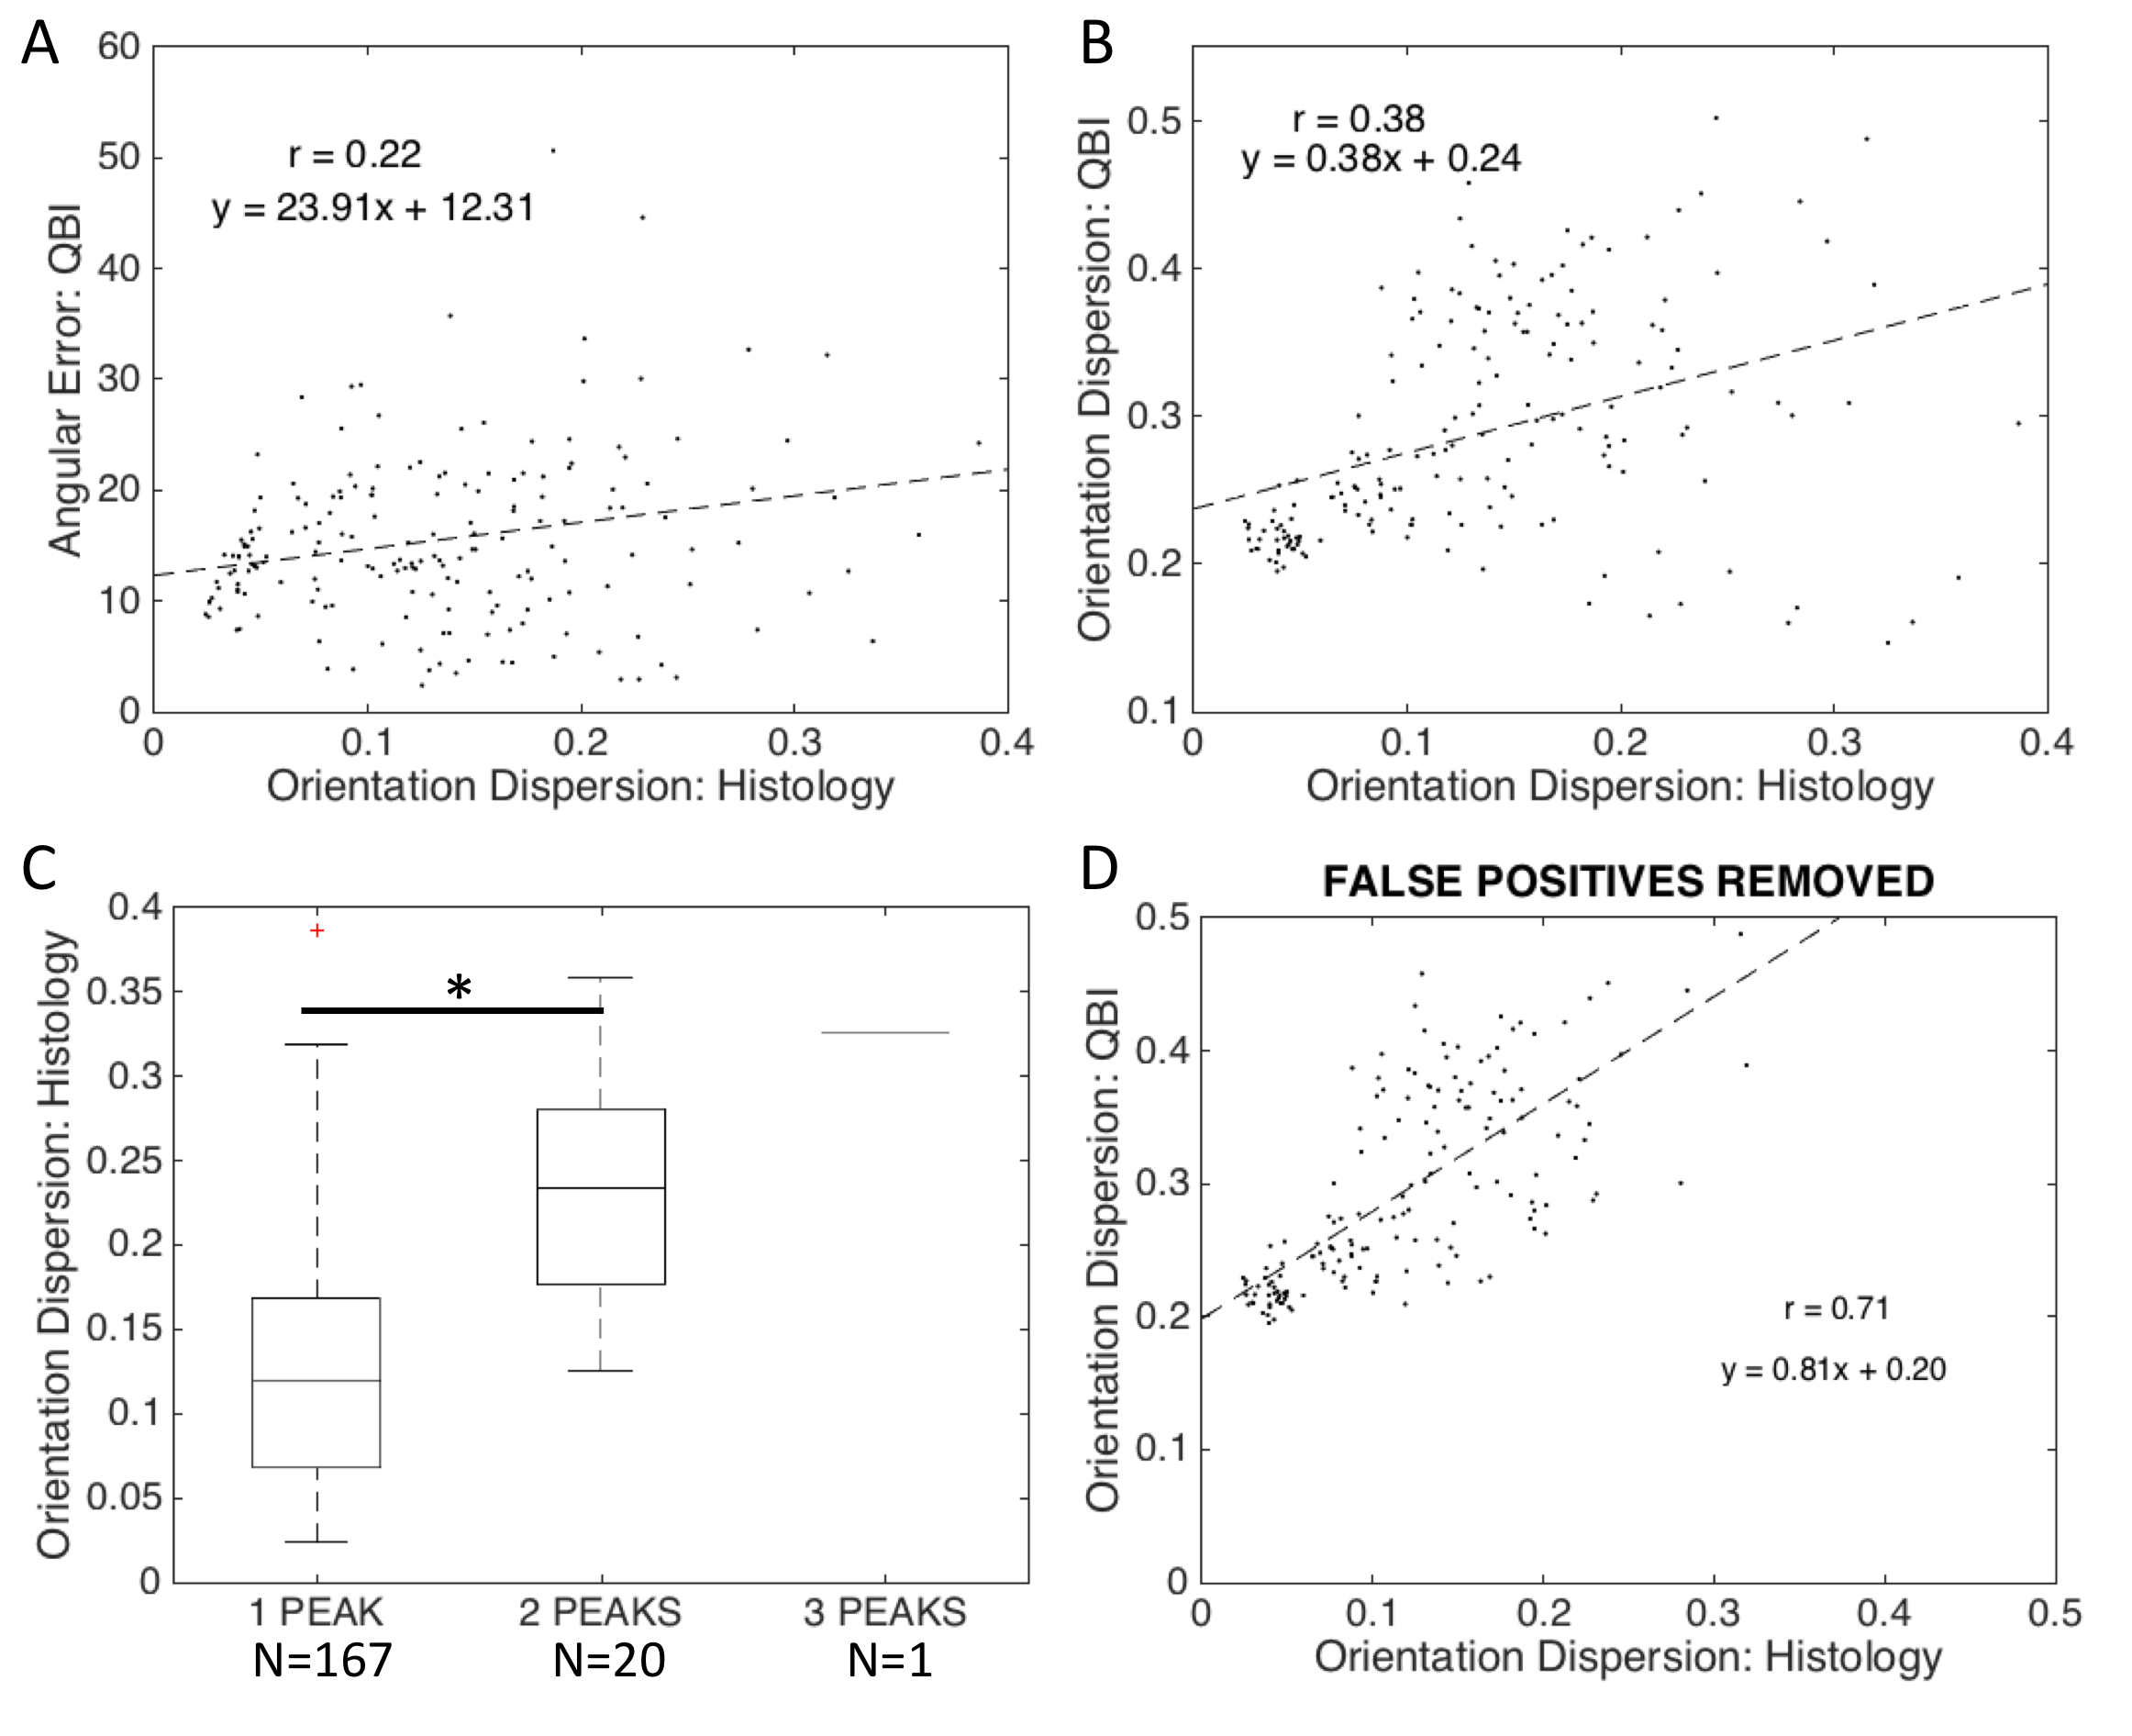
QBI: Angular error is again plotted against fiber OD (Fig 4A), where we see a weak positive correlation. The QBI OD shows stronger correlation with the histological OD than the results from CSD (Fig 4B vs Fig 3B). Again, larger dispersion often resulted in false positive peaks (Fig 4C), although at a much lower rate than with CSD (11% false positive rate vs. 32% for CSD). When voxels with false positives are removed, there is a strong correlation between QBI OD and histological OD (Fig 4D).
DISCUSSION:
We find that there is a tendency for fiber orientation estimates to be less accurate as the histological OD increases. This has implications regarding the use of discrete orientation estimates for subsequent fiber tractography, and provides confidence in the use of dispersion estimates to describe uncertainty in probabilistic tractography. We also find a low to modest correlation between histological OD and the same measures derived through QBI and CSD. However, we’ve found that a larger dispersion leads to an increased rate of false positive peaks, and subsequent underestimation of OD. With false-positive voxels removed, there is a much stronger correlation between histological and dMRI OD. Finally, we find the QBI OD is more strongly correlated with the true OD than CSD, and also leads to fewer false positive peaks in the fODF in single fiber regions. This could be due to the (relatively) “model-free” approach of QBI, compared to the use of a single response kernel for CSD.CONCLUSION:
We present a histological validation of orientation dispersion estimates from QBI and CSD. Future work will aim to investigate measures of dispersion derived from similar HARDI techniques and additional microstructural models (i.e., NODDI) [7]. In addition, crossing fiber voxels should be included in order to validate angular accuracy, correct identification of peaks, and additional tract-specific measures derived from the fODF.Acknowledgements
This work was supported by the National Institute of Neurological Disorders and Stroke of the National Institutes of Health under award number 2RO1NS058639-05/08 and National Institutes of Health grant 1S10 RR 17789.References
1. Riffert TW, Schreiber J, Anwander A, Knosche TR. Beyond fractional anisotropy: extraction of bundle-specific structural metrics from crossing fiber models. NeuroImage. 2014;100:176-91. doi: 10.1016/j.neuroimage.2014.06.015. PubMed PMID: 24936681. 2. Raffelt D, Tournier JD, Rose S, Ridgway GR, Henderson R, Crozier S, et al. Apparent Fibre Density: a novel measure for the analysis of diffusion-weighted magnetic resonance images. NeuroImage. 2012;59(4):3976-94. doi: 10.1016/j.neuroimage.2011.10.045. PubMed PMID: 22036682. 3. Dell'Acqua F, Simmons A, Williams SC, Catani M. Can spherical deconvolution provide more information than fiber orientations? Hindrance modulated orientational anisotropy, a true-tract specific index to characterize white matter diffusion. Human brain mapping. 2013;34(10):2464-83. doi: 10.1002/hbm.22080. PubMed PMID: 22488973. 4. Tournier JD, Calamante F, Connelly A. Robust determination of the fibre orientation distribution in diffusion MRI: non-negativity constrained super-resolved spherical deconvolution. NeuroImage. 2007;35(4):1459-72. doi: 10.1016/j.neuroimage.2007.02.016. PubMed PMID: 17379540. 5. Tuch DS. Q-ball imaging. Magnetic resonance in medicine : official journal of the Society of Magnetic Resonance in Medicine / Society of Magnetic Resonance in Medicine. 2004;52(6):1358-72. Epub 2004/11/25. doi: 10.1002/mrm.20279. PubMed PMID: 15562495. 6. Schilling K, Janve V, Gao Y, Stepniewska I, Landman BA, Anderson AW. Comparison of 3D orientation distribution functions measured with confocal microscopy and diffusion MRI. NeuroImage. 2016;129:185-97. doi: 10.1016/j.neuroimage.2016.01.022. PubMed PMID: 26804781; PubMed Central PMCID: PMCPMC4803575. 7. Zhang H, Schneider T, Wheeler-Kingshott CA, Alexander DC. NODDI: practical in vivo neurite orientation dispersion and density imaging of the human brain. NeuroImage. 2012;61(4):1000-16. Epub 2012/04/10. doi: 10.1016/j.neuroimage.2012.03.072. PubMed PMID: 22484410.Figures