0604
MRI vs. X-ray scattering: comparative study of myelin distribution, fiber direction and white matter tracts in mouse brain1Institute for Biomedical Engineering, ETH Zurich, Zurich, Switzerland, 2Neural Control of Movement Lab, ETH Zurich, Zurich, Switzerland, 3Paul Scherrer Institute, Switzerland
Synopsis
MRI is the method of choice for brain imaging. However, it uses indirect structural information to infer densities of molecules such as myelin, and water diffusion direction as a proxy for fiber direction. Small-angle X-ray scattering tensor tomography (SAXSTT) provides an alternative approach to assess myelin distribution and fiber direction using directly structural information related to the molecular structure of myelin sheath. We applied SAXSTT to mouse brain to validate and compare different MRI methods (MT, DWI). We found a high degree of similarity with MT macromolecule distribution, and also DWI-derived white matter tracts, but with significant region-specific differences.
Purpose
MRI is considered the method of choice for tomographic brain imaging. However, methods used to identify important components such as myelin, eg. magnetization transfer (MT), are myelin-sensitive rather than myelin-specific, whereas diffusion weighted imaging (DWI) probes water diffusion to infer fiber direction. The recently developed small-angle X-ray scattering tensor tomography (SAXSTT)1,2 has changed the concept of X-ray tomography by reconstructing not only scalar values but also tissue anisotropy in every voxel1-3. In the brain, SAXSTT can selectively probe the structure of the myelin sheath, due to its 17.5nm periodicity4. In this study, we applied SAXSTT to mouse brain in order to i) validate MRI readouts concerning their sensitivity to myelin, ii) compare DWI-derived and SAXSTT-derived axonal direction measures.Methods
The brain of a healthy, 5-month-old C57BL/6 mouse was studied.
First, the brain was scanned in vivo using DWI5 (isotropic voxel size: 150μm, 96 diffusion directions, b-values: 1000, 2000s/mm²). After being formalin-fixed, it was DWI-scanned ex vivo (isotropic voxel size: 75μm, 96 diffusion directions, b-values: 2000, 4000s/mm²). Fiber directions were derived from in vivo and ex vivo DWI data according to6, and white matter tracts were generated by MRtrix7 tract-tracing algorithms.
Further, MT MRI was used (isotropic voxel size: 150μm, offset: 1500Hz, B1-amplitude: 40μT). The MT ratio (MTR=(MT0–MTsat)/MT0) provided data sensitive to the macromolecule content (including myelin) in the brain. All MRI scans were performed using a cryo-coil at the 9.4T Bruker MRI scanner in the Animal Imaging Center of ETH Zurich.
SAXSTT experiments were performed in the cSAXS beamline of Paul Scherrer Institute (PSI), Switzerland, according to Liebi et al.1, (isotropic voxel size: 150μm, beam energy: 16.3KeV, 267 projections). X-ray dose of 105Gy was well below the dose deposited on brain tissue during previous experiments8. The myelin-specific signal, corresponding to a myelin sheath periodicity of 17.5nm, was identified and isolated4, allowing the quantification of the relative amount of myelin in the brain. Local fiber direction was also reconstructed according to1, and MRtrix tract-tracing algorithms were used to generate SAXSTT-derived white matter tracts.
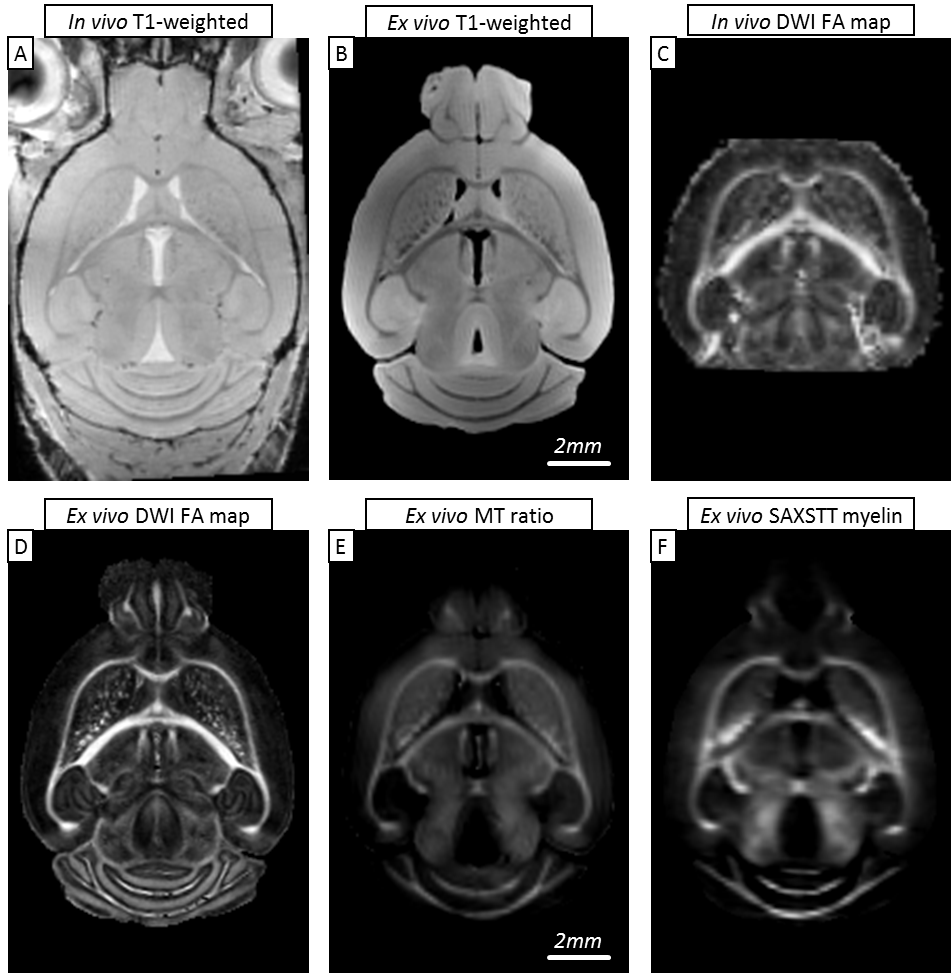
All scan results were registered to a common template. Fig. 1 shows a representative midbrain section with its anatomical features, as well as the diffusion and myelin-related signal.
Results
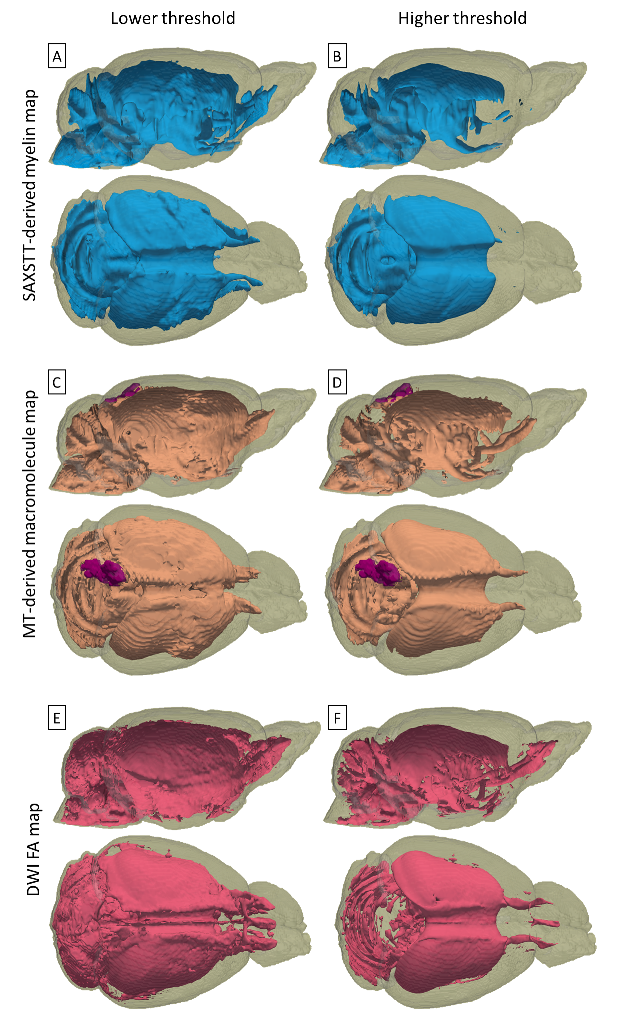
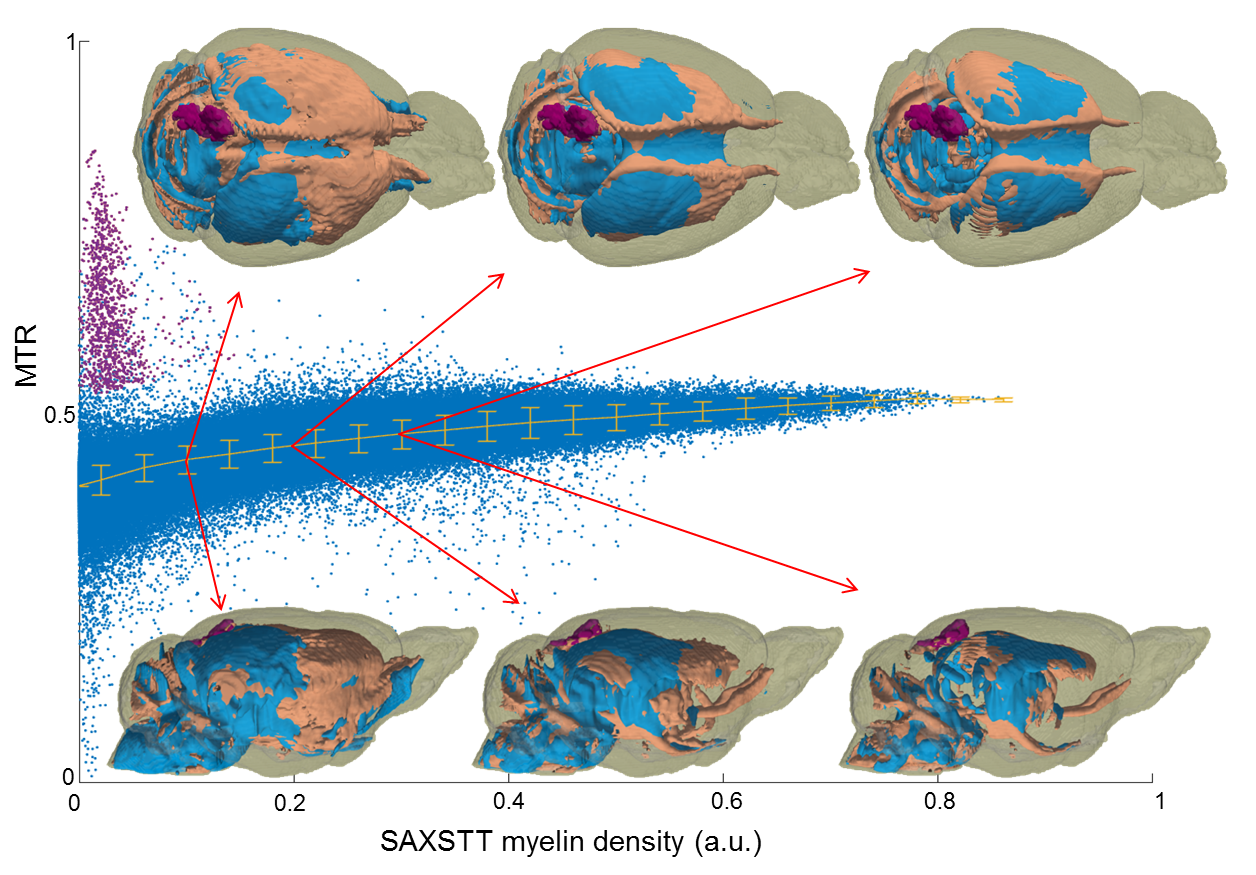
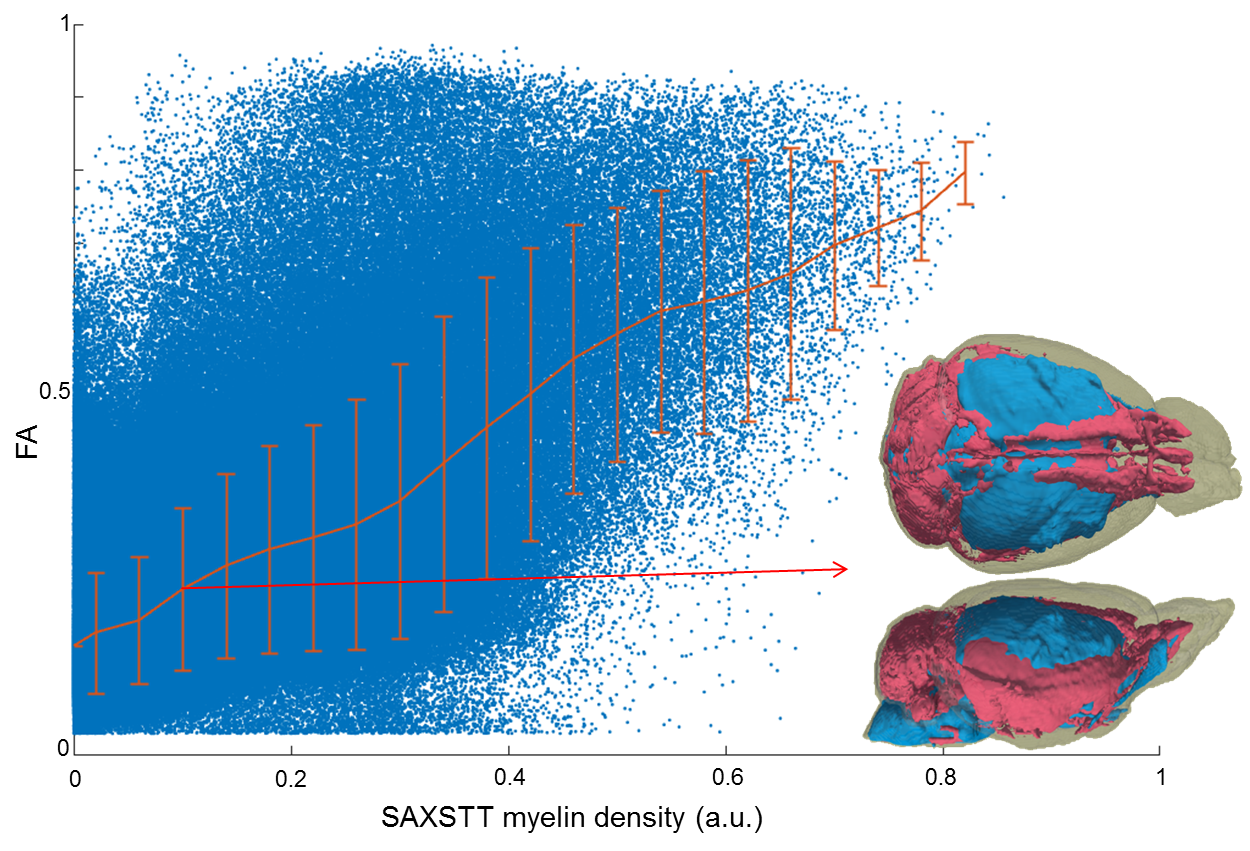
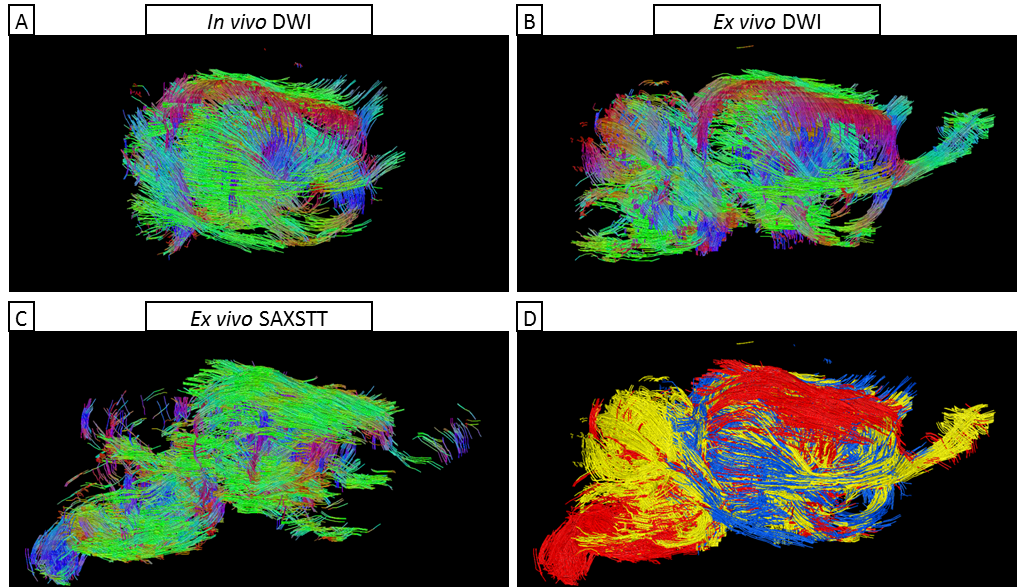
Fig. 2 shows reconstructions of myelin-related signal for SAXSTT, MTR and FA signal. Voxel-wise quantitative analysis between MTR and SAXSTT signal shows a quasi-linear correlation, though the sensitivity of the two methods varies in different brain regions, such as the frontal cortex, the lateral temporal cortex or the olfactory tracts (Fig. 3). SAXSTT values correlate poorly with DWI FA values, with correlation being higher in regions like the corpus callosum, and very poor in other regions, like the cerebellum (Fig. 4). Concerning fiber direction and tracts, preliminary comparison shows significant correlation between DWI and SAXST, although important region-specific differences have been observed, e.g. at the cingulum or the brainstem (Fig. 5).Discussion
The use of a novel method, small-angle X-ray scattering tensor tomography, has been demonstrated for assessing myelin distribution and fiber direction in the mouse brain, and has been combined and correlated with MRI modalities. Results indicate that MRI MT has high sensitivity to myelin. Since SAXSTT is myelin-specific, enabling isolation of a structural characteristic of myelin sheath (the 17.5nm periodicity), deviations from quasi-linear relationship can indicate contributions from other macromolecules, to which MT is also sensitive. Correlation between FA and SAXSTT-derived myelin levels indicates that water diffusion anisotropy depends on the degree of myelination, with high myelin levels imposing high FA values. Preliminary comparison of fiber direction and white matter tracts shows a high degree of similarity, though significant differences in some highlighted pathways are observed. This can be due to the fundamental differences in the properties measured by the two methods, with SAXSTT studying myelin sheath direction whereas DWI assesses water diffusion direction. Methods such as histology or CLARITY, can (and are planned to be) used for providing additional information on myelin distribution and fiber direction.Conclusion
SAXSTT has been used for the first time in brain tissue, in order to tomographically characterize myelin distribution and local fiber direction, providing results that display high correspondence to MRI measures, but also region-specific differences. Multiparametric MRI characterization including e.g. T1- or T2-mapping (myelin-water fraction) should enhance the specificity for myelin. Since SAXSTT is an ex vivo method that provides highly resolved 3D information based on specific structural features (periodicity of myelin sheaths), it can be employed to validate MRI readouts used in research related to brain disorders affecting neural connectivity, where myelin concentration and/or white matter tracts play an important role.Acknowledgements
The authors would like to thank David Buehlmann, Giovanna Ielacqua, Dr. Aline Seuwen from the Institute for Biomedical Engineering of ETH Zurich, Dr. Anthoni Sanchez-Ferrer from the Laboratory of Food and Soft Materials of ETH Zurich, Dr. Els Fieremans and Dr. Dmitry Novikov from the Langone Medical Center of New York University, New York, and Dr. Ana Diaz, Dr. Andreas Menzel from the cSAXS beamline of Paul Scherrer Institute, Switzerland for discussions.References
1. Liebi, M., et al., Nanostructure surveys of macroscopic specimens by small-angle scattering tensor tomography. Nature, 2015. 527(7578): p. 349-352.
2. Schaff, F., et al., Six-dimensional real and reciprocal space small-angle X-ray scattering tomography. Nature, 2015. 527(7578): p. 353-356.
3. Fratzl, P., Imaging techniques: Extra dimension for bone analysis. Nature, 2015. 527(7578): p. 308-309.
4. Jensen, T.H., et al., Molecular X-ray computed tomography of myelin in a rat brain. NeuroImage, 2011. 57(1): p. 124-129.
5. Zerbi, V., et al., Gray and white matter degeneration revealed by diffusion in an Alzheimer mouse model. Neurobiol Aging, 2013. 34(5): p. 1440-50.
6. Mori, S., Chapter 5 - Mathematics of Diffusion Tensor Imaging, in Introduction to Diffusion Tensor Imaging (Second Edition), J.D. Tournier, Editor. 2014, Academic Press: San Diego. p. 33-37.
7. http://www.mrtrix.org/.
8. Jensen, T.H., et al., Brain tumor imaging using small-angle X-ray scattering tomography. Physics in Medicine and Biology, 2011. 56(6): p. 1717-1726.
Figures