0603
Normalization of inter-site Structural Connectivity Data for Regression analysis1Department of Radiology, Perelman School of Medicine, University of Pennsylvania, Philadelphia, PA, United States, 2Department of Biostatistics and Epidemiology, Perelman School of Medicine, University of Pennsylvania, 3Department of Psychiatry, Perelman School of Medicine, University of Pennsylvania, 4Center for Autism Research, Children’s Hospital of Philadelphia
Synopsis
Diffusion tensor imaging (DTI) and tractography have revealed many critical insights about how the human brain is organized as a large-scale complex network. As multisite imaging studies are becoming increasingly popular within the neuroimaging field, it is imperative to develop methods that can correct for inter-site differences, facilitating the combination of data from multiple sites. In this study, we present a normalization scheme that will correct for site-specific differences in diffusion-based structural connectivity data, and demonstrate its efficacy through multivariate regression experiments using the normalized structural connectivity features to predict subject’s age.
Purpose
Diffusion imaging provides insights into the brain network architecture that can be studied developmentally. Multisite diffusion imaging data are increasingly becoming available, which facilitates development of methodologies to harness big data to significantly increase sample size and statistical power. This also enables life-span studies that span high age ranges from infancy to elder age. However, pooling data acquired from different imaging sites is challenging due to the variation in acquisition parameters. Normalization schemes for the data that facilitate a combination are essential. In this work, we propose a normalization scheme to correct for inter-site differences while preserving biologically relevant variation in the data, and demonstrate its efficacy on a regression application for predicting subject’s age.
Methods
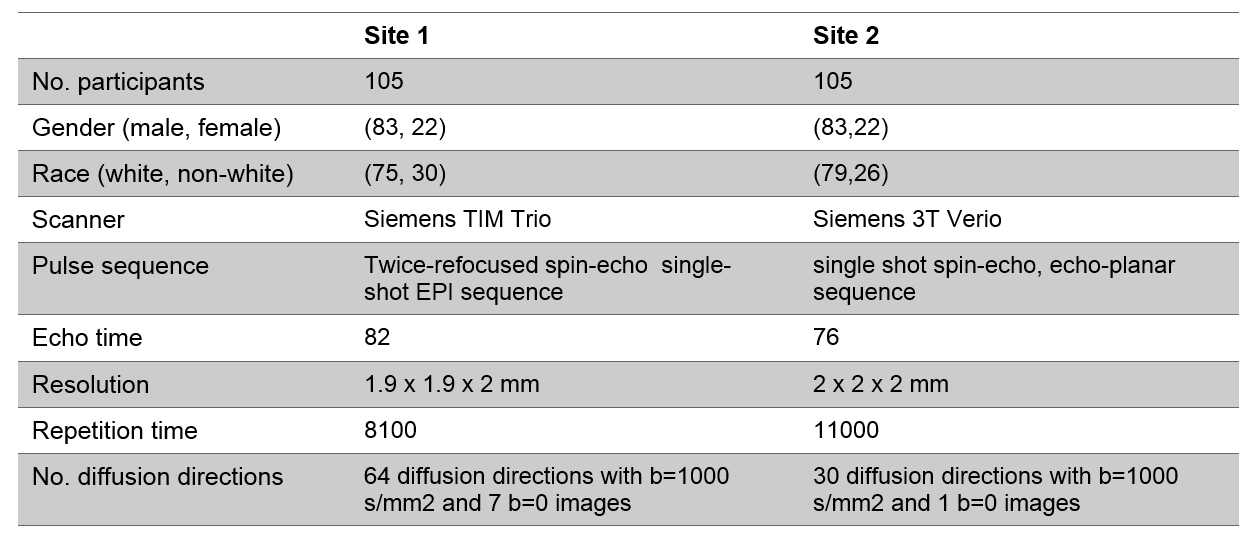
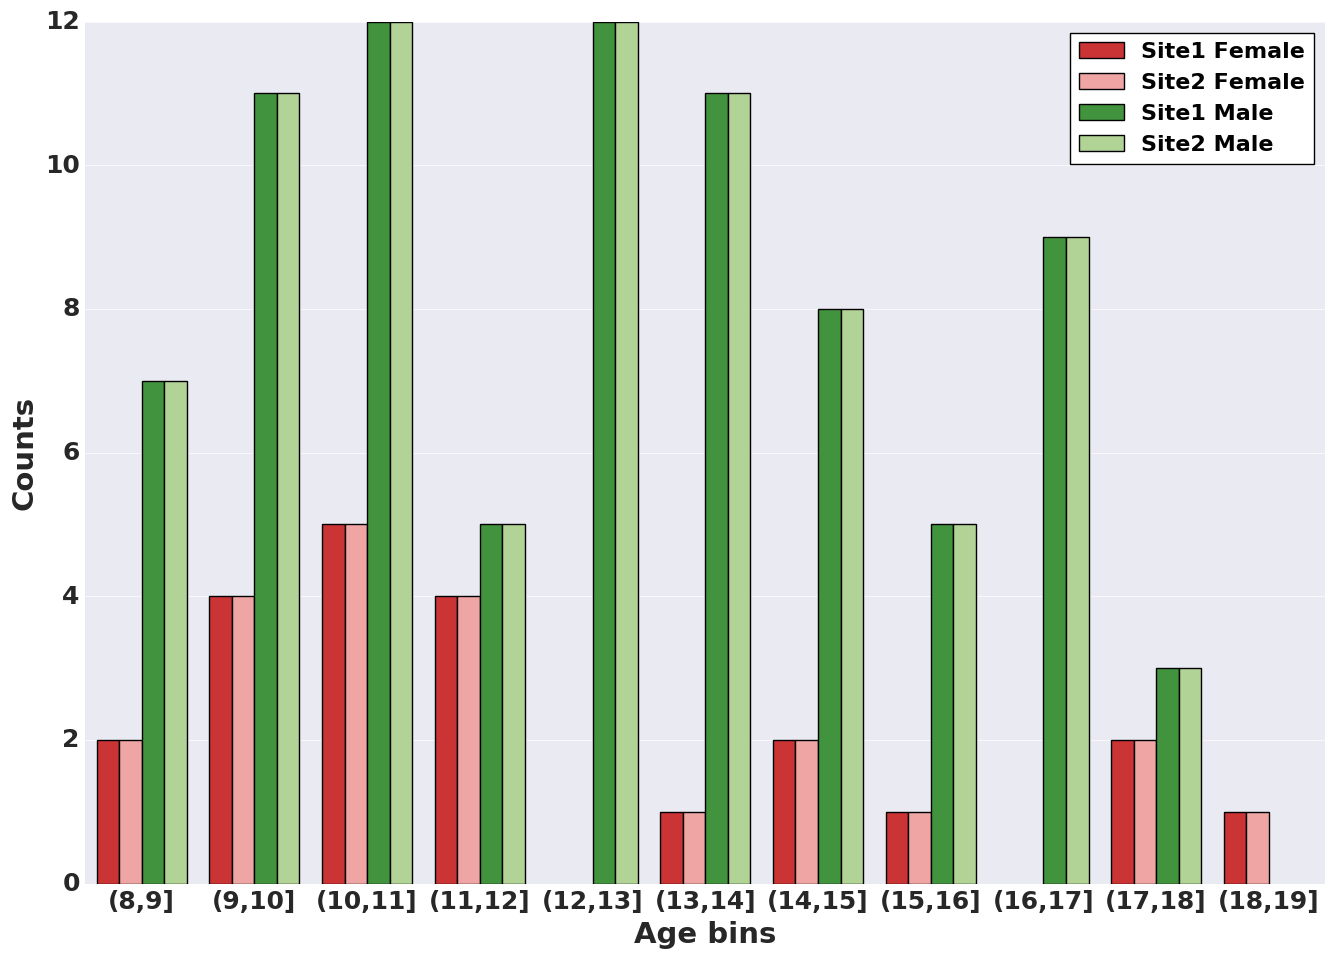
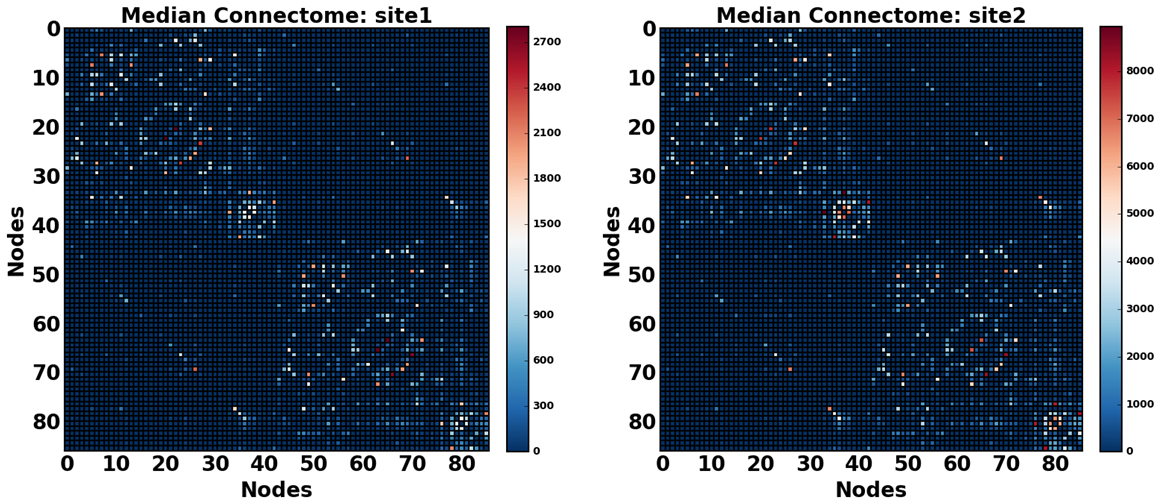
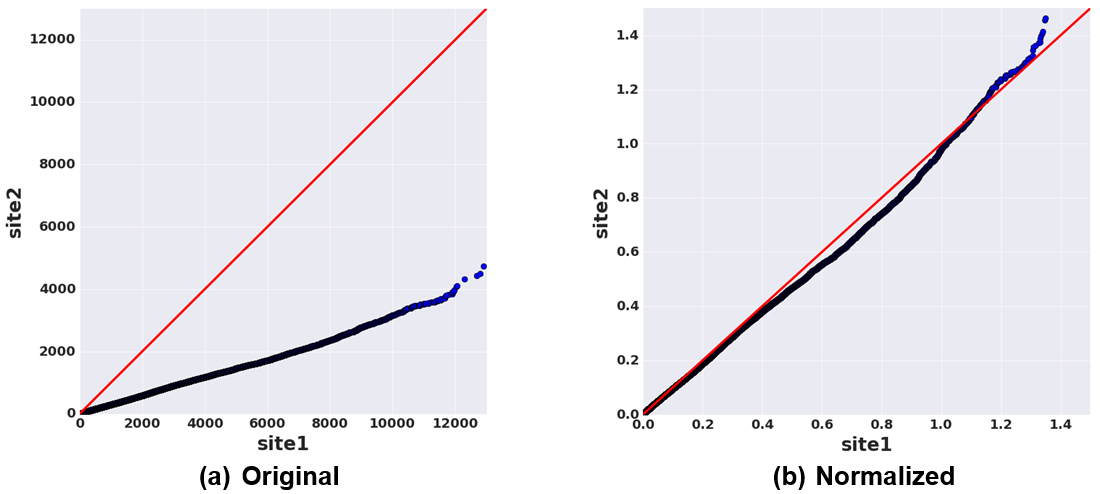
In this study, we used DTI data from 210 healthy subjects acquired at two different sites [1, 2] (105 from each), matched across age, gender, and ethnicity (see Figure 1 and 2). We constructed structural brain networks of subjects, including 86 anatomical regions of Desikan atlas [3] as network nodes, and the number of streamlines (computed using probabilistic tractography [4]) as the edge weights. We defined a normalization procedure to correct for site-differences in edge weights while preserving biological variation in the data. First, we constructed a “median connectome” by computing the median values over each edge values (Figure 3), and identify the maximum value from this matrix. We then applied a global scaling by dividing all the connectivity values by the maximum median-value from the median connectome. To evaluate the impact of our normalization procedure, we studied the relationship between the distribution of the edge weights between the two sites by creating two quantile-quantile plots (QQ-plot), before and after normalization (Figure 4). In each QQ-plot, all the quantiles of the edge weights from one site is plotted against the quantiles of the edge weights from the other site.
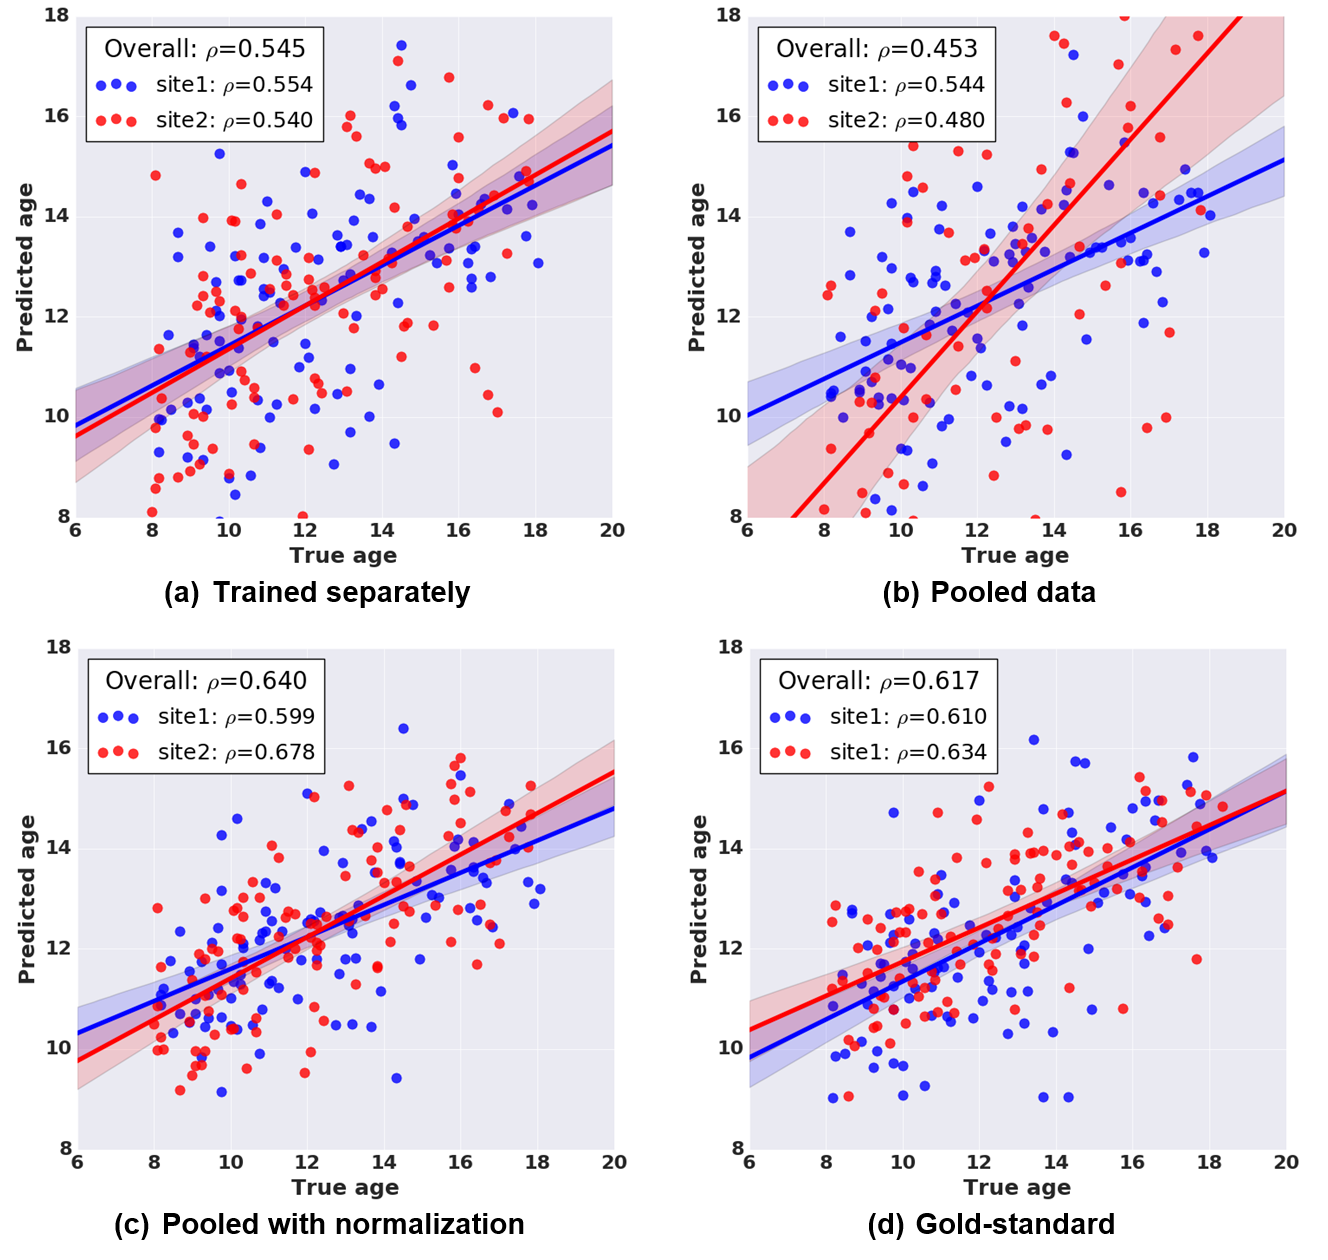
In order to demonstrate how pooling data from multiple sites without correcting for site-differences may confound statistical analysis, we performed the following analysis. We predicted ages of subjects using edge weights as features and using a multivariate ridge regression model in a 5-fold cross-validation (CV) scheme. This was repeated for (1) each site separately, (2) combined dataset without normalization, and (3) combined dataset with normalization. In order to have a reference point for comparison, we additionally created a “gold-standard” dataset where inter-site effect is known to be absent. Specifically, we increased the sample size of one of the sites to match the size of the combined sample (210) by adding 105 additional age and gender-matched subjects, and repeated the age prediction using this larger sample from single site. To obtain robust estimates of the prediction performance, for all experiments, we repeated the CV procedure over 50 randomizations. Finally, model performance is evaluated using Pearson’s correlation coefficient ($$$\rho$$$) between the true age and the average predicted age over 50 randomizations.
Results
As illustrated in the QQ-plots in Figure 4, there was a significant difference in edge weights of two sites before the normalization procedure. After applying the proposed normalization procedure, the edge weights showed a reasonably matched distribution between the two sites. Figure 5 summarizes the age prediction results from the four different data setups (independent sites, combined data without normalization, combined data with normalization, and the gold-standard). When using sites individually, age prediction accuracy was $$$\rho=0.554$$$ and $$$\rho=0.54$$$ for site 1 and 2, respectively. As seen in the figure, naively pooling data from different sites turns out to deteriorate the prediction accuracies ($$$\rho=0.544$$$ for site 1, $$$\rho=0.48$$$ for site 2) due to significant differences between sites. The prediction using the combined dataset after normalization performed ($$$\rho=0.599$$$ for site 1, $$$\rho=0.678$$$ for site 2) as good as the gold standard (overall correlation of $$$\rho=0.617$$$).Conclusion
The major objective of this study was to assess the plausibility of combining diffusion-based structural connectivity dataset across multiple imaging sites, with an aim of increasing sample size and statistical power. Experimental results on age, gender, and ethnicity matched datasets revealed a significant difference in terms of edge weight distributions of two sites as illustrated by QQ-plots. However, this difference was mostly corrected once the proposed normalization procedure was applied. We also demonstrated that combining the two datasets after applying the proposed normalization procedure increased the age prediction accuracy to a level that is achieved by a gold-standard dataset, where all the scans are obtained from a single site. This illustrates a means of combining multi-site data for subsequent regression analysis. Future work includes validation with additional datasets.Acknowledgements
This research was supported by the National Institutes of Health (NIH) grant R01-MH092862 (PI: Ragini Verma).References
[1] Ghanbari, Y., Smith, A.R., Schultz, R.T., Verma, R. (2014) Identifying group discriminative and age regressive sub-networks from DTI-based connectivity via a unified framework of non-negative matrix factorization and graph embedding. Medical Image Analysis 18(8), 1337 – 1348.
[2] Satterthwaite, T.D., Elliott, M.A., Ruparel, K., Loughead, J., et al. (2014) Neuroimaging of the Philadelphia neurodevelopmental cohort. NeuroImage 86, 544 – 553.
[3] Desikan, R.S., Sgonne, F., Fischl, B., Quinn, B.T., et al. (2006) An automated labeling system for subdividing the human cerebral cortex on MRI scans into gyral based regions of interest. NeuroImage 31(3), 968 – 980.
[4] Behrens, T., Woolrich, M., Jenkinson, M., Johansen-Berg, H., et al. (2003) Characterization and propagation of uncertainty in diffusion-weighted MR imaging. Magnetic Resonance in Medicine 50(5), 1077–1088.
Figures