0602
Variability and Reproducibility of Multicenter Human Diffusion Measurements with Track-density Imaging Analysis1Center for Brain Imaging Science and Technology, Department of Biomedical Engineering, Zhejiang University, Hangzhou, People's Republic of China, 2Department of Radiology, Xuanwu Hospital, Capital Medical University, Beijing, People's Republic of China, 3MR Collaboration NE Asia, Siemens Healthcare, Shanghai, People's Republic of China
Synopsis
In a multicenter imaging study, it is vital to properly evaluate the variability of image quality among scanners. For diffusion imaging, estimations based on ADC and FA measurements with tensor models have previously been studied. However, such evaluation is not sufficient for studies with more diffusion directions like HARDI or DSI. This study uses track-density imaging to estimate the variability and reproducibility of multi-shell diffusion images from multicenter data acquired in the same subjects.
Purpose
A multicenter project usually requires cooperation from several MR facilities. Therefore, reliability and reproducibility of image quality among different MRI systems should be counted as a precondition. For diffusion imaging, the inter-center variability of ADC and FA acquired from various systems has been reported.1-3 Recently, multi-shell acquisition schemes are often required by advanced diffusion models beyond the conventional 2nd-order tensor model. In this context, track-density imaging (TDI) is a potential method to quantitatively investigate the global tractography results 4 and hence to evaluate the quality of reconstruction from multi-shell diffusion data. In this work, in order to observe the variability and reproducibility of diffusion measurement among seven different MR facilities, we utilized TDI to analyze the images acquired with the same protocol in the same three human subjects, with the same type of scanner and RF coil.Methods
Data acquisitions were performed on 3T MAGNETOM Prisma scanners using a 64-channel head coil (Siemens Healthcare, Erlangen, Germany), from seven centers noted as A to G. The same protocol and the same three healthy volunteers (one male and two females, 23, 26 and 23 years old, noted as I, II, and III) were scanned in all centers. In addition, the acquisition in these volunteers was repeated on the same scanner in center G one week later (noted as scan G-1 and G-2 separately).
For each subject, images were acquired aligned with the AC-PC line from a sagittal image to minimize the registration error. Anatomical images were acquired using 3D MP2RAGE (TR/TE=5s/2.9ms, TI=700,2500ms, FOV=256x256x211mm3, voxel size=1x1x1.2mm3, bandwidth=240Hz/Px, iPAT factor=3, TA=8mins), while the denoised uniform images were obtained by combining two readouts.5-7 Diffusion images were obtained using a simultaneous-multi-slice (SMS) diffusion EPI prototype sequence 8 (TR/TE=5.4s/71ms, FOV=220x220mm2, slice number=93, voxel size=1.5x1.5x1.5mm3, bandwidth=1712Hz/Px, partial Fourier=6/8, iPAT factor=2, SMS factor=3, TA=19mins). The diffusion scheme, containing 90 vectors equally spaced on three shells (b-value=1000, 2000, 3000s/mm2), was generated from a multiple q-shell sampling tool.9 Six non-diffusion images were equally separated in the scheme. Images with two opposite phase encoding directions (AP and PA) were acquired.
Pre-processing such as field map estimation, distortion correction, and coregistration was implemented in FSL (FMRIB software library, University of Oxford, UK). Eight diffusion datasets of each subject were coregistered to the G-1 scan. MRtrix software package (Brain Research Institute, Melbourne, Australia) was subsequently used for post-processing. Masks were obtained using tissue type (WM/GM/CSF) segmentation from the coregistered G-1 anatomical images.10 Then the multi-tissue constrained spherical deconvolution was used to estimate a multi-tissue orientation distribution function (ODF) from the diffusion datasets.11 Anatomically-constrained tractography12 was later calculated for 1 million tracks at a step size of 0.15mm, with a length limitation from 3 to 150mm, and a cutoff ODF amplitude of 0.06. Eventually, TDI images were reconstructed at a resolution of 0.75x0.75x0.75mm3.
The coefficients of variations (CV) for intra-center (G-1 and G-2) and inter-center (A to G-1) were calculated using $$$CV=\sigma(TDI_{n})/\overline{TDI_{n}}$$$, where $$$\sigma$$$ denotes the standard deviation and $$$n$$$ denotes the scans. Then two representative regions were selected and their mean track density with standard errors were compared.
Results & Discussion
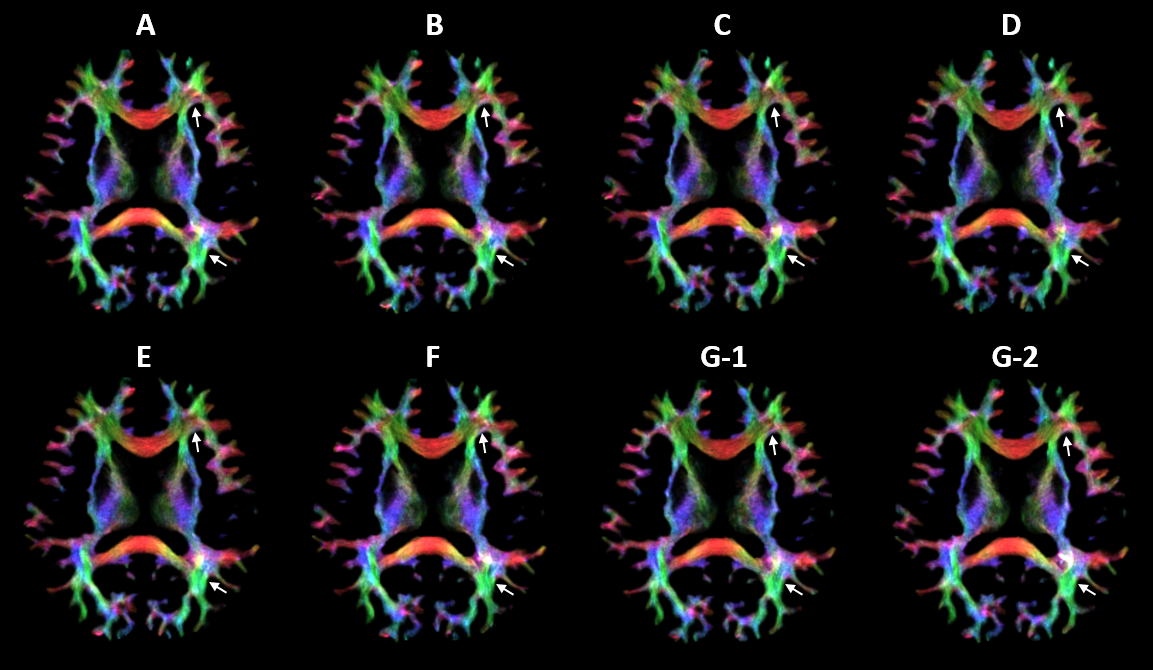
TDI images of subject II from all scans are shown in Fig.1. The direction-encoded maps illustrate that the tractography appears to be very similar, except for some regions such as the frontal forceps and the region between the optical radiation and the occipital forceps where the track directions are complicated. These differences could occur during every step of post-processing, or could even be due to head motion during acquisition.
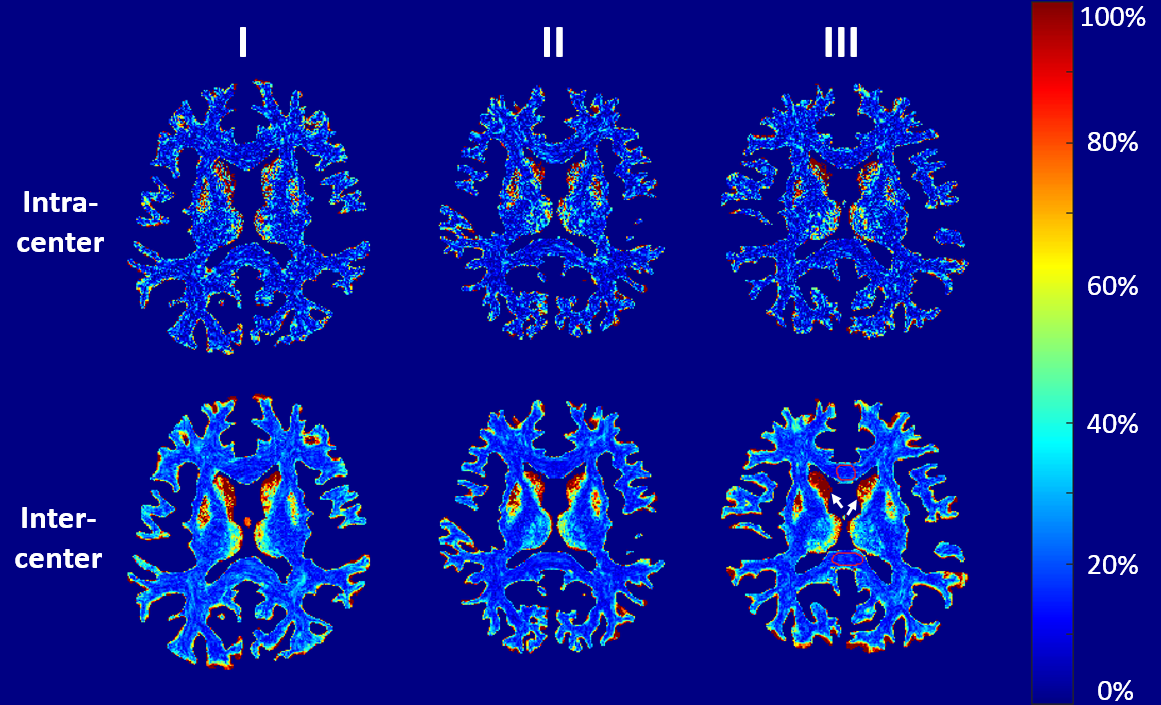
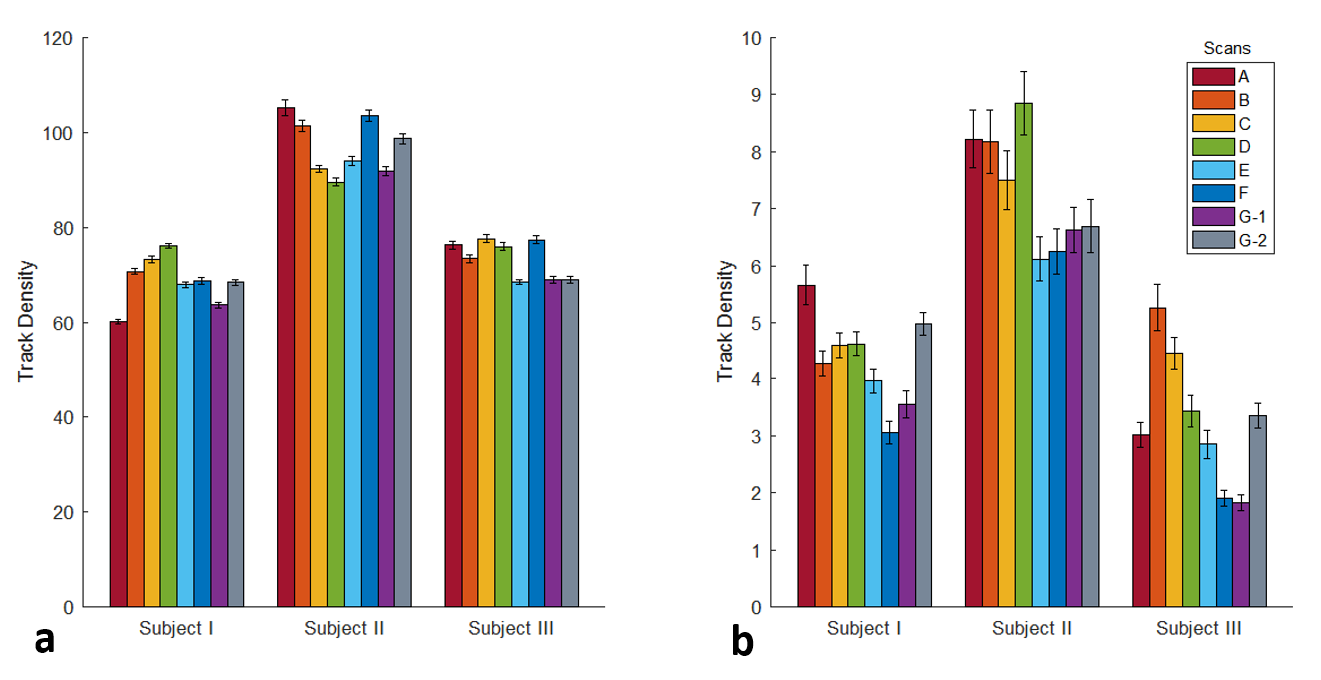
The CV maps of intra-center and inter-center TDI images are shown in Fig. 2. The CVs are mainly ranged from 10% to 25%, and are mostly similar but slightly lower in intra-center than that in inter-center. This means the consistency of different scanners is comparable to the reproducibility of one scanner. Moreover, the CV is lower in WM than that in GM, owing to higher track density in WM, which leads to a low standard deviation and high mean value in the CV calculation. To investigate how much the TDI value of each scan differs from the others, mean value with standard error within the corpus callosum (CC) and the head of caudate nucleus (CN) are plotted in Fig. 3. The intra-center scans show comparable differences in mean value and standard error with inter-center scans.
Conclusion
The TDI results indicate that the data estimation is feasible for more demanding diffusion acquisition from multicenter scanners, and the results from the CV maps lay a solid foundation for future multicenter cooperation.Acknowledgements
No acknowledgement found.References
[1] Sasaki M, Yamada K, Watanabe Y, et al. Variability in absolute apparent diffusion coefficient values across different platforms may be substantial: a multivendor, multi-institutional comparison study. Radiology, 2008, 249(2): 624-630.
[2] Zhu T, Hu R, Qiu X, et al. Quantification of accuracy and precision of multi-center DTI measurements: a diffusion phantom and human brain study. Neuroimage, 2011, 56(3): 1398-1411.
[3] Teipel S J, Reuter S, Stieltjes B, et al. Multicenter stability of diffusion tensor imaging measures: a European clinical and physical phantom study. Psychiatry Research: Neuroimaging, 2011, 194(3): 363-371.
[4] Calamante F, Tournier J D, Jackson G D, et al. Track-density imaging (TDI): super-resolution white matter imaging using whole-brain track-density mapping. Neuroimage, 2010, 53(4): 1233-1243.
[5] Marques J P, Kober T, van der Zwaag W, et al. MP2RAGE, a self-bias field corrected sequence for improved segmentation at high field. Proceedings of ISMRM. 2008: 1393.
[6] Marques J P, Kober T, Krueger G, et al. MP2RAGE contrast optimization at 7T and applications. Proceedings of ISMRM. 2009, 17: 2698.
[7] O’Brien K, Krueger G, Lazeyras F, et al. A simple method to denoise MP2RAGE. Proceedings of ISMRM. 2013: 269.
[8] Setsompop K, Gagoski B A, Polimeni J R, et al. Blipped-controlled aliasing in parallel imaging for simultaneous multislice echo planar imaging with reduced g-factor penalty. Magnetic Resonance in Medicine, 2012, 67(5): 1210-1224.
[9] Caruyer E, Lenglet C, Sapiro G, et al. Design of multishell sampling schemes with uniform coverage in diffusion MRI. Magnetic resonance in medicine, 2013, 69(6): 1534-1540.
[10] Smith S M. Fast robust automated brain extraction. Human brain mapping, 2002, 17(3): 143-155.
[11] Jeurissen B, Tournier J D, Dhollander T, et al. Multi-tissue constrained spherical deconvolution for improved analysis of multi-shell diffusion MRI data. NeuroImage, 2014, 103: 411-426.
[12] Smith R E, Tournier J D, Calamante F, et al. Anatomically-constrained tractography: improved diffusion MRI streamlines tractography through effective use of anatomical information. Neuroimage, 2012, 62(3): 1924-1938.
Figures